EUR/USD Technical OutlookEUR/USD is currently trading within a Descending Triangle formation. At present, the pair shows a higher probability of an upside breakout from this structure. A confirmed break above the immediate resistance zone at 1.1428 – 1.1430 could accelerate bullish momentum, opening the way toward the next key resistance level at 1.1485.
On the other hand, if the pair fails to sustain above the triangle and breaks to the downside, price may extend losses toward the 1.1375 – 1.1360 support area. From this zone, a potential corrective rebound could occur before the broader bearish trend resumes.
Overall, short-term direction hinges on the breakout of the descending triangle, with 1.1428 – 1.1430 as the critical level to watch for bulls, and 1.1375 – 1.1360 for bears. FOREXCOM:EURUSD
EURUSD trade ideas


EUR/USD Macro Drift — 2000-Pip Collapse Ladder Initiated🧠 Idea Title:
EUR/USD Macro Drift — 2000-Pip Collapse Ladder Initiated
⸻
📍 Idea Overview:
Following the invalidation of the prior bullish thesis, EUR/USD has re-engaged its macro Renko trajectory, confirming a bearish reversal from the 1.159x region. The Codex macro brick logic now signals a fresh 2000-pip descent targeting 1.1000 → 1.0000 → 0.8000.
Stacked entries between 1.1590 and 1.1550 align with the reactivation of the downward drift field. The latest momentum confirms the activation of the bearish ladder.
⸻
🔻 Current Active Positions:
• Sell Ladder: 1.1590 → 1.15500 (5 layered entries,
• Total Risk: SL anchored above 1.1600
• Macro Targets:
• TP1: 1.1000
• TP2: 1.0000
• TP3 (deep collapse): 0.8000
⸻
🧠 Codex Rationale:
• 2000-pip Renko macro brick projected from 1.20–1.00 (prior structure)
• 10-pip bearish reversal confirmed below 1.1580
• Liquidity fracture visible on M5/M15
• Volume divergence supports southbound drift
• Fed narrative weakness and structural USD demand (esp. after Kruger resignation)
⸻
🔧 Risk-to-Reward Breakdown (Approx):
Entry Zone SL Target R:R
1.155–1.159 1.160 1.1000 10:1+
1.0000 20:1+
0.8000 30:1++
⸻
🧭 Strategy Status:
✅ Reversal Confirmed
✅ Anchor Trades Set
🔁 Stacking Ongoing
⚠️ SL Dynamic Near 1.1600
🚨 High Volatility Potential
⸻
#EURUSD #Forex #MacroDrift #RenkoStrategy #BearishReversal #TradingView #CodexAthenon #TechnicalAnalysis #PriceAction #SmartMoney

EURUSD short term buy Price closed with a daily morning star candlestick formation , I expect a little retracement to cover up the fvg before a short move to the upside

EURO long: The "What If?" tradeHello traders
The Euro is showing signs of bottoming out at the weekly support levels against
USD, JPY, CAD and AUD.
MOST IMPORTANT:
USD:
While King Dollar is clearly reigning after the FOMC indication not to expect rate cuts any time soon and solid economic data, the "What If" factor is NFP tomorrow and to a minor extent month end settling. If the NFP print comes in significantly lower than expectations, the Euro may pop higher. If the print is above expectations, still take a moment to check where the most jobs are. if it is in hospitality and leisure, it is probably summer hiring.
JPY: The BoJ kept rates unchanged.
CAD: The loonie is under siege with Trump's renewed 35% tariffs announced today. However, IF Russian sanctions against oil sales come to fruition, the CAD may strengthen. Watch Oil prices.
AUD: CPI came in below expectations. PPI has just printed lower too.
The Euro Zone's unemployment rate ticked down and German CPI ticked higher. The impact of tariffs seems to be priced in for the moment.
The biggest "What If" ?
The decision of the Federal Appeals Court if the International Trade Court verdict is upheld. In that case, it is all but guaranteed that it will reach the Supreme Court. IF the Supreme Court declares it unlawful, the USD MAY drop like a lead balloon.
The risk assets in these charts are all at right around the weekly 20 SMA.
www.tradingview.com
Just some food for thought. Let me know what your thoughts are.

EURUSD plunges without brakes – The bears take full control!EURUSD continues its steep decline as both macroeconomic and technical pressures mount. A trade deal unfavorable to the EU, combined with the Fed’s hawkish stance, has fueled USD strength and dragged the euro sharply lower. At the same time, strong U.S. labor data and rising employment costs further reinforce the bearish outlook.
On the H1 chart, EURUSD is clearly moving within a descending channel. Key price zones have been broken with no significant bullish reaction, indicating that sellers remain firmly in control. The market is heading toward a psychological support area, with no signs of reversal as RSI stays weak.
I remain biased toward SELL setups on any short-term pullbacks, avoiding countertrend trades in this environment. If downside momentum continues, deeper targets may still be ahead.
In a market dominated by bearish sentiment, trading with the trend remains the smartest and safest approach.

EURUSD retesting neckline EURUSD has made the move we were patiently waiting for . it went to test our neckline of the double bottom or M pattern , now we just need to wait for confirmation for the long-term sell before we enter , lets keep an eye

EURUSD – German GDP boosts EUR, but USD still holds the reins Germany’s recently released GDP data exceeded expectations, acting as a catalyst for EURUSD to rebound after a steep decline. However, this upward move remains fragile, as the USD continues to dominate the market—especially with several key U.S. economic reports set to be released later this week.
On the chart, EURUSD has just bounced from the 1.15000 support zone, which has historically served as a strong floor. If the price holds above this level and breaks the downtrend line, the short-term target could move toward the 1.15700 resistance zone.
Still, the path ahead won’t be easy. The market is closely watching upcoming U.S. data, such as the jobs report and the Core PCE index—the Fed’s preferred inflation gauge. If these figures come in strong, the USD could regain strength and put pressure back on EURUSD.

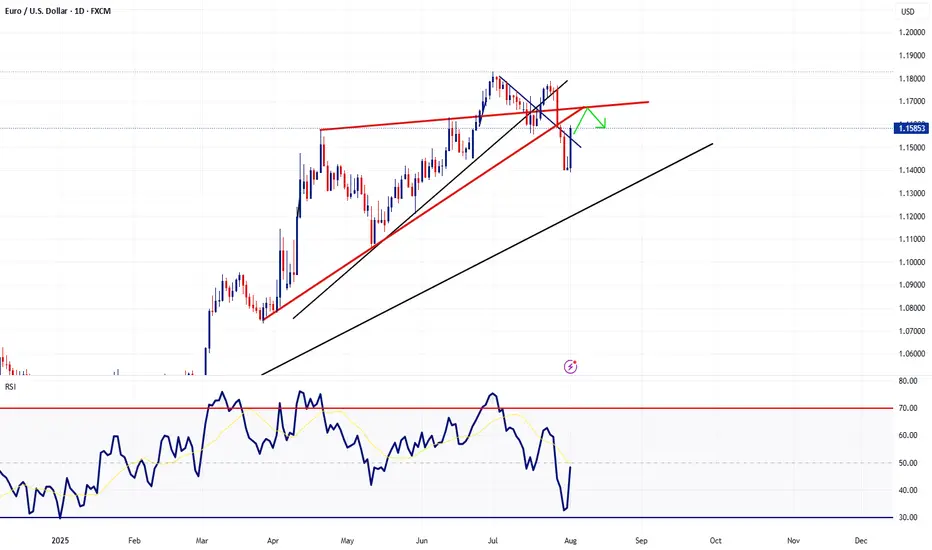
EUR/USD: A Fragile Rebound Within a Broader Bearish TrapEUR/USD has managed to stage a slight recovery after plunging through the key 1.1680 support — a level that had held firm for two weeks. The pair is now hovering just above 1.1500, but the bounce appears shallow and unconvincing. Volume remains low, momentum indicators offer little confirmation, and the broader structure still points to a prevailing downtrend.
On the H2 chart, price has rebounded from the 1.1505 area — a minor support formed during July's short-term consolidation. Yet, the EMA slope remains strongly negative, and RSI is struggling below the neutral 50 mark after exiting oversold territory. The structure continues to display classic lower highs and lower lows, with the 1.1585–1.1600 zone emerging as a potential resistance area for bears to re-enter.
From a macro perspective, the U.S. dollar remains supported by expectations that the Fed will maintain a hawkish stance, fueled by solid GDP, durable goods, and PCE data. In contrast, the Eurozone struggles with signs of stagnation, with both services and manufacturing PMIs deteriorating — most notably in Germany. This policy divergence continues to favor the greenback.
Unless bulls manage to decisively reclaim the 1.1600 zone with strong follow-through buying, any rebound risks being nothing more than a dead cat bounce. The downside target remains near 1.1460 – 1.1440 in the near term.

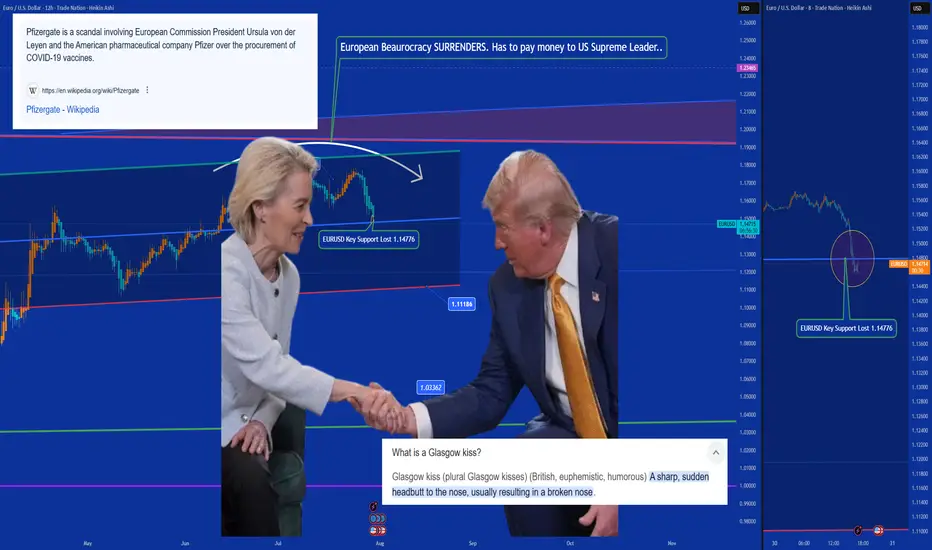
Ursulization = Bureaucracy > Democracy (a.k.a. The Glasgow Kiss)🤝💥 Ursulization – Bureaucracy Replaces Democracy (a.k.a. The Glasgow Kiss) 🇺🇸🇪🇺
📍Background:
The media spun it as a "15% tariff agreement"…
But in reality, this wasn’t diplomacy — it was a disguised capitulation.
And the stage? None other than Scotland, ancestral ground of Donald J. Trump.
So when Ursula von der Leyen came seeking a gentle diplomatic handshake…
What she received instead was the infamous Glasgow Kiss — sudden, sharp, and unmissable.
💥 What’s a Glasgow Kiss?
A British slang term for a violent headbutt to the face —
No grace. No warning. Just raw force.
💬 The Real Story:
Ursula von der Leyen — unelected, unaccountable —
signed off on $1.4 trillion in U.S.-bound capital flows:
💸 $750B to buy American energy
🛠 $600B in U.S. infrastructure, defense & industry
All to sidestep 50% tariffs the Trump team had ready to roll.
But here's the kicker:
She wasn’t acting on behalf of European citizens.
She was speaking for the bureaucracy, not the people.
🔥 Welcome to Ursulization:
Where democracy is sidelined by unelected power.
Where negotiations happen in silence.
Where scandals like PfizerGate get buried while the euro breaks down.
📉 EUR/USD just lost key support at 1.14776 —
The chart shows t he cost of surrender.
💉 PfizerGate Reminder:
Ursula already faced heat for secretive vaccine contracts with Pfizer.
Now, she’s handing over Europe’s industrial backbone —
To Trump. In Scotland. With no public mandate.
📌 Conclusion:
Trump didn’t compromise — he collided.
Europe didn’t resist — it surrendered.
This wasn’t diplomacy.
It was a Glasgow Kiss — a collision between legitimacy and bureaucratic power.
👑 One elected by the people (Trump). One not elected at all (Woke agenda style Ursula).
💰 One walks away with trillions (Trump). The other, with silence (Ursula 'Von der Pfizinen never electenen'').
One Love,
The FXPROFESSOR 💙
ps. Till we can bring Democracy and Europe back.
Disclosure: I am happy to be part of the Trade Nation's Influencer program and receive a monthly fee for using their TradingView charts in my analysis. Awesome broker, where the trader really comes first! 🌟🤝📈

EURUSD testing necklineEURUSD has made the move we were waiting for . it went to test our neckline of the double bottom or M pattern , now we just need to wait for confirmation for the longterm sell before we enter

EURUSD - Scaling into Confluence ZoneTaking a look at EURUSD on the daily timeframe we had quite the rebound in EURUSD last Friday following the NFP report. However price action is now heading towards a cluster of resistance levels which is why I'm implement my scaling in technique using a specially designed and programmed EA that i use for MT5.
== TRADE PLAN ==
Scale-in with short positions and target a 0.5% growth on the account. In other words, once the basket arrives in profit by 0.5% CLOSE ALL.
Trade Safe - Trade Well
EURUSD Current Market Situation Technical Analysis Current Market Situation
The chart displays a Double Top pattern, a strong bearish reversal signal that often indicates the start of a downward move.
The price has already broken the neckline, and it is now approaching a retest of both the neckline and the broken trendline, which serves as a critical resistance area for potential bearish continuation.
Key Zones
Neckline Retest Zone: Around 1.1600, acting as immediate resistance.
Trendline Retest Zone: Between 1.1670 – 1.1700, serving as an additional resistance level to confirm the bearish bias.
Potential Scenarios
✅ Bearish Scenario (Preferred):
If price respects the retest zones and fails to break higher, we may see a decline toward:
Target 1: 1.1500
Target 2: 1.1400
Target 3: 1.1300
⚠ Bullish Scenario (Alternative):
A clear breakout and daily close above 1.1700 would invalidate the bearish outlook and could lead to a bullish reversal.
Conclusion
The market structure currently favors the bears.
Rejection from the neckline or trendline retest zones will provide a strong confirmation for sell positions.
⚠️ Trade at your own risk – We are not responsible for any losses.

EURUSD Will Go Lower! Sell!
Here is our detailed technical review for EURUSD.
Time Frame: 1h
Current Trend: Bearish
Sentiment: Overbought (based on 7-period RSI)
Forecast: Bearish
The market is on a crucial zone of supply 1.158.
The above-mentioned technicals clearly indicate the dominance of sellers on the market. I recommend shorting the instrument, aiming at 1.153 level.
P.S
Please, note that an oversold/overbought condition can last for a long time, and therefore being oversold/overbought doesn't mean a price rally will come soon, or at all.
Disclosure: I am part of Trade Nation's Influencer program and receive a monthly fee for using their TradingView charts in my analysis.
Like and subscribe and comment my ideas if you enjoy them!

EURUSD : Status @ 1/8Direction: Buy
Signal triggered: 1/8/2025
Stop when:
a) Stop Loss @ 1.1400; or if
b) Buy signal triggered
Action:
Buy the dip (or not at all)
Good luck.
P/S: Price has made a sudden rise, and it would not be wise to buy now. It is better to wait for the sell signal.
The day before the big rise, the signal was hesitant to give a BUY. I think the MARKET is unsure as well. Price can move either way. Missing out is not necessarily a bad idea, as such moves can easily result in huge losses.

MARKET CONTEXT...#1 TOOL FOR PROFITABLE TRADING...EURUSD EXAMPLEHey hey TradingView family! Hope you are all doing amazing! I just wanted to come on and make a video speaking on market context, the #1 tool/idea that helped me go from struggling to profitable trader.
Understanding the bigger picture in trading, like TRULY understanding the higher timeframe perspective will work wonders in your analysis & trading whether you are a scalper or a position trader. It gives you the context for what market and the stage of market you are in whether in short term or longer term positions, which will IMMEDIATELY give you an edge.
Understanding=profitability in the markets. So does simplicity.
So watch this video as many times as you guys need, keep it simple, and watch this change your trading starting TODAY for the GOOD!
Cheers!

Bears on EURO My tools are suggesting a Bearish tone on the EURO in the coming weeks although we have to have a slight retracement higher into the outlined level then head on lower

EURUSD BULLISH TREND EUR/USD is expected to remain in its bearish trend until it approaches the key support levels around 1.11290 to 1.09744. These zones could serve as potential turning points, where a bullish reversal may emerge if supported by fundamental or technical catalysts.

EUR/USD: Risk OnEUR/USD Daily Setup: Riding Risk-Off into the 1.1050 Zone
Chart: Daily (showing 0.146–161.8% Fib extensions, supply/demand zones, trendline)
Analysis & Plan:
Macro Drivers: Fed/ECB rate divergence and yield spread keep USD bid; risk-off bias intact.
Key Levels:
Supply (short zone): 1.1636–1.1750
Invalidation: Daily close above 1.1800
Demand Targets:
1.1278 (100% Fib ext)
1.1056 (161.8% Fib ext + demand confluence)
1.0521 (“strong low” area)
Trigger:
Risk-On Break: Watch for rejection at 1.1589–1.1636; failure confirms fresh sell signal.
Trade Execution:
Enter Short near 1.1589–1.1636 on bearish price action / daily close below 20-day MA.
Stop-Loss: Above 1.1800 supply high.
Take Profits: Scale out at 1.1278, then final at 1.1056.
Rationale: Aligns Fibonacci confluence zones with macro USD strength and trendline support breaks.
Tags:
#EURUSD #Forex #Fibonacci #SupplyDemand #TechnicalAnalysis #TradingVie

Macro View on EUR/USDMonetary Policy Divergence
The Federal Reserve maintained its target federal funds rate at 4.25 – 4.50 percent, citing a resilient labour market and persistent inflationary pressures (Federal Reserve, 2025).
By contrast, the European Central Bank’s deposit facility rate stands at 2.00 percent, reflecting its earlier tightening cycle and more cautious approach to rate cuts (Federal Reserve Bank of St. Louis, 2025).
Inflation Differential
U.S. headline CPI rose 2.7 percent year-on-year in June 2025, with core CPI at 2.9 percent (U.S. Bureau of Labor Statistics, 2025).
Euro-area inflation was 2.0 percent in June, broadly in line with the ECB’s target (Eurostat, 2025).
Yield Spread
The 10-year U.S. Treasury yield hovered around 4.38 percent, versus roughly 2.4 percent on the bund, underpinning dollar strength (Federal Reserve Bank of St. Louis, 2025).
Growth Outlook
The U.S. economy continues to outperform, supported by robust consumption and a tight labour market.
Advanced-economy growth is projected at 1.4 percent in 2025, with the euro-area likely trailing, given headwinds from energy costs and subdued investment (International Monetary Fund, 2025).
Technical Structure
Downtrend in Place: Recent price action shows a break of the 20-day MA and loss of structure below 1.1700.
Supply Zone near 1.1750–1.1800 offers resistance.
Demand Zones at 1.1100–1.1200 and 1.0750–1.0850 coincide with long-term trendline support (see chart).
Outlook & Scenarios
Near-Term Bearish: Continued USD strength and fading risk appetite may drive EUR/USD toward the 1.1100 demand zone.
Medium-Term Range: If ECB signals a dovish pivot and U.S. data disappoints, expect a bounce into 1.1200–1.1400.
Key Pivot: A sustained break below 1.0750 would open targets toward 1.0200, the “discount” zone from late 2024.
References
European Central Bank. (2025, August 1). ECB deposit facility rate for euro area (ECBDFR) . FRED, Federal Reserve Bank of St. Louis.
Eurostat. (2025, June). Inflation in the euro area . ec.europa.eu
Federal Reserve. (2025, July 30). Federal Reserve issues FOMC statement. www.federalreserve.gov
Federal Reserve Bank of St. Louis. (2025, July 30). Market yield on U.S. Treasury securities at 10-year constant maturity . FRED.
International Monetary Fund. (2025, July). World Economic Outlook Update: July 2025. www.imf.org
U.S. Bureau of Labor Statistics. (2025, July). Consumer Price Index Summary – June 2025. www.bls.gov

EURusd short position 31/07/2025English : According to our analysis, we anticipate a bearish scenario.
Morocan Darija : kanchofo d'apres l'analyse dyalna antsanaw hboot
ATENTION : I only share my ideas, not signals

EURUSD: Strong Bullish Sentiment! Long!
My dear friends,
Today we will analyse EURUSD together☺️
The price is near a wide key level
and the pair is approaching a significant decision level of 1.15859 Therefore, a strong bullish reaction here could determine the next move up.We will watch for a confirmation candle, and then target the next key level of 1.16494.Recommend Stop-loss is beyond the current level.
❤️Sending you lots of Love and Hugs❤️
