EURUSDEUR/USD is the most traded currency pair in the world, representing the exchange rate between the euro (EUR) and the US dollar (USD). It reflects how many US dollars are required to purchase one euro. Introduced in 1999 with the launch of the euro, this pair has become a global benchmark due to the economic size and influence of both the Eurozone and the United States. It is highly liquid and closely watched by traders, investors, and policymakers, with its value shaped by monetary policy, interest rate differentials, macroeconomic indicators, and geopolitical developments.
Historically, EUR/USD has seen major swings. In the early 2000s, the pair fell to around 0.82 before rallying to a peak above 1.60 in 2008 during a period of dollar weakness. It then declined sharply during the European debt crisis. In 2022, amid aggressive interest rate hikes by the US Federal Reserve and rising global uncertainty, the pair briefly fell below parity, trading under 1.00 for the first time in nearly two decades. However, as inflation in the US began to ease and expectations of rate cuts grew, the euro gradually strengthened through 2023 and 2024.
As of August 2025, EUR/USD is trading around 1.15800. This reflects a moderate recovery of the euro from its lows, supported by a more stable Eurozone economy and a softer US dollar. The pair remains sensitive to central bank signals, particularly from the European Central Bank and the Federal Reserve, and is likely to continue reacting to shifts in monetary policy, inflation data, and global risk sentiment. EUR/USD remains a cornerstone of the forex market, widely used by traders for both short-term strategies and long-term positioning.
EURUSD trade ideas

EUR/USD Reversal or Trap? 4H Clean Breakdown InsidePrice just tapped into a high-probability sell zone after a corrective Wave 2 structure. With sellers already active at 1.16342 and 1.17635, this setup is not just textbook—but a potential goldmine for swing traders.
🔻 Is this Wave 3 continuation about to begin?
🔍 Liquidity swept. Zones respected. Structure still bearish.
⚠️ Many traders will miss the bigger picture here—will you?
👇 Drop your thoughts:
Are we about to break 1.13000?
Do you agree with the Elliott Wave count?
What’s your bias on DXY?
💬 I personally reply to every comment—let’s build this chart together.
🔥 If you caught the entry, show your entry point and reasoning—let’s level up as a team.

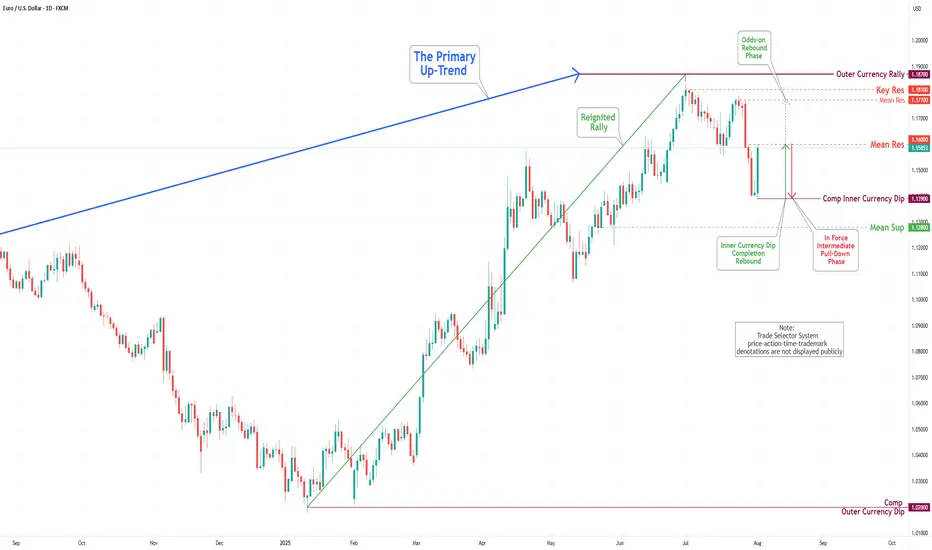
EUR/USD Daily Chart Analysis For Week of August 1, 2025Technical Analysis and Outlook:
In this week's trading session, the Euro experienced a significant drop, reaching the 1.139 level, and completing what is referred to as the Inner Currency Dip. As a result of the completion, the currency reversed direction and made a strong rebound, hitting the Mean Resistance level at 1.160. Recent analyses suggest that the Euro is likely to enter a sustained downward move after retesting the Mean Resistance at 1.160, with the target set to revisit the completed Inner Currency Dip at 1.139. However, it is essential to consider the possibility of continued upward momentum towards the Mean Resistance level of 1.177. Such a movement could trigger a significant rebound and lead to the completion of the Outer Currency Rally at 1.187.
EUR_USD POTENTIAL SHORT|
✅EUR_USD has been growing recently
And the pair seems locally overbought
So as the pair is approaching
A horizontal resistance of 1.1632
Price decline is to be expected
SHORT🔥
✅Like and subscribe to never miss a new idea!✅
Disclosure: I am part of Trade Nation's Influencer program and receive a monthly fee for using their TradingView charts in my analysis.

Trailing Stops:Let trades developTrailing stops are one of the most underused tools in a trader’s playbook. Most traders spend hours obsessing over entries, but then wing the exit or bail too early the moment a red candle appears. That’s where trailing stops come in. They give your trades room to breathe, while gradually reducing risk as price moves in your favour.
If you’ve ever caught a good move and felt unsure about how long to hold it, this one’s for you.
Here are three practical ways to trail your stop, stay in the trade, and help manage profitable trades objectively.
1. Trail Behind Structure
This is the simplest and most intuitive method. As the trade moves in your favour, you move your stop just behind the most recent swing high or low. In a long trade, that means raising your stop to sit just below the latest higher low. In a short, you drop it just above the most recent lower high.
This approach works best in clean, trending conditions. It gives the trade room to develop naturally without forcing you to guess the top. You won’t capture the absolute high, but you’ll often stay in the move longer than most.
It also keeps you in rhythm with the market. If the structure is broken, it’s a pretty good sign that the trend is changing or stalling and that’s a logical place to step aside.
Example:
Here’s a clean example of using structure to trail stops on a momentum trade. The entry came on a break and retest of resistance, with the initial stop placed just below the retest level. As the trade moved higher, a series of higher swing lows developed, providing clear reference points to adjust the stop.
It’s not designed to catch the exact top and that’s fine. The goal is to follow price action with minimal lag, using objective structure rather than guesswork.
EUR/USD Hourly Candle Chart
Past performance is not a reliable indicator of future results
2. Use Moving Averages
Trailing stops don’t have to follow every single swing. Sometimes, a smoother option is better, especially if you want to stay in a move that’s trending hard. That’s where moving averages come in.
A short-term exponential moving average like the 9 or 21 EMA can act as a dynamic trailing stop. As long as price remains above the average, the trend is intact and you stay in. If price closes below the EMA in a long trade, or you get a crossover in the opposite direction, that can signal an exit or at least a scale-down.
This method works best in fast, directional markets. It won’t suit every condition, but when the move is strong, letting a trade run along the moving average keeps things simple and stress-free.
Example:
In this short-term 5-minute chart example, the 21 EMA acts as a dynamic trailing stop. There are two common approaches. You can wait for a candle to close below the 21 EMA, or use a crossover trigger where the 9 EMA crosses under the 21 EMA. The choice depends on how tightly you want to manage the trade and how much room you are willing to give it.
S&P 500 5min Candle Chart
Past performance is not a reliable indicator of future results
3. Volatility-Based Stops (ATR)
When the market gets fast and messy, a fixed stop can either get hit too easily or feel too far away. That’s where volatility-based stops come in. The most common tool for this is the Average True Range (ATR).
Instead of using swing points, you trail your stop a set number of ATRs behind the current price. If ATR is rising, your stop gives the trade more room. If volatility shrinks, the stop tightens naturally. It’s an adaptive approach that works well in conditions where price is expanding or moving fast.
A popular setting is to use two times the current ATR value, but you can adjust it to suit your timeframe or risk tolerance.
Example:
This is a classic wedge breakout setup in gold. A trailing stop set at two times the ATR helps manage risk while giving the trade enough room to breathe. As price moves in your favour, the stop tightens automatically based on volatility. It’s worth remembering that trailing stops are only adjusted in one direction. Once set, they follow the move but are never loosened, which means the stop will eventually take you out as momentum fades or the market turns.
Gold Daily Candle Chart
Past performance is not a reliable indicator of future results
Decide on Your Technique BEFORE You Place the Trade
There’s no perfect way to trail a stop. Each method has its strengths. Structure-based stops keep you aligned with price action. EMAs are smooth and simple. ATR lets volatility do the work for you.
The most important thing is to make a decision before you place the trade. Know whether you’re using a manual swing method or a dynamic indicator. Know what would trigger a move in your stop, and what would keep it steady. Avoid changing the plan just because the trade gets emotional.
Trailing stops give you freedom. They let you step back, protect your capital and give your best trades a real chance to develop. Used properly, they enhance trade management consistency.
Disclaimer: This is for information and learning purposes only. The information provided does not constitute investment advice nor take into account the individual financial circumstances or objectives of any investor. Any information that may be provided relating to past performance is not a reliable indicator of future results or performance. Social media channels are not relevant for UK residents.
Spread bets and CFDs are complex instruments and come with a high risk of losing money rapidly due to leverage. 85.24% of retail investor accounts lose money when trading spread bets and CFDs with this provider. You should consider whether you understand how spread bets and CFDs work and whether you can afford to take the high risk of losing your money.
SHORT EURUSD Possible scenarioWeekly chart of EURUSD show potential short coming next coming weeks . MOMENTUM IS UP but the price is declining ,
Two possiblities AT the moment that can play IF ( BIG IF) the price decide to down in the coming days ,
Green arrow show a bounce from 1.1360 area and red arrow show a possiblity for further down to 1.1090.

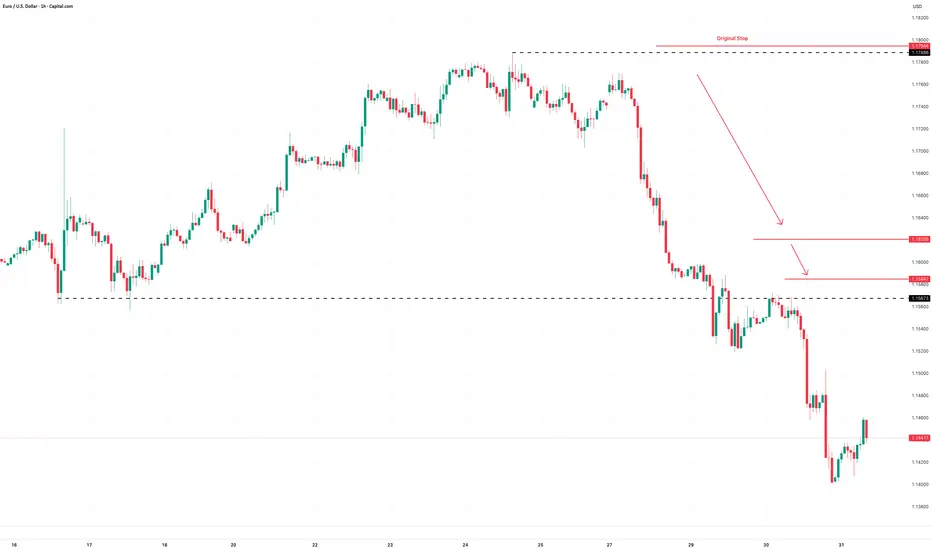
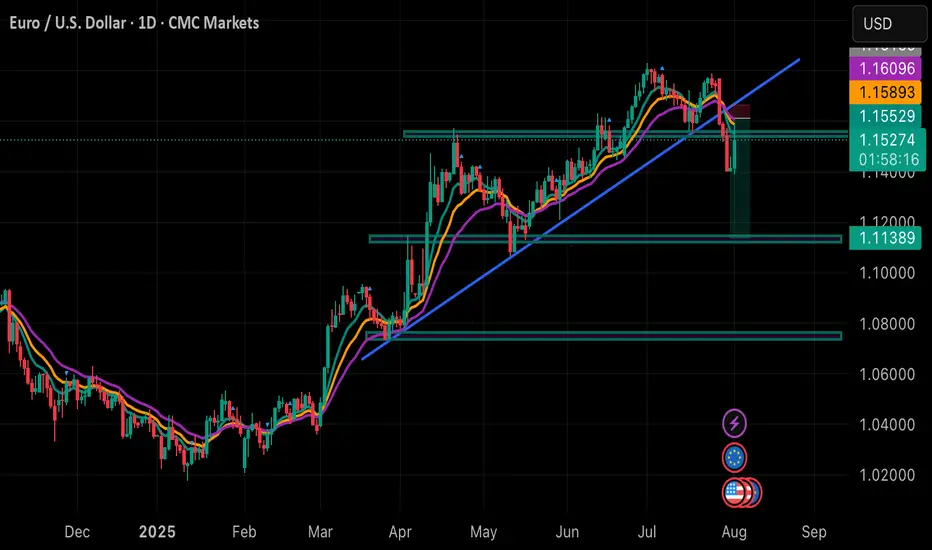
Closed Longs, Now Selling Rallies on EURUSD ReversalAs mentioned in my previous posts, I’m been bullish on EURUSD in the medium term, targeting 1.20 and even beyond.
But no pair—especially not EURUSD, which tends to move more steadily and rationally—goes up in a straight line.
________________________________________
🔹 Last week, the pair stalled just below 1.18, and I decided to close my long trade with a +150 pip gain. That proved to be a wise call, as price dropped hard shortly after.
________________________________________
📉 What’s happening now?
• EURUSD has broken below the rising trendline
• More importantly, it’s broken below the neckline of a double top pattern
• Now trading around 1.1535
This opens the door for a deeper correction, and I expect we could see a test of the 1.1150–1.1100 zone by the end of summer.
________________________________________
📌 Trading Plan:
• I’m now in sell-the-rally mode
• Ideal short entry: around 1.1650, where we also get a favorable 1:3+ risk-reward
• Watch also for interim support around 1.1400
________________________________________
Conclusion:
The bigger picture remains bullish— but this correction looks healthy and isn’t done yet.
Selling rallies makes more sense now, until the structure tells us otherwise.
Disclosure: I am part of TradeNation's Influencer program and receive a monthly fee for using their TradingView charts in my analyses and educational articles.

EURUSDWe have a strong bearish sentiment for EURUSD this week, so meaning big instituttions are selling the pair so we follow their lead. And we can see that we just broke below a support which is now acting as a resistance, more bearish momentum continuation can we expected
Eurusd sell pending order set already. Hopefully on mondayBased on my technical analysis, I strongly speculate EURUSD fall on Monday.
Head & Shoulders on EUR/USD daily!We're currently observing a significant Head & Shoulders pattern forming on the EUR/USD daily chart, with the price just breaking below the neckline on the right shoulder.
Applying standard Head & Shoulders trading principles, we measure the distance from the head's peak to the neckline and project that same range downward from the breakdown point. Based on this, the estimated target price (TP) for the trade lands around $1.135. The stop-loss will be positioned just above the right shoulder to manage risk effectively.
We'll be watching closely to see how this setup unfolds. 🍻

EURUSD – German GDP boosts EUR, but USD still holds the reins Germany’s recently released GDP data exceeded expectations, acting as a catalyst for EURUSD to rebound after a steep decline. However, this upward move remains fragile, as the USD continues to dominate the market—especially with several key U.S. economic reports set to be released later this week.
On the chart, EURUSD has just bounced from the 1.15000 support zone, which has historically served as a strong floor. If the price holds above this level and breaks the downtrend line, the short-term target could move toward the 1.15700 resistance zone.
Still, the path ahead won’t be easy. The market is closely watching upcoming U.S. data, such as the jobs report and the Core PCE index—the Fed’s preferred inflation gauge. If these figures come in strong, the USD could regain strength and put pressure back on EURUSD.


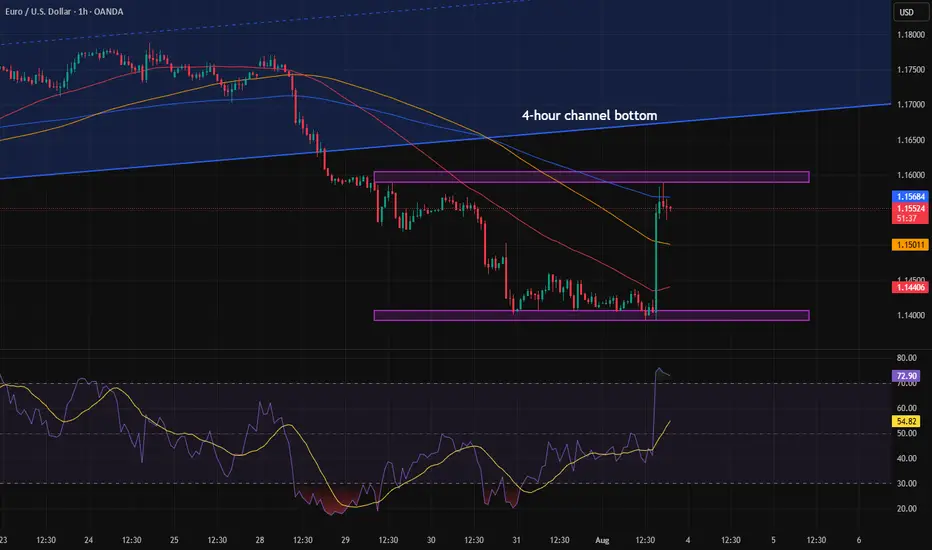
Trend decision after the newsAfter the news, the price nearly reached the bottom of the higher time frame channel and paused. We need to see whether the price can break into the channel or not. Personally, I don’t think that will happen. I believe a range will form within the marked zone, and then the price will drop further.
Fakeout before huge breakout in EURUSD#EURUSD Fakeout before huge candle breakout.
Just a learning experience how fakeouts are very frequent on forex and crypto market

EURUSD 60/15 Pullback ShortOverall down trend. Now the price is located at the defending gap and stay above. Expected to break up and reach the sell zone then drop. Set alarm on lower sell zone and monitor.

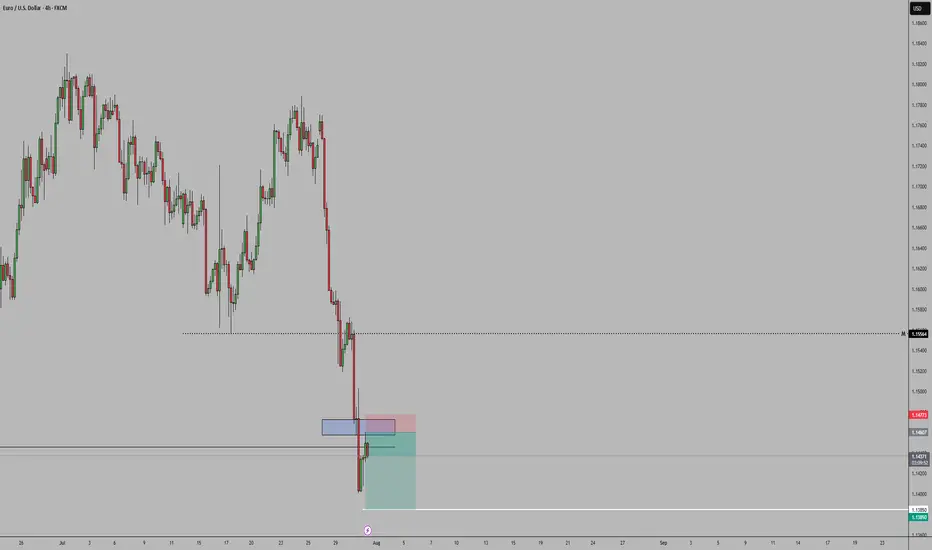
EURUSD – Smart Money Short Setup During NFP Friday | ICT Concept
EURUSD is trading inside a well-defined bearish structure after multiple internal liquidity sweeps during the London and Asia sessions.
As we enter the New York Killzone, price has returned to a bearish OB near the NY Midnight Open, with clear signs of exhaustion.
The pair failed to break above the Thursday OB zone, and the 15M chart shows consecutive MSS and BOS patterns, indicating supply is in control.
🧠 Trade Idea (Execution Plan):
Sell Limit: 1.14183
SL: 1.14422
TP1: 1.13877
TP2: 1.13608
TP3: 1.13351
📌 Confluence:
Bearish OB
NY Midnight Open rejection
MSS on LTF
RSI/Williams %R Overbought
📉 Structure: Bearish
🕒 Session: New York (NFP Volatility Expected)
💡 Context: USD is likely to strengthen after deep retracement into DXY OB, targeting 100.5–100.7
If price invalidates 1.14422 with bullish displacement, setup becomes void.
Patience is key during high-impact news – let Smart Money show their hand.

EURUSD Bear dominating the market30th June Daily candle closed with strong bearish.
we could observed a drop-base-drop candle pattern in a lower time frame.
for today plan:-
i will wait at the "base" area around 1.147*** area for the bearish signal.
calculate your own risk & reward.
Good luck

EURUSD NOWWe've got EURUSD now waiting for a mitigation of the OB to take 15m high or maybe shorting until 1D low. but most probably we take long because of a weak body close that signals a weak power of sellers.

Euro-dollar retreats after the trade deal and divergent GDPEuro-dollar reached six-week lows on 1 August as traders continued to digest the trade deal between the EU and the USA which is widely viewed as being negative for the former. 30 July GDP releases from the eurozone and the USA also showed that American growth is much stronger, but eurozone-wide flash GDP for the second quarter was still slightly better than anticipated. The focus now turns to reactions to new tariffs and the NFP.
$1.14 looks like an important technical reference which might resist testing depending on the results of the job report. With fairly low volume relative to April’s peak and a clear oversold signal from the slow stochastic, a pause around here seems more likely than immediate continuation lower if considering only TA. 31 July’s near-doji slightly below the 100 SMA might suggest some demand for buying.
The obvious short-term resistance would be the confluence of the 50% monthly Fibonacci retracement and the 100 SMA around $1.147. The 61.8% Fibo slightly below $1.13 might be an area of support. Short-term performance depends primarily on the result of the NFP and the reaction to these; the consensus of 110,000 for total nonfarm seems too low relative to the average over the last several months, so a surprise higher might be more likely than lower.
This is my personal opinion, not the opinion of Exness. This is not a recommendation to trade.

EURUSD ahead of NFPEURUSD is still trading within the range established after Wednesday’s news.
We’re watching for a close above 1,1503, which would confirm a potential buying opportunity.
Today at 1:30 PM (London), the NFP data will be released, which could further impact price action - especially if a reversal is underway.
In case of a decline, the next key support level to watch is around 1,1346.

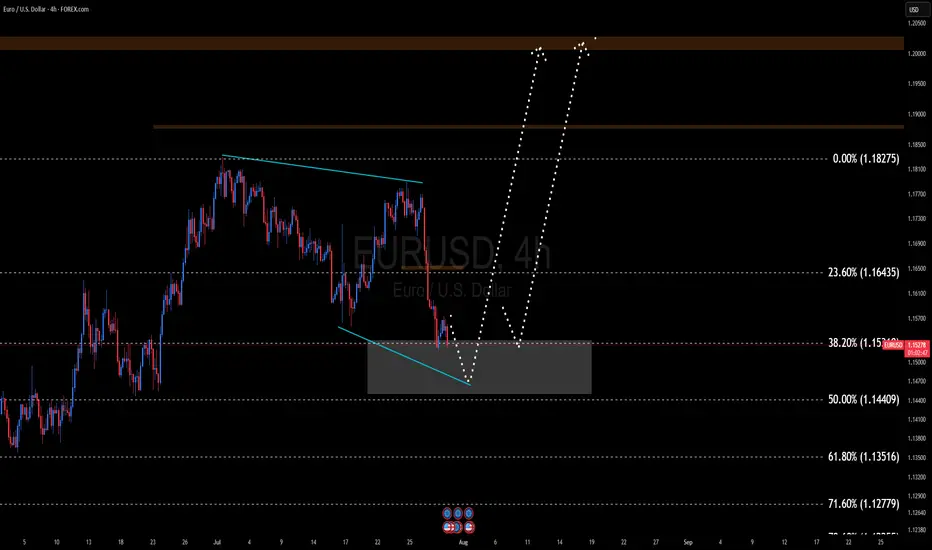
EURUSD BULLISH TREND EUR/USD is currently in a transitional phase and appears to have completed its retracement . It is expected to enter a bullish trend, with a possible breakout from the 1.14500 – 1.15200 range. These levels may serve as key turning points for the upcoming movement.
EURUSD – Will the bullish parallel channel hold?The EUR/USD currency pair is currently trading within a clearly defined bullish parallel channel, as shown on the 4-hour chart. This channel has provided consistent directional structure over recent weeks, with price respecting both its upper resistance and lower support boundaries. At present, the pair is approaching the lower end of this channel, raising the critical question: will it bounce off support and continue the bullish trajectory, or will it decisively break down, opening the door to lower price targets?
Bullish parallel channel
On the 4-hour timeframe, the EUR/USD has been consistently moving within a bullish parallel channel, characterized by higher highs and higher lows. This price structure suggests sustained upward momentum, with the top of the channel acting as dynamic resistance and the bottom as reliable support. Today, price action is testing the lower boundary of the channel once again. A successful hold at this level could confirm continued bullish structure and open the door for a potential rebound.
Bullish scenario
In the bullish scenario, the EUR/USD holds its ground at the support region around 1.164, where the lower boundary of the channel intersects with price. For upward continuation, it must overcome the short-term resistance posed by the 4-hour Fair Value Gap (FVG) between 1.169 and 1.174. A reclaim and close above this zone could signal a shift in short-term momentum and lead to a move back toward the upper boundary of the channel. However, the path upward is not without resistance , price must navigate through potential supply zones and maintain higher lows to preserve the bullish structure.
Bearish scenario
On the other hand, a break and close below the channel support could indicate a change in market sentiment and invalidate the bullish pattern. In this bearish case, we would expect a structure break confirmation followed by a possible retest of the broken trendline and the 4-hour FVG. If this retest fails to reclaim the trendline, bearish continuation becomes more likely. The next significant area of interest lies around the 1.150 level, where a bullish 4-hour FVG exists. This zone could act as a potential short-term support and serve as a target for the downside move before any meaningful bounce occurs.
Final thoughts
The EUR/USD pair is currently at a technical crossroads. Traders should watch closely for price behavior around the lower channel boundary to determine whether bullish momentum will resume or whether a bearish breakout will set the tone for deeper retracement. Confirmation, either through a bounce or a breakdown with a retest, will be key in validating the next directional move.
-------------------------
Disclosure: I am part of Trade Nation's Influencer program and receive a monthly fee for using their TradingView charts in my analysis.
Thanks for your support. If you enjoyed this analysis, make sure to follow me so you don't miss the next one. And if you found it helpful, feel free to drop a like 👍 and leave a comment 💬, I’d love to hear your thoughts!

EURUSD plunges without brakes – The bears take full control!EURUSD continues its steep decline as both macroeconomic and technical pressures mount. A trade deal unfavorable to the EU, combined with the Fed’s hawkish stance, has fueled USD strength and dragged the euro sharply lower. At the same time, strong U.S. labor data and rising employment costs further reinforce the bearish outlook.
On the H1 chart, EURUSD is clearly moving within a descending channel. Key price zones have been broken with no significant bullish reaction, indicating that sellers remain firmly in control. The market is heading toward a psychological support area, with no signs of reversal as RSI stays weak.
I remain biased toward SELL setups on any short-term pullbacks, avoiding countertrend trades in this environment. If downside momentum continues, deeper targets may still be ahead.
In a market dominated by bearish sentiment, trading with the trend remains the smartest and safest approach.
