31/07/25 Price break downSame again people although different model this time, kept it simple with a two stage SMT and a 4hr TPD although it arguably got indvalidated plus my 6hr tpd analysis was wrong but youll see when you hopefully watch
EURUSD trade ideas

could continue to trendI am still fairly new to trading. It took my quite some time to analyze this chart, it was a trend, then it became a ranged market. I had difficulty finding a support, however, i did find my middle support, it is the black line, it could possible drop there, or, it would stay in my green support

Eurusd techinical analysis.Eurusd techinical analysis next move posibale at h1 time frame not finchinal advice.

DeGRAM | EURUSD reached the lower boundary of the channel📊 Technical Analysis
● Price sliced through the channel mid-support and the inner trend-fan, closing below 1.1573; the break was retested (grey circle) and rejected, confirming a bear continuation from the sequence of lower-highs.
● The move unlocks the descending channel’s lower rail near 1.1450, while interim demand sits at the May pivot / 0.618 swing 1.1520.
💡 Fundamental Analysis
● EZ data underwhelmed (German Ifo, EZ consumer-confidence) just as Fed officials warned rates may stay “restrictive for longer,” widening the short-rate gap and refreshing USD bids.
✨ Summary
Short 1.1590-1.1615; hold below 1.1573 targets 1.1520 ➜ 1.1450. Bias void on an H1 close above 1.1660.
-------------------
Share your opinion in the comments and support the idea with a like. Thanks for your support!

EUR-USD Bearish Breakout! Sell!
Hello,Traders!
EUR-USD made a bearish
Breakout of the key horizontal
Level of 1.1460 then made
A retest and a pullback so
We are bearish biased and
We will be expecting a
Further bearish continuation
Sell!
Comment and subscribe to help us grow!
Check out other forecasts below too!
Disclosure: I am part of Trade Nation's Influencer program and receive a monthly fee for using their TradingView charts in my analysis.

On the look out for a break above 1.14829 to confirm BullishHi Friends - Here is my own bias. Not a financial advise.
1. Buying intent spotted after the break of structure on the 1h time frame at 1.14381 BOS
2. Price retraced back to the liquidity that drove price back up on July 10th at 1.14005
3. We are looking out for price to close above 1.14805 and seek liquidity to move to the up side.
4. Possible consolidation between 1.14024 and 1.14858
Violation of the setup above will lead to a movement to the downside.
See you on the profitable end.
The Surge!

EURUSD Outlook – From Bias to Execution Previous day closed bearish, leading to a sell bias, on the 45M, I marked my possible entry and exit area.

Trade Bias: I’m looking to buy EURUSD, but only on confirmationFading Fear, Not Chasing Highs 💡💶
This isn’t about momentum. It’s about patience. EURUSD has been under pressure, but I’m not selling panic — I’m watching for a buy signal to fade the current selloff. With dollar fundamentals shifting, this pullback could be setting up opportunity — not continuation.
📈 Trade Bias: I’m looking to buy EURUSD, but only on confirmation the sell pressure is cooling.
Here’s the fundamental picture:
✅ US growth is slowing; Q1 GDP contracted slightly
📉 Dollar bears are at a 4-year high, signaling sentiment exhaustion
🔁 ECB paused cuts, holding steady at 2.15% — EUR fundamentals are stabilizing
💬 US tariffs could push inflation up, but squeeze household demand
⚠️ I’m not expecting new highs — just a relief move once the selling slows
The dollar is caught in a tug-of-war: economic data remains decent, but traders don’t buy it. Sentiment is skewed — hedge funds are heavily short USD, not because the economy is collapsing, but due to fiscal worries, policy confusion, and long-term structural cracks. This creates space for countertrend moves.
The euro isn’t roaring either — but it's no longer cutting rates, and confidence is picking up. A recent uptrend has cooled, and the pair is now consolidating. If we see signs of selling exhaustion, I’ll be watching for an entry.
I’m not buying blindly. I’m waiting for the fear to burn out. Would you fade this dip too — or are you staying out? 👇
EURUSD: Will Start Growing! Here is Why:
It is essential that we apply multitimeframe technical analysis and there is no better example of why that is the case than the current EURUSD chart which, if analyzed properly, clearly points in the upward direction.
Disclosure: I am part of Trade Nation's Influencer program and receive a monthly fee for using their TradingView charts in my analysis.
❤️ Please, support our work with like & comment! ❤️


LONG ON EUR/USDEUR/USD is currently at a major demand level after sweeping sell side liquidity.
The Dxy (Dollar) is overall bearish. I expect the dollar to fall and EUR/USD to rise to the previous high / supply level for over 200-300 pips.
News most likely will affect this pair in terms of volatility.

EUR/USD | Sweeps Liquidity and Rebounds – Eyes on 1.16700!By analyzing the EURUSD chart on the 4-hour timeframe, we can see that after our previous analysis, the price continued its decline and eventually swept the liquidity below 1.15580. Following that, strong demand kicked in, and the pair is currently trading around 1.15810. If the price can hold above this level, we can expect further bullish movement. The next potential targets are 1.1600, 1.16280, 1.16430, and 1.16700.
Please support me with your likes and comments to motivate me to share more analysis with you and share your opinion about the possible trend of this chart with me !
Best Regards , Arman Shaban

EURUSD Bearish Breakout !
HI,Traders !
#EURUSD was trading along
The rising support line but
Now we are seeing a bearish
Breakout so we are bearish
Biased and we will be expecting
A further bearish move down !
Comment and subscribe to help us grow !

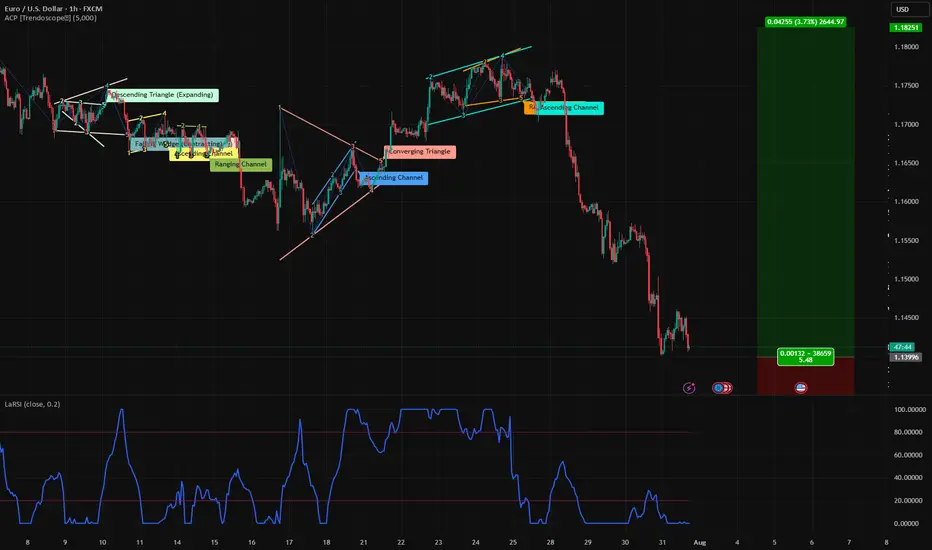
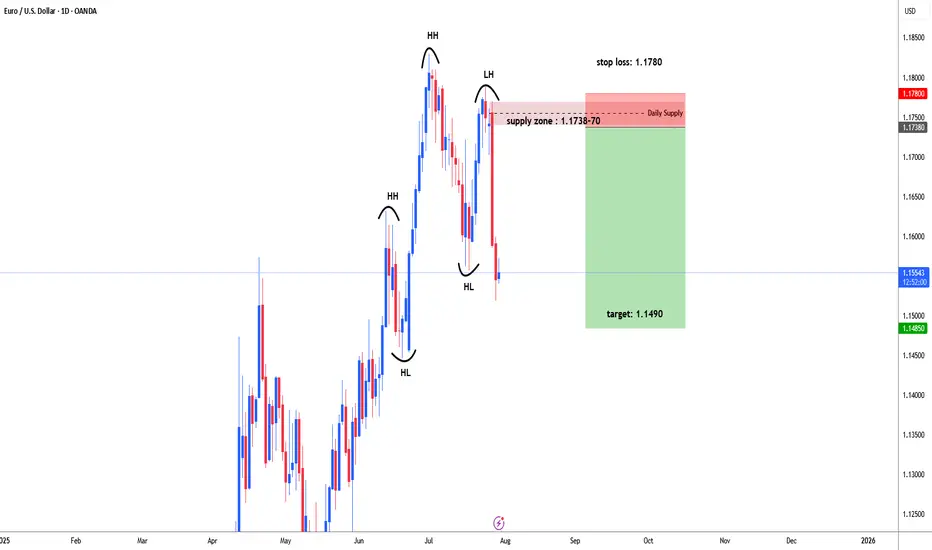
EURUSD possible bearish for 1.1490#EURUSD failed to form higher high and higher low to continue bullish trend. eurusd made a high on 1st July 1.1830, then price started retrace downside. 7th July daily bearish engulfing candle formed , early indication for selling. 23rd July price moved up side to test supply zone. Price did not break high of bearish engulfing candle and fall back. Price started heavily fall and broke recent supply level 1.1557 and form Lower High that is indication for trend reversal.
1.1738-70 ideal level for selling which is daily supply zone. stop loss above 1.1770 i.e. 1780-1.1800. target: 1.1490 and even may expect further down.
EURUSD after the FedEURUSD continues to trade within the reversal zone highlighted in our previous analyses.
Following yesterday’s Fed decision, we’re seeing additional downside movement, though price hasn’t yet reached the support level at 1,1346.
Our outlook remains unchanged – we’re watching for the end of the pullback and will look for buying opportunities afterwards.
The H1 candle formed during the news release can serve as a reference. A break and close above it would signal a potential reversal to the upside.
Conversely, if price breaks and closes below that candle, it would suggest the correction is likely to continue toward lower levels.

EURUSD has formed a double top patternOn the daily chart, EURUSD has formed a double top pattern. Currently, attention should be paid to the resistance around 1.1600. If the rebound does not break through, it is expected to continue to fall. The support below is around 1.1450. If it falls below, the support below is around 1.1370.

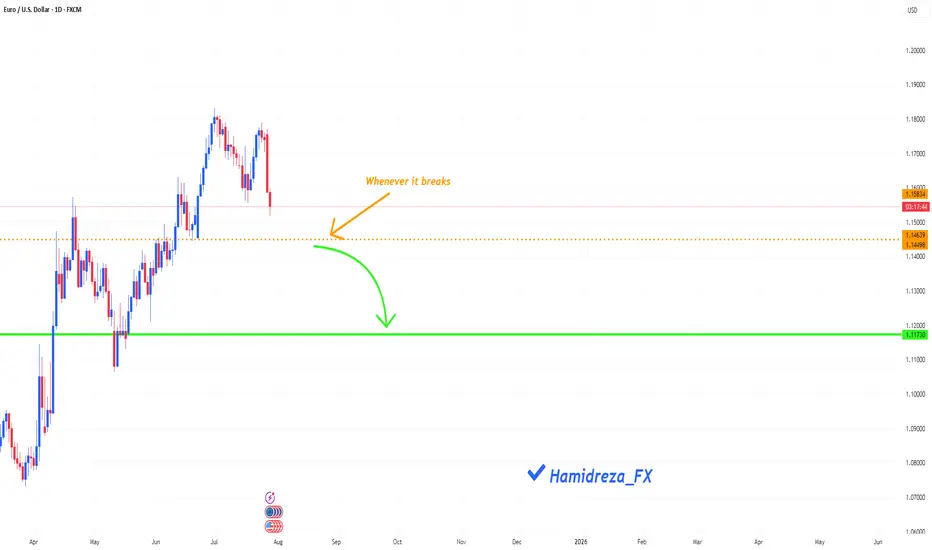
Is the EURUSD in a downtrend?
Hi my dears
It seems that the Eurusd has started a downward and corrective trend, however, the orange line condition must be met in order to enter a good trade with certainty.
I would be happy to hear your opinion.
EURUSD H4 | Bearish reversal off overlap resistanceThe Fiber (EUR/USD) is rising towards the sell entry, which is an overlap resistance and could drop lower.
Sell entry is at 1.1452, which is an overlap resistance.
Stop loss is at 1.1536, which is a pullback resistance that lines up with the 38.2% Fibonacci retracement.
Take profit is at 1.1323, which is a pullback support that is slightly below the 78.6% Fibonacci retracement.
High Risk Investment Warning
Trading Forex/CFDs on margin carries a high level of risk and may not be suitable for all investors. Leverage can work against you.
Stratos Markets Limited (tradu.com ):
CFDs are complex instruments and come with a high risk of losing money rapidly due to leverage. 65% of retail investor accounts lose money when trading CFDs with this provider. You should consider whether you understand how CFDs work and whether you can afford to take the high risk of losing your money.
Stratos Europe Ltd (tradu.com ):
CFDs are complex instruments and come with a high risk of losing money rapidly due to leverage. 66% of retail investor accounts lose money when trading CFDs with this provider. You should consider whether you understand how CFDs work and whether you can afford to take the high risk of losing your money.
Stratos Global LLC (tradu.com ):
Losses can exceed deposits.
Please be advised that the information presented on TradingView is provided to Tradu (‘Company’, ‘we’) by a third-party provider (‘TFA Global Pte Ltd’). Please be reminded that you are solely responsible for the trading decisions on your account. There is a very high degree of risk involved in trading. Any information and/or content is intended entirely for research, educational and informational purposes only and does not constitute investment or consultation advice or investment strategy. The information is not tailored to the investment needs of any specific person and therefore does not involve a consideration of any of the investment objectives, financial situation or needs of any viewer that may receive it. Kindly also note that past performance is not a reliable indicator of future results. Actual results may differ materially from those anticipated in forward-looking or past performance statements. We assume no liability as to the accuracy or completeness of any of the information and/or content provided herein and the Company cannot be held responsible for any omission, mistake nor for any loss or damage including without limitation to any loss of profit which may arise from reliance on any information supplied by TFA Global Pte Ltd.
The speaker(s) is neither an employee, agent nor representative of Tradu and is therefore acting independently. The opinions given are their own, constitute general market commentary, and do not constitute the opinion or advice of Tradu or any form of personal or investment advice. Tradu neither endorses nor guarantees offerings of third-party speakers, nor is Tradu responsible for the content, veracity or opinions of third-party speakers, presenters or participants.

EUR/USD Latest Update TodayHello everyone, what do you think about FX:EURUSD ?
EUR/USD previously broke the downward price channel, but failed to maintain the momentum, leading to a strong correction phase. Currently, the price is trading around 1.156 and testing key Fibonacci levels, with the 0.5 - 0.618 levels marked as potential reversal zones, as highlighted in the analysis.
With the current market sentiment, the strong recovery of the USD has been the main factor driving the EUR/USD movement in recent days. Positive economic data from the US has strengthened the US dollar, decreasing the appeal of gold and safe-haven assets like the EUR. Furthermore, expectations surrounding Fed policy decisions continue to add pressure on EUR/USD, with investors bracing for the possibility of the Fed maintaining high interest rates for a longer period.
For traders, it's clear that the bearish trend is in favor, as indicated by the EMA reversal. The Fibonacci levels 0.5 (1.164) and 0.618 (1.161) will be crucial zones, where reaction signals could open opportunities for SELL positions. The next target will be at Fib 1 and Fib 1.618.
That's my perspective and share, but what do you think about the current trend of EUR/USD? Leave your comments below this post!

Short idea!Hey all. as you see market returned from middle of no-where and the response will be right at the LOZ. it is sort of risky because the LOZ candle covered by the next candle. It makes the Zone less efficient but it is still powerful. be happy (wink)

EURUSD ahead of the FEDEURUSD remains below the 1,1600 level following the trade agreement between the US and the European Union.
Today, all eyes are on the FED’s decision regarding interest rates.
Watch for a reaction around the support zone, as it may present an opportunity for the trend to continue.
However, it's advisable to reduce risk and hold off on new entries until after the news is released.

Eurusd
---
### 💥 The Hidden Secret of Pro Traders:
Most traders jump straight into low timeframes like M15 or H1, chasing signals...
But the market's real moves? They start on the **higher timeframes** like weekly or Daily. 🤯
👉 **Golden Formula:**
- 🧭 **Higher Timeframe = Direction**
(Is the market trending up, down, or just ranging?)
- ⏱️ **Lower Timeframe = Precise Entry**
(When to get in? Where to place stops?)
Trading without the higher timeframe is like driving without a map. Sure, you're moving—but do you know *where you're going*?
---
### 📌 Quick Breakdown:
- Start on **2D or Daily** charts to define:
- Strong support/resistance zones
- Overall market structure
- Clear chart patterns
Then drop into **lower timeframes** (like H1 or M15):
This is where sniper entries and clean risk/reward setups live.
Pro Tip:
> "Your trading plan starts at the top... and finds its perfect shot at the bottom."
Be the sniper, not the spray-and-pray trader.
---

EURUSD | Faces Continued Downside, Reversal Above 1.1745EURUSD | Faces Continued Downside Risk; Reversal Only Confirmed Above 1.1747
The price initiated a bearish trend from the resistance level at 1.1747 and continues to decline. As long as it remains below the pivot level at 1.1685, further downside pressure is expected, with potential targets at 1.1632 and 1.1559. A confirmed break below this zone would reinforce the more bearish momentum.
However, if the price reverses and moves back above the pivot line, it may first reach 1.1747 before resuming the downward trend again.
The bullish trend confirmation will start above 1.1747.
Key Levels:
• Pivot line: 1.1685
• Resistance: 1.1747, 1.1894.
• Support: 1.1632, 1.15993, 1.1559.
