Eurusd short from the fibo clusterEurusd now in a strong resis fibo cluster 70+423 short it, the stop loss should be the close of 4h candle above the cluster
EURUSD trade ideas

EURUSD Potential seems continuationEURUSD has resumed a local uptrend from the support zone amid dollar weakness as price hit the support 1.1600 a false breakdown here suggests strong buyer defence Sustained price action above 1.1600 keeps the pair in the buy zone, favouring upside continuation.
Resistance Targets: 1.1750 = 1.1800
I anticipate the market will rise continue towards as mentioned in target.
You any find more details in the chart.
Ps: Support with like and comments for better analysis.

Lingrid | EURUSD Possible Continuation Following CorrectionFX:EURUSD is consolidating within a triangle pattern after setting a higher high inside the upward channel. Price is holding above 1.15900, keeping bullish structure intact and eyeing the 1.17500 resistance zone. A break above the triangle’s upper boundary could trigger continuation toward this target. Failure to hold 1.15900 risks a drop back toward channel support near 1.14000.
📉 Key Levels
Buy trigger: Break above 1.1650
Buy zone: 1.15900–1.16100
Target: 1.17500
Invalidation: Close below 1.15400
💡 Risks
False breakout (FAKEY) could reverse gains quickly
USD strength from macro data could cap upside
Channel support breach may shift bias to bearish
If this idea resonates with you or you have your own opinion, traders, hit the comments. I’m excited to read your thoughts!

BEARISH ON EURUSDStrong bullish push on the Monthly TF and Bearish on DXY, expeting pullback. Daily TF traded into an FVG with indicision candle followed with bearish candle. BOS on 1H TF and pushing down.

The Platinum BulletOver the years, I have posted a lot of educational content here on TradingView. Everything from Elliot waves to Wyckoff, psychology to Gann.
I have been lucky as a trader, 25 years doing this you pick up a thing or two. But above everything else, what you realise is that trading is a mindset game and not a technical one.
Many new traders try their luck. They are either experts in another field or simply successful in something else, or they come to the trading arena seeking wealth.
Both tend to get humbled quickly.
It is common for many new traders to put so much emphasis on the strategy, they overlook the psychology. You see, a strategy might work for someone, but you can't get it to work for you. This could simply be the time on the charts you lack, the timeframe or the instrument you are trading. The account balance or the fact you are not used to seeing 3-4 losses in a row.
When it comes to trading, less really is more!
Here's a simple one for you.
Take the mechanical range post I posted.
Now look at this;
On the larger timeframes we can see clearly the ranges and the supply/demand.
Then dropping down to the daily.
This is where, the technical aspect becomes less important and the psychology behind the move shows it's hand.
I have added volume and the AD line just to show how obvious this can be.
What do you see? Well as the price goes up, the volume goes down, we know we took liquidity to the upside.
So, if nothing else you would anticipate a pullback phase.
Then you get the clarity. Price drops and then pushes back, yet fails to make a new high. Almost like the volume told you it was about to happen.
Where did it pull back to?
Adding a simple volume profile too, from the swing high to the swing low. You can see the majority of the sell off (PoC) happened at a specific price point. Price pulled back to exactly that region before dropping.
The drop caused a local change in character and immediately took out the swing low - the last swing low of the leg up. (the real change in the trend).
There is obviously more to cover than this, but that is for another post.
Once you learn the way markets capitalise on the fear, the greed, the herd mindset, sentiment of the retail crowd. You can use the sentiment analysis in your favour.
You don't need 6 screens, fancy indicators, there is no silver bullet or 100% win rate strategies. And no a bot won't make you a Billionaire overnight.
If it was that easy, we would have no doctors, lawyers or firefighters; they would all be professional Bot traders.
Simplify your approach, put emphasis on the proper mindset, psychology and risk management and you will do alright!
Stay safe in the markets!
Some other recent posts;
Disclaimer
This idea does not constitute as financial advice. It is for educational purposes only, our principal trader has over 25 years' experience in stocks, ETF's, and Forex. Hence each trade setup might have different hold times, entry or exit conditions, and will vary from the post/idea shared here. You can use the information from this post to make your own trading plan for the instrument discussed. Trading carries a risk; a high percentage of retail traders lose money. Please keep this in mind when entering any trade. Stay safe.

EURUSD waiting for recovery to buy✏️EURUSD is still trading in an uptrend and is facing last week's top resistance at 1.170. The lower boundary of the price channel at 1.160 forms a 10-price boundary of the pair. Wait for support retests and buyers' reactions to trigger buying strategies towards the resistance at 1.181 next week
📉 Key Levels
Support: 1.159-1.145
Resistance: 1.169-1.181
BUY Trigger: Rejection of the support zone at 1.159
BUY zone 1.145 (Strong support zone)
Leave your comments on the idea. I am happy to read your views.

2 Ways to Trade Breakouts - Horizontal vs. Slanted StructureFX:EURUSD has put in a bullish pennant pattern. Normally with this pattern we would expect a breakout to the upside, but because we are sandwiched between two levels of previous structure, we just don't know.
Because that is the case, the best plan of action in my opinion is to wait for confirmation of the breakout & then look to get involved after the fact.
In this video we talk about 2 types of confirmation. 1) Horizontal levels of structure and 2) slanted levels of structure.
Which you use isn't as important as the consistency in which you use them.
Please leave any questions or comments below!
Akil

EURUSD Technical and Fundamental AnalysisEURUSD may begin another downtrend movement from the current zone, as suggested in our earlier chart analysis. The price is expected to retest the support line after a short-term bounce, likely influenced by speculation around the NFP report.
Fundamental Outlook:
Adding to the market’s uncertainty, former President Donald Trump has dismissed Erika McEntarffer, Commissioner of the Bureau of Labour Statistics, accusing her of manipulating job data. This political drama has raised fresh concerns among investors about transparency and credibility in U.S. economic reports.
Moreover, investors are increasingly worried about the broader impact of Trump’s return to influence, which could potentially slow U.S. economic growth.
Technical Analysis:
From a technical perspective, EURUSD has broken below the neckline of a double top pattern, which is a strong bearish confirmation. This breakdown signals a continuation of the downtrend, with downside momentum likely to build if the pair remains below key resistance levels.
You May find more details in the chart.
Ps: Support with like and comments for better analysis Thanks for Supporting.

Lingrid | EURUSD Confluence Zone: Shorting Opportunity. The price perfectly fulfilled my previous idea . FX:EURUSD is pulling back toward a confluence of resistance formed by the broken upward trendline and the descending channel boundary. Price structure suggests a lower high beneath the $1.16081 zone after a sharp sell-off from the July peak. As long as price remains below this resistance and fails to reclaim the $1.16000 level, further downside toward $1.14510 and lower remains likely. Momentum is favoring continued bearish pressure following the recent breakdown.
📉 Key Levels
Sell trigger: Rejection from $1.16000
Sell zone: $1.15800 – $1.16081
Target: $1.14510
Invalidation: Break above $1.16081
💡 Risks
A confirmed breakout above $1.16081 may invalidate the bearish setup
Momentum could stall near $1.15000 and lead to consolidation
Support at $1.14510 may attract short-term dip buyers
If this idea resonates with you or you have your own opinion, traders, hit the comments. I’m excited to read your thoughts!

My Bias On EURUSD Dollar gains momentum and the pair is expected to fall as it has broken a higher time frame trendline, weekly and daily trendline. A long term is expected to continue the montly momentum(selling)

EURUSD – Watching Trendline + Resistance Zone for Short🧩 Setup Overview :
Price recently broke below a well-respected ascending trendline
It’s now approaching that same trendline from underneath
The area also aligns with a prior resistance zone and potential lower high
If price retests this zone and shows clear rejection, I’ll consider a short entry
🎯 Trade Plan (If Triggered) :
Short on confirmed rejection (not entering blindly)
Stop Loss: Above the recent high / invalidation point
Target: Next support level — clean structure, favorable R:R
💬 How are you approaching EURUSD here?
Always open to hearing different views. Drop your thoughts below 👇

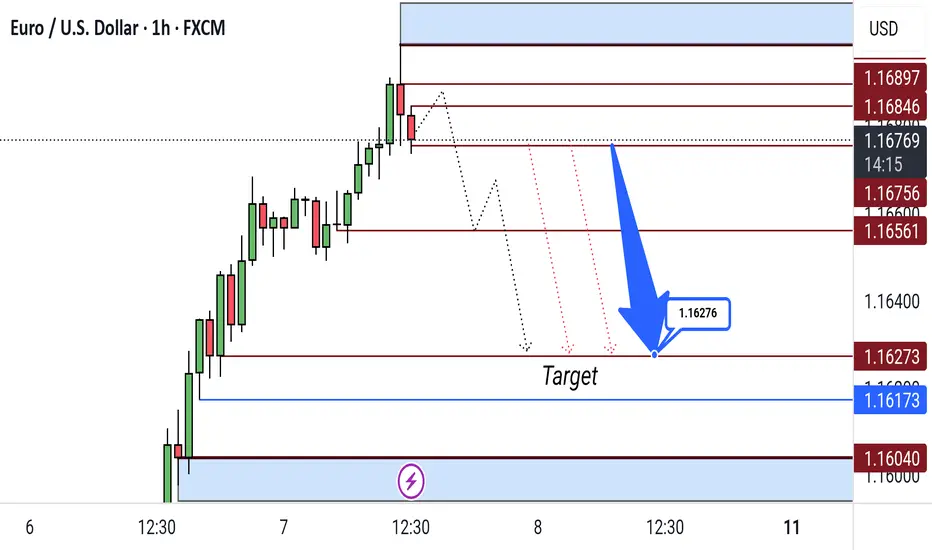
EUR/USD 1H Bearish Reversal SetupEUR/USD 1H Analysis:
Price is currently testing resistance near 1.16767. Bearish projection indicates potential reversal with target near 1.16173–1.16040 zone. Key level to watch: 1.16276.
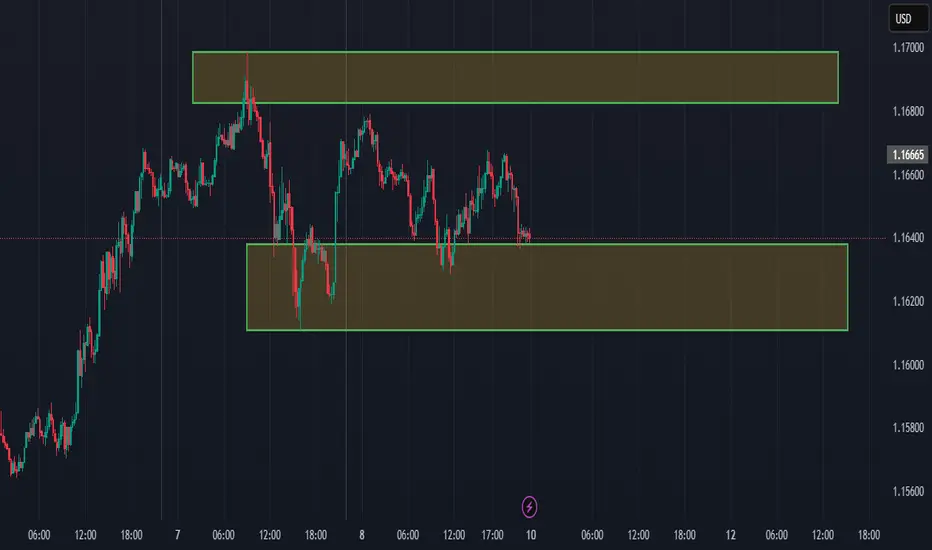
SIMPLE MARKET STRUCTURENot taking too many data from the past.
Technical analysis using candlesticks
Daily timeframe = Last five (5) candles... Market is bullish
H4 = sub structure of D1 last Friday candle is bearish. Marked current LH and Last LL.
Market currently finding it hard to form a new LL
WILL THERE BE ACONTINUATION TO THE DOWNSIDE OR WILL MARKET START FORMING HL AND GET A NEW HH.
EURUSD Massive Long! BUY!
My dear followers,
This is my opinion on the EURUSD next move:
The asset is approaching an important pivot point 1.1639
Bias - Bullish
Safe Stop Loss - 1.1629
Technical Indicators: Supper Trend generates a clear long signal while Pivot Point HL is currently determining the overall Bullish trend of the market.
Goal - 1.1655
About Used Indicators:
For more efficient signals, super-trend is used in combination with other indicators like Pivot Points.
Disclosure: I am part of Trade Nation's Influencer program and receive a monthly fee for using their TradingView charts in my analysis.
———————————
WISH YOU ALL LUCK

Sell eurusdStrong sell expected already daily support trend broken
We are expecting weakening of the euro among all cross pair
Bearish wave not completed yet

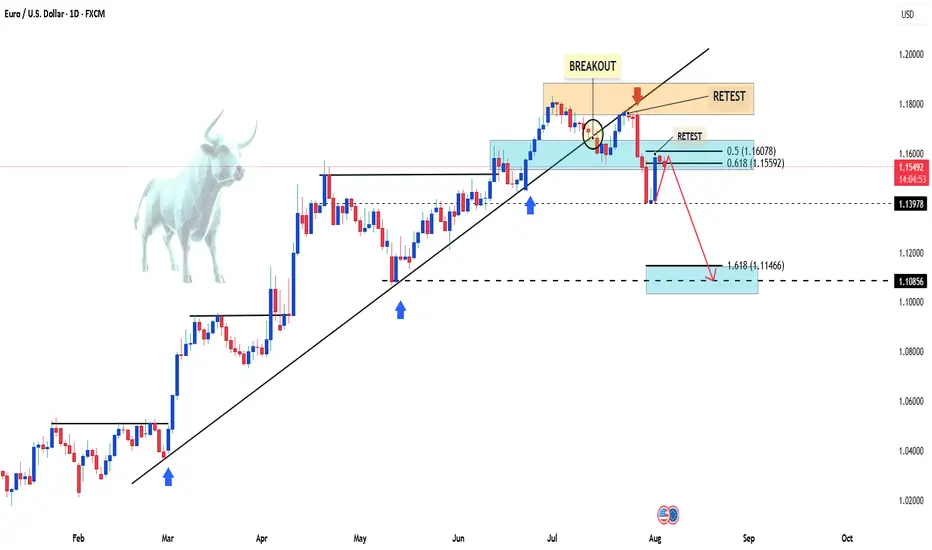
EURUSD – Retest in Play After NFP Reversal?EURUSD started last week with a heavy bearish tone, dropping 200 pips on Monday alone — which is quite a move for such a typically stable pair.
After a brief consolidation around the neckline support of the recent double top, sellers came back in, pushing the pair down to 1.1400 by Friday — a level I highlighted in my previous analysis.
But then came NFP...
The weak jobs data triggered a sharp bullish reversal, and the euro took off like a rocket.
By the weekly close, the pair had rallied all the way back to the neckline zone, now acting as potential resistance.
________________________________________
🔍 Technical Outlook:
This area around 1.1550–1.1590 could now serve as a retest of the broken structure.
• 🔽 A rejection here, followed by a break back below 1.1500, would confirm the bearish scenario and open the door for a move toward 1.1200, the next major support.
• 📌 On the flip side, a sustained move above the neckline would invalidate the double top — and put bulls back in control.
________________________________________
Conclusion:
Watching for sell signals around the neckline makes technical sense — but confirmation is key.
The reaction early this week will likely set the tone for the next major swing.
Disclosure: I am part of TradeNation's Influencer program and receive a monthly fee for using their TradingView charts in my analyses and educational articles.

EURUSDHello Traders! 👋
What are your thoughts on EURUSD?
After last week's sharp decline, EUR/USD rebounded slightly on Friday, initiating a corrective move to the upside.
We anticipate this retracement to extend over the next few days, likely reaching the broken trendline and former support zone, which now acts as resistance.
As long as the pair remains below this resistance area, the bearish outlook remains valid.
Once the pullback is complete, we expect renewed downside pressure toward the next support levels.
💬 Is this just a corrective move before another leg down? Let us know your thoughts below! 👇
Don’t forget to like and share your thoughts in the comments! ❤️
EURUSD: Pullback From Resistance 🇪🇺🇺🇸
EURUSD strongly reacted to the underlined intraday
resistance area after the market opening.
I see a tine double top pattern on that and a formation
of a bearish engulfing candle.
I expect a retracement to 1.154 level.
❤️Please, support my work with like, thank you!❤️

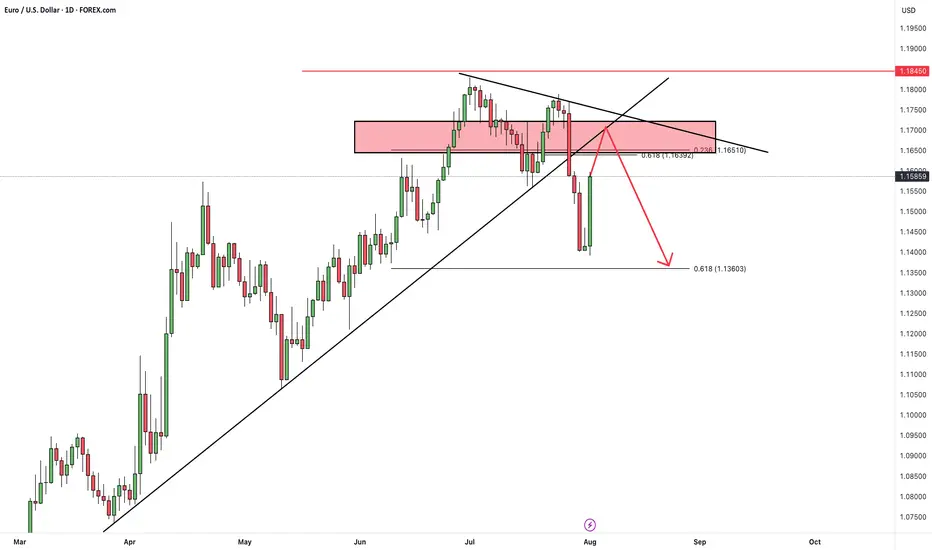
Technical Analysis: EUR/USD Swing Sell Setup📉 OANDA:EURUSD Technical Analysis: EUR/USD Sell Setup
The EUR/USD pair presents a compelling sell setup as we observe a rising wedge pattern, which typically indicates a potential trend reversal. Here’s the breakdown:
### Chart Observations:
- Current Price: 1.16416
- Resistance Levels: Notable resistance is observed at the 1.172/1.178 area. This range has shown strong rejection previously, suggesting it could be a key zone to watch for potential reversals.
- Trend Analysis: The rising wedge pattern signifies a weakening bullish momentum, with increasing bearish activity evident in the market.
- Volume Analysis: The volume indicators highlight increased selling pressure, supporting the bearish outlook.
### Trade Setup:
- Positioning: A swing sell position is recommended around the current price with targets set for potential downside movement.
### Take Profit Levels:
- TP 1: 1.156
- TP 2: 1.143
- TP 3: 1.126
### Risk Management:
- Stop Loss: A crucial component of this setup is to manage risk effectively. A stop loss should be placed above the invalidation level at 1.18298, protecting against unexpected bullish movements.
### Conclusion:
With the rising wedge pattern, clear resistance levels, and strong bear activity, this setup presents an excellent opportunity for traders looking to capitalize on potential downward movement in the EUR/USD pair. Manage your risk and trade wisely! Good luck, traders! 📊💼

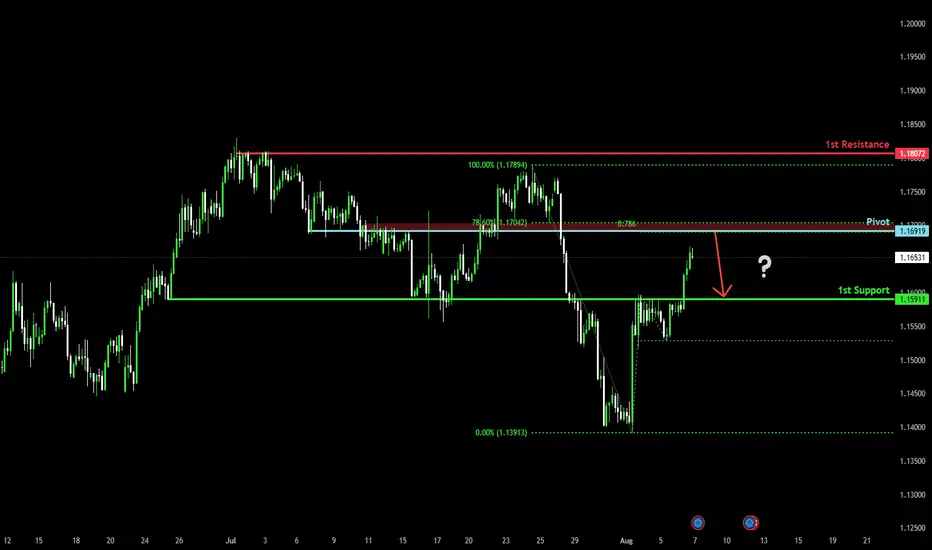
Bearish reversal for the Fiber?The price is rising towards the pivot and could reverse to the 1st support which is an overlap support.
Pivot: 1.1691
1st Support: 1.1591
1st Resistance: 1.1807
Risk Warning:
Trading Forex and CFDs carries a high level of risk to your capital and you should only trade with money you can afford to lose. Trading Forex and CFDs may not be suitable for all investors, so please ensure that you fully understand the risks involved and seek independent advice if necessary.
Disclaimer:
The above opinions given constitute general market commentary, and do not constitute the opinion or advice of IC Markets or any form of personal or investment advice.
Any opinions, news, research, analyses, prices, other information, or links to third-party sites contained on this website are provided on an "as-is" basis, are intended only to be informative, is not an advice nor a recommendation, nor research, or a record of our trading prices, or an offer of, or solicitation for a transaction in any financial instrument and thus should not be treated as such. The information provided does not involve any specific investment objectives, financial situation and needs of any specific person who may receive it. Please be aware, that past performance is not a reliable indicator of future performance and/or results. Past Performance or Forward-looking scenarios based upon the reasonable beliefs of the third-party provider are not a guarantee of future performance. Actual results may differ materially from those anticipated in forward-looking or past performance statements. IC Markets makes no representation or warranty and assumes no liability as to the accuracy or completeness of the information provided, nor any loss arising from any investment based on a recommendation, forecast or any information supplied by any third-party.
DeGRAM | EURUSD returned to the channel📊 Technical Analysis
● EURUSD broke above the descending channel resistance and reclaimed the 1.1567 level, signaling a potential reversal after defending 1.1446 support.
● The price is forming a bullish sequence of higher lows, and a breakout above 1.1592 could open the path toward the 1.1765 resistance zone.
💡 Fundamental Analysis
● A weaker-than-expected US ISM Services report triggered USD selling, while hawkish ECB remarks from Nagel supported euro recovery.
● Markets are pricing in fewer Fed hikes as job data cools, reducing dollar appeal and favoring EUR upside.
✨ Summary
Long bias above 1.1446. Breakout targets 1.1592 ➜ 1.1765. Setup valid while structure holds above prior resistance-turned-support.
-------------------
Share your opinion in the comments and support the idea with a like. Thanks for your support!

EURUSD Faces Renewed Selling PressureHello, what are your thoughts on EURUSD?
After failing to break above the 1.1600 level, the EUR/USD pair is now facing strong selling pressure again, currently testing the mid-1.1500s on Monday. Meanwhile, the US Dollar has seen a modest rebound across the board as investors digest Friday’s sharp drop following weaker-than-expected US jobs data.
From a technical standpoint, this setup may lead EURUSD to even lower levels. The recent movement aligns well with our previous outlook and follows the Dow Theory principles.
I'm expecting the price to continue its correction—what about you?
EUR/USD: Can the Uptrend Continue?Hello everyone, it's great to be back with you today!
In our previous discussion, we talked about the short-term uptrend in FX:EURUSD , and it seems that things are still going smoothly.
Recently, the weakening of the USD, with expectations that the Fed will cut interest rates three times this year, has undermined the USD and supported EUR. The DXY chart clearly reflects the weakness of the USD.
In the short term, EUR/USD may continue to fluctuate within a narrow range, with support at 1.163 and resistance at 1.1750. If U.S. inflation data remains weak and the Fed continues to cut rates, the EUR could appreciate.
However, in the long term, attention should be given to the 1.1750 resistance level, as it is a strong barrier and also the upper limit of the price channel.
What do you think, will EURUSD be able to maintain its uptrend?
