Eurusd
---
### 💥 The Hidden Secret of Pro Traders:
Most traders jump straight into low timeframes like M15 or H1, chasing signals...
But the market's real moves? They start on the **higher timeframes** like weekly or Daily. 🤯
👉 **Golden Formula:**
- 🧭 **Higher Timeframe = Direction**
(Is the market trending up, down, or just ranging?)
- ⏱️ **Lower Timeframe = Precise Entry**
(When to get in? Where to place stops?)
Trading without the higher timeframe is like driving without a map. Sure, you're moving—but do you know *where you're going*?
---
### 📌 Quick Breakdown:
- Start on **2D or Daily** charts to define:
- Strong support/resistance zones
- Overall market structure
- Clear chart patterns
Then drop into **lower timeframes** (like H1 or M15):
This is where sniper entries and clean risk/reward setups live.
Pro Tip:
> "Your trading plan starts at the top... and finds its perfect shot at the bottom."
Be the sniper, not the spray-and-pray trader.
---
EURUSD trade ideas

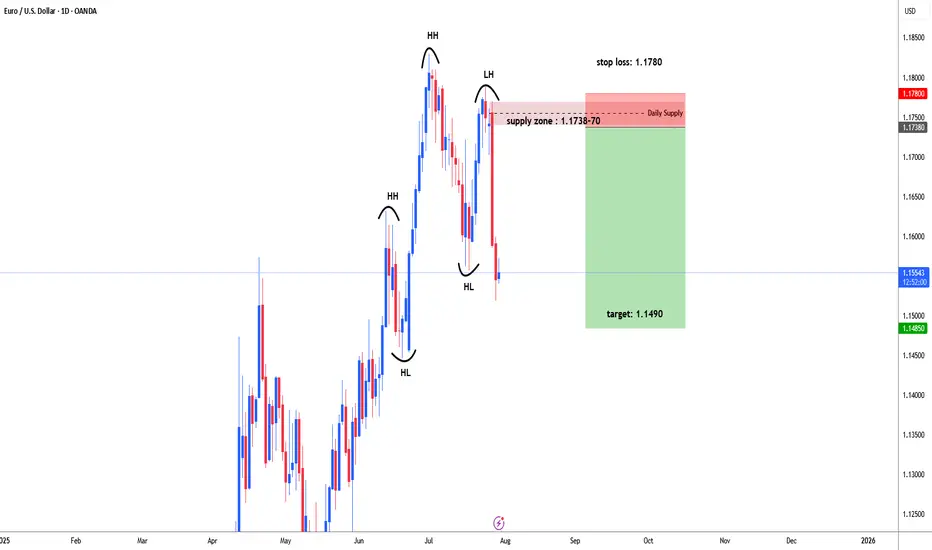
EURUSD possible bearish for 1.1490#EURUSD failed to form higher high and higher low to continue bullish trend. eurusd made a high on 1st July 1.1830, then price started retrace downside. 7th July daily bearish engulfing candle formed , early indication for selling. 23rd July price moved up side to test supply zone. Price did not break high of bearish engulfing candle and fall back. Price started heavily fall and broke recent supply level 1.1557 and form Lower High that is indication for trend reversal.
1.1738-70 ideal level for selling which is daily supply zone. stop loss above 1.1770 i.e. 1780-1.1800. target: 1.1490 and even may expect further down.
EURUSD | Faces Continued Downside, Reversal Above 1.1745EURUSD | Faces Continued Downside Risk; Reversal Only Confirmed Above 1.1747
The price initiated a bearish trend from the resistance level at 1.1747 and continues to decline. As long as it remains below the pivot level at 1.1685, further downside pressure is expected, with potential targets at 1.1632 and 1.1559. A confirmed break below this zone would reinforce the more bearish momentum.
However, if the price reverses and moves back above the pivot line, it may first reach 1.1747 before resuming the downward trend again.
The bullish trend confirmation will start above 1.1747.
Key Levels:
• Pivot line: 1.1685
• Resistance: 1.1747, 1.1894.
• Support: 1.1632, 1.15993, 1.1559.

EURUSD has formed a double top patternOn the daily chart, EURUSD has formed a double top pattern. Currently, attention should be paid to the resistance around 1.1600. If the rebound does not break through, it is expected to continue to fall. The support below is around 1.1450. If it falls below, the support below is around 1.1370.

EURUSD – Post-FOMC Macro Compression in Play📉 EURUSD – Post-FOMC Macro Compression in Play
WaverVanir | VolanX Protocol | July 30, 2025
The recent Fed hold has added pressure to the euro as rate differentials remain in favor of the USD. On the chart, EURUSD failed to sustain above the 0.786 retracement level (~1.1476), with clear signs of exhaustion.
🧠 Thesis:
We may see a macro compression pullback with EURUSD potentially revisiting the baseline support zone at 1.08147, which previously acted as a long-term resistance-turned-support.
🔍 Technical Confluence:
Rejection near 0.786 Fib (1.1476)
No bullish breakout above 2023–2024 ceiling
Downside targets:
1.1070 → short-term support
🟡 1.0815 → baseline zone and decision point
🧠 Macro Overlay:
Fed is in pause-and-watch mode
ECB growth outlook is slowing
US inflation is stickier = USD strength persisting short term
📌 VolanX DSS Summary: Bearish structure developing. We favor tactical shorts on rallies toward 1.1470–1.15 with eyes on the 1.08 handle.
#EURUSD #FOMC #VolanX #WaverVanir #MacroTrading #ForexSignals #USD #ECB #RateDifferential #Fibonacci #SMC #Liquidity #ForexMacro

EURUSD Long Setup – Liquidity Sweep + Distribution Opportunity**📍 EURUSD Long Setup – Liquidity Sweep + Distribution Opportunity**
Currently monitoring EURUSD as price consolidates near a potential short-term demand zone. The recent price action suggests that we may observe a **liquidity grab below previous session lows**, possibly during the **London session**, before a directional move.
My focus remains on **how New York session will react** — potentially stepping in as a **distribution phase**, which could initiate the bullish leg toward the upper imbalance zones.
Key confluences:
* Anticipated liquidity below previous session lows (Asia & London).
* Bullish FVG aligned with higher timeframe structure.
* Targets at **1.17219** and extension toward **1.17744**, matching daily imbalance and previous supply area.
Patience is key here. Waiting for **clear confirmation post-sweep**, ideally via a CHoCH or bullish engulfing on the lower timeframe, before executing.
`DO NOT USE THIS AS SIGNAL OR ANY OF A KIND´
Emerson Massawe
COO | FINANCIAL MARKET ANALYST|

Potential Sell Continuation EURUSDLooking to sell the retest.
Price broke out of trend line with momentum loss of lower high.
What do you think?

EUR/USD Elliott Wave: Corrective Pullback in Progress Wave ((4))EUR/USD 4H chart with Elliott Wave count. The pair remains in a steady downtrend after peaking at the wave (C) high, and is now in the middle of a larger wave iii decline. Bearish impulse waves dominate, with lower lows confirming the trend (mid-wave iii scenario). Now expecting a wave ((4)) relief bounce (corrective) within this wave iii. Price could rebound toward 1.15788–1.16153, the ~38.2–50% Fibonacci retracement zone of the prior drop.
This area is a likely resistance for the bounce, suggesting only a temporary uptick in an otherwise bearish move. After wave ((4)) completes, the downtrend should resume as wave ((5)) of iii kicks in. The next downside target is around 1.13974 (or lower) – near a 1.618 Fibonacci extension projection where wave ((5)) may complete. This would likely finish wave iii and aligns with the broader bearish Elliott Wave count.

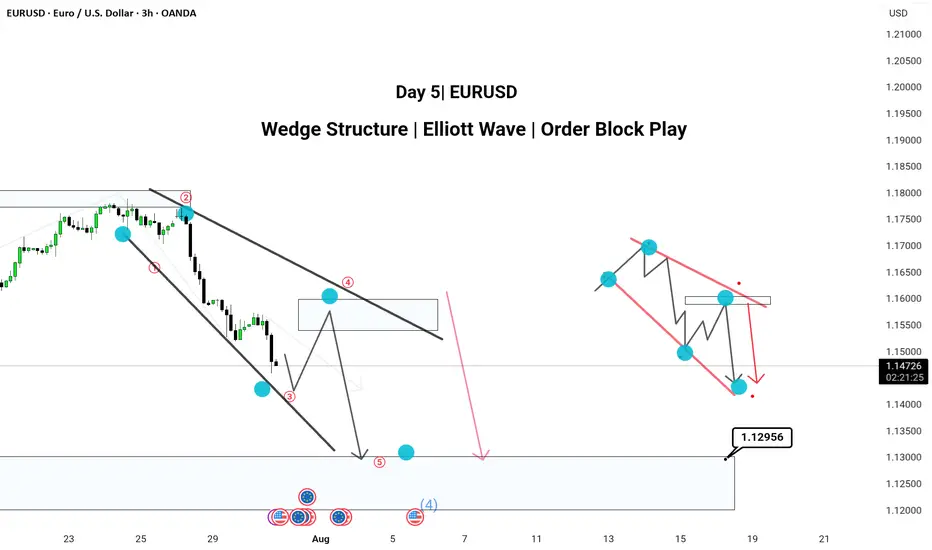
Pattern: Wedge Structure | Elliott Wave | Order Block PlayHere’s a powerful and professional description you can use when publishing this chart on TradingView:
---
🔻 Day 4 | EUR/USD Analysis 🔻
Chart Type: 3H Timeframe
---
📌 Chart Breakdown:
EUR/USD is respecting a textbook XABCD wedge pattern with clean Elliott Wave structure forming inside.
We’ve marked 5 key waves (1–5) completing within a falling wedge, aligning with a 50–60% retracement (Golden Zone) between point A and D.
🧠 Most traders miss the Golden Zone, but it’s often the clearest sign of upcoming trend continuation. Here, that continuation is bearish.
---
✅ 3H Confluence Factors:
Wedge forming within a larger downtrend
Multiple Break of Structures (BOS) confirming bearish momentum
Price targeting 1.12956 zone (mapped order block)
Elliott Wave fractals confirmed within structure
Hidden supply zone respected at Wave 4
---
📉 Expecting:
Retracement to supply → drop toward demand zone near 1.12956
---
📎 Strategy Insight:
SMC + Elliott Wave + Multi-timeframe path tool mapping gives us high confluence to expect continuation into the demand area.
💬 Comment below your views —
Do you also trade Wedges with Elliott Wave confirmation?
#EURUSD #WedgePattern #ElliottWave #SmartMoneyConcepts #OrderBlock #TechnicalAnalysis #TradingView #ForexIndia
---
EURUSD Tests Key Support Ahead of FOMCFollowing the strong U.S. GDP data, EURUSD dropped to the 1.1450 support level. This area is significant, as it marks the convergence of the 23.6% retracement from the January–July move and the 50% retracement from the May–July move.
While the FOMC decision will ultimately shape the direction, from a technical perspective, a long position may offer a favorable risk/reward setup at current levels. A stop just below the key support would help manage downside risk.
EUR-USD Free Signal! Buy!
Hello,Traders!
EUR-USD keeps falling and
The pair is locally oversold so
As the pair is retesting the
Horizontal support level
Of 1.1468 we can enter a
Long trade with Take Profit
Of 1.1510 and Stop Loss
Of 1.1443
Buy!
Comment and subscribe to help us grow!
Check out other forecasts below too!
Disclosure: I am part of Trade Nation's Influencer program and receive a monthly fee for using their TradingView charts in my analysis.

EURUSD ahead of the FEDEURUSD remains below the 1,1600 level following the trade agreement between the US and the European Union.
Today, all eyes are on the FED’s decision regarding interest rates.
Watch for a reaction around the support zone, as it may present an opportunity for the trend to continue.
However, it's advisable to reduce risk and hold off on new entries until after the news is released.

A TEST OF THE PREVIOUS BROKEN STRUCTURE From the daily time frame, we can see that EURUSD has broken a structure which was acting as previous resistance turned support, which is indicated with a blue rectangle.
I'm anticipating the broken support to turn to resistance when the price action retraces from somewhere at the demand zone which is indicated with a red rectangle.
So let's have in back of our mind that price will need to retrace from the low to retest the broken structure and turn into resistance and then after continue to the downside.
......................,.................,......................
Please share your thoughts,what do you think,will EURUSD move downwards or will it be buy the dip and continue with its uptrend.

EURUSD DOWN SIDE The dollar index (DXY00) on Tuesday rose by +0.22% and posted a 5-week high. The dollar has carryover support from Monday following the EU-US trade deal that is seen as favoring the US. Also, expectations for the Fed to keep interest rates unchanged at the end of Wednesday's 2-day FOMC meeting are supportive of the dollar. The dollar extended its gains after the US Jun advance goods trade deficit unexpectedly shrank, a supportive factor for Q2 GDP, and after July consumer confidence rose more than expected.


My Trading Journal on EU 30.07.2025EURUSD has reached a significant point with showing a high level of accuracy with a Fair Value Gap on the higher time frame. This presents an excellent entry opportunity. Additionally, today is midweek, and there are high-impact events to consider. Keep an eye on it as the events unfold.

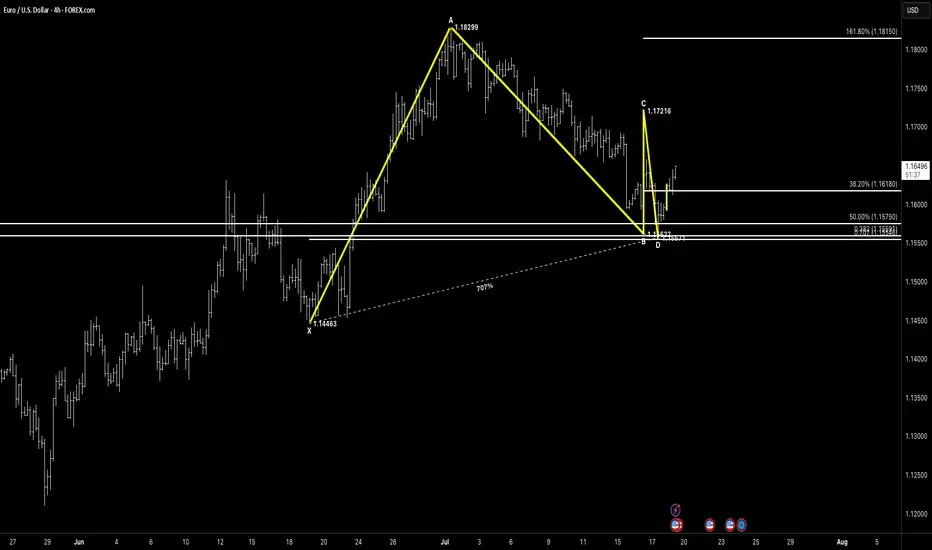
EURUSD / Euro – U.S. Dollar (4H) – ABC Bullish Structure EURUSD / Euro – U.S. Dollar (4H) – ABC Bullish Structure with Double Bottom Base
Pattern Overview:
Pattern Type: ABC Bullish + Corrective Double Bottom
Asset: EURUSD
Timeframe: 4H
Trade Type: Bullish Bias – Monitoring for continuation after rejection from cluster support
🔎 Key Levels
XA: 1.14663 → 1.18299
AB: 1.18299 → 1.16292
BC: 1.16292 → 1.17216
CD: Completion just under 1.15621 cluster
Major Fib Cluster: 0.707% XA, 0.886 AB, 50% CD, Prior Horizontal Support Zone
📐 Fibonacci Extensions & Key Ratios
38.2% retracement: 1.16180
50.0% retracement: 1.15750
161.8% extension: 1.18150
💡 Price Action & Setup
Price has completed an ABC corrective leg, forming a clean double bottom at the D point, hovering over the fib-rich support cluster.
The rejection candle shows buyer interest, and the recent higher low structure implies potential for continuation, especially if price reclaims and holds above 1.1650 short-term structure.
🧠 Market Sentiment
DXY easing slightly after strong dollar dominance
EUR macro calendar quiet – technicals may dominate next moves
Strong base = smart money accumulation likely underway
📊 Next Potential Movement
Break above 1.1675 opens path toward 1.1720, then possibly 1.1815
If 1.1575 cluster fails → risk of full XA retracement
🛡 Risk Management
Aggressive long entries already in play
Conservative entries should wait for higher low confirmation above 1.1650
Protective stop: under 1.1550 zone
📌 Conclusion
This is a bullish structure with a corrective double bottom base sitting right inside a dense confluence zone. Price is compressing between key fibs – expect a directional move next week. Keep your eye on the 1.1675 breakout or 1.1570 loss for next major decision.
“In the densest zones of indecision, patterns and confluence provide the clearest map.”
EURUSDEUR/USD Exchange Rate
Current Rate: About 1.1525
Government Bond Yields
U.S. 10-Year Treasury Yield: 4.328%
Eurozone 10-Year Government Bond Yield: Last reported at 2.686%
Economic Data Reports for Today
U.S. Data:
1:15pm
USD
ADP Non-Farm Employment Change
82K -33K
1:30pm
USD
Advance GDP q/q
2.4% -0.5%
USD
Advance GDP Price Index q/q
2.3% 3.8%
3:00pm
USD
Pending Home Sales m/m
0.3% 1.8%
3:30pm
CAD
BOC Press Conference
USD
Crude Oil Inventories
-3.2M
7:00pm
USD
Federal Funds Rate
4.50% 4.50%
USD
FOMC Statement
7:30pm
USD
FOMC Press Conference
Market Focus Today: The Federal Reserve announces its policy decision.
Eurozone Data:
GDP Growth (Q2): Eurostat reports second-quarter growth at 0.1% quarter-on-quarter (QoQ) and 1.4% year-on-year (YoY). Germany and Italy contracted by 0.1% QoQ, France rose 0.3%, and Spain outperformed at 0.7%.
Outlook: The Eurozone economy faces headwinds from new U.S. tariffs and tepid industrial output, though Q2 was somewhat better than feared.
Current Interest Rates
Area Main Rate (July 2025) Policy Outlook
U.S. 4.25% – 4.50% Fed expected to hold steady
EU 2.15% (main refi rate) ECB in data-dependent pause
2.00% (deposit rate)
U.S.: The Federal Reserve is widely expected to hold rates in the 4.25%–4.50% range at today's FOMC meeting, reflecting a cautious approach in light of current growth and inflation figures.
Eurozone: The ECB last held its main refinancing rate at 2.15% and the deposit facility at 2.00% as of the July 24, 2025 meeting, emphasizing a meeting-by-meeting, data-driven stance.
Key Takeaways
EUR/USD is subdued just above 1.15 as the euro weakens on modest Eurozone growth and broad dollar strength ahead of the Fed.
10-year yields remain elevated in both regions, reflecting stable but cautious outlooks.
Today’s U.S. and ECB meetings/data are critical: Markets are watching for central bank reactions to new economic data and the ongoing effects of tariffs and global uncertainty.
This overview captures the most significant developments relevant to currency, rates, bonds, and economic trends for July 30, 2025.
#EURUSD #DOLLAR #EURO

EURUSD Analysis – Supply Zones & Reversal Opportunities (MMC)Today’s EURUSD analysis focuses on identifying major supply zones, potential reversal points, and directional bias using the Mirror Market Concept (MMC) on the 8-hour timeframe.
1️⃣ Market Structure & Channel Supply Zone
The market recently formed a descending channel 📉, acting as a full supply zone where sellers dominated.
Every time price touched the upper boundary of this channel, we saw bearish reactions, proving this zone as a strong liquidity grab area.
Breakdown from the channel: After repeated attempts to break the channel to the upside, sellers regained control, pushing EURUSD lower and confirming bearish momentum.
2️⃣ Central Reversal Zone (Decision Point) ⚖️
Currently, price is consolidating around the Central Reversal Zone.
This zone is crucial because it can act as:
Reversal Point 🟢: If buyers step in aggressively, we might see a bullish leg toward previous swing levels, targeting resistance zones.
Continuation Zone 🔻: If sellers maintain pressure and break below this level, momentum will shift strongly bearish, aiming for deeper support.
Price behavior here will define short-term direction. Traders must wait for confirmation before committing to large positions.
3️⃣ Next Major Reversal Zone (High-Probability Demand) 🟩
Marked in green, this zone is expected to attract buyers if the current level fails.
Historically, these areas show high liquidity grabs and institutional activity.
If price reaches this zone, we expect significant bullish interest, making it a high-probability reversal area for medium-term buy setups.
4️⃣ Trade Scenarios
Scenario 1 (Bullish Reaction 🟢):
Price bounces from the Central Reversal Zone.
Possible targets: Previous structure highs inside the channel break zone.
Scenario 2 (Bearish Continuation 🔻):
Price fails to hold above and breaks lower.
Target: Next Major Reversal Zone for fresh liquidity accumulation.
5️⃣ Trading Approach & Risk Management 🛡️
Aggressive Approach: Intraday traders can scalp inside the Central Reversal Zone but must keep tight stop-losses to avoid fake-outs.
Conservative Approach: Wait for a clean break and retest confirmation, especially near the Next Reversal Zone for high-probability trades.
Maintain risk-to-reward (RR) ≥ 1:2 and avoid emotional trading during reversal attempts.
Summary:
EURUSD is at a critical juncture. The current market structure shows a bearish tone, but the Central Reversal Zone can still cause a temporary bullish reaction. A failure to hold will open the path toward the green reversal demand zone, where major buyers are likely to appear.

EURUSD: Target Is Down! Short!
My dear friends,
Today we will analyse EURUSD together☺️
The price is near a wide key level
and the pair is approaching a significant decision level of 1.15428 Therefore, a strong bearish reaction here could determine the next move down.We will watch for a confirmation candle, and then target the next key level of 115186..Recommend Stop-loss is beyond the current level.
❤️Sending you lots of Love and Hugs❤️

EUR/USD Hits Lowest Level Since Early JulyEUR/USD Hits Lowest Level Since Early July
As the EUR/USD chart indicates today, the euro has fallen below the 1.1550 mark against the US dollar, reaching the lows of June 2025. As a result, July may become the first month in 2025 to record a decline in the currency pair.
Why Is EUR/USD Declining?
There are two key factors driving the euro’s weakness relative to the US dollar:
→ Anticipation of the Federal Reserve Meeting. At 21:00 GMT+3 today, the Fed’s interest rate decision will be released. According to Forex Factory, analysts expect the Federal Funds Rate to remain unchanged at 4.25%-4.50%.
→ Market Reaction to the US-EU Trade Agreement. The trade deal signed last weekend between the United States and Europe is being critically assessed by market participants.
As noted in our Monday analysis, signs of a bearish takeover emerged on the chart following the agreement’s signing. Since then, EUR/USD has declined by approximately 1.3%. The question now is whether the downtrend will continue.
Technical Analysis of the EUR/USD Chart
The upward channel that had remained valid since mid-May was decisively broken by bears this week. The nature of the breakout (highlighted by the red arrow) was particularly aggressive, with the price dropping from the 1.1710 level to the D point low without any meaningful interim recoveries.
Key observations include:
→ The drop has resulted in a classic bearish A-B-C-D market structure, characterised by lower highs and lower lows.
→ On the 4-hour timeframe, the RSI indicator has fallen into oversold territory, reaching its lowest point of 2025 so far.
→ Notably (as highlighted by the blue arrow), there was a strong rebound from the 1.1455 support level earlier. Bulls demonstrated significant strength at that time, breaking through the R resistance line.
Given these factors, we could assume that after this week’s sharp decline, EUR/USD may attempt a short-term recovery from the support zone (highlighted in purple). Should this scenario unfold, potential resistance may emerge near the 1.1630 level, as this area aligns with:
→ The 50% Fibonacci retracement of the C→D decline;
→ The breakout point of the lower boundary of the previous ascending channel, indicating a shift in market balance in favour of the bears.
This article represents the opinion of the Companies operating under the FXOpen brand only. It is not to be construed as an offer, solicitation, or recommendation with respect to products and services provided by the Companies operating under the FXOpen brand, nor is it to be considered financial advice.

EURUSD Set To Grow! BUY!
My dear followers,
This is my opinion on the EURUSD next move:
The asset is approaching an important pivot point 1.1557
Bias - Bullish
Technical Indicators: Supper Trend generates a clear long signal while Pivot Point HL is currently determining the overall Bullish trend of the market.
Goal - 1.1632
About Used Indicators:
For more efficient signals, super-trend is used in combination with other indicators like Pivot Points.
Disclosure: I am part of Trade Nation's Influencer program and receive a monthly fee for using their TradingView charts in my analysis.
———————————
WISH YOU ALL LUCK

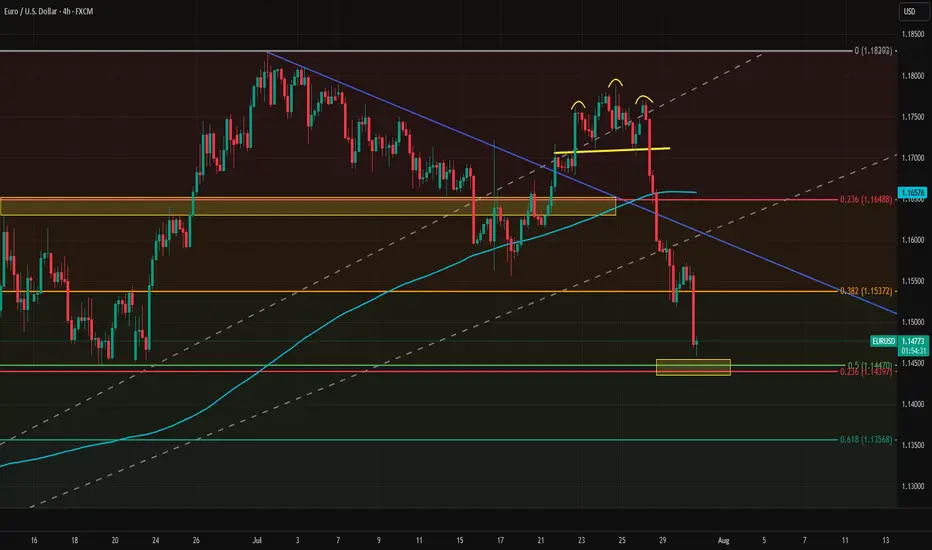
EUR/USD Slips Again – Just a Pullback or More to Come?Hey everyone! Great to have you back for another market chat today.
As of writing, EUR/USD remains under significant bearish pressure, currently trading near 1.154 — marking a rather gloomy start to the new trading week. The euro is clearly struggling to attract buying interest as traders reassess the ECB’s stance and digest the newly announced EU–US trade agreement. Meanwhile, the U.S. dollar is gaining momentum, flipping the trend unexpectedly.
From a technical perspective, EUR/USD is showing clear weakness. The pair has broken below both its rising wedge and previous uptrend line, with candles closing firmly lower — a strong sign that the bears are in control.
In my personal view, I expect EUR/USD to continue sliding toward the next two support zones, although a minor pullback could occur first as part of a typical correction.
But what do you think? Is this just a dip… or the start of something bigger for EUR/USD? Let me know your take in the comments!
