EURUSD – DAILY FORECAST Q3 | W33 | D12 | Y25📊 EURUSD – DAILY FORECAST
Q3 | W33 | D12 | Y25
Daily Forecast 🔍📅
Here’s a short diagnosis of the current chart setup 🧠📈
Higher time frame order blocks have been identified — these are our patient points of interest 🎯🧭.
It’s crucial to wait for a confirmed break of structure 🧱✅ before forming a directional bias.
This keeps us disciplined and aligned with what price action is truly telling us.
📈 Risk Management Protocols
🔑 Core principles:
Max 1% risk per trade
Only execute at pre-identified levels
Use alerts, not emotion
Stick to your RR plan — minimum 1:2
🧠 You’re not paid for how many trades you take, you’re paid for how well you manage risk.
🧠 Weekly FRGNT Insight
"Trade what the market gives, not what your ego wants."
Stay mechanical. Stay focused. Let the probabilities work.
FX:EURUSD
EURUSD trade ideas

Eurusd in rangeEurusd in range- corrective pattern
Expect Oscilation between lines....
Beware the brake of them!

EUR/USD – Possible Pullback SetupWe’re adding this one to the watchlist, but we need the pullback to push a bit deeper into the OTZ.
If that happens, we’ll watch closely to see if the VMS strategy aligns for a potential trade opportunity.
Patience first — execution only if all rules are met.

Euro dollar rollover at the ML & at resting on the edge of priceThere is plenty more going on via Gann MTF & Annual Forecast but technically on the forks the Euro should head to the new median line with approximately an 80% probability. If we get momentum on the sell off and later the new median line ( Downward Pitchfork ) gets breached decisively via a Zoom Bar/Retest, we may get all the way down to the second target as shown. looking for additional shorts on the lower TF. Cheers

EURUSD Holds Steady Ahead of CPI DataAfter the payrolls revision shock, EURUSD appears to have stabilized between the 1.1600 and 1.1710 levels. This sideways movement may continue at least until the release of inflation data tomorrow.
The upcoming inflation report is expected to align with forecasts that see Core PCE rising above 3% by the end of this year, with a gradual monthly increase. However, a downside surprise could trigger a rally in stocks, cryptocurrencies, and EURUSD over the next few days.

EUR USD SHORT RESULT Price is at the major resistance Trendline and zone and has lost momentum to continue upward after failing to hold.
Trade is still running though, will keep watch on where price decides to go next.
_THE_KLASSIC_TRADER_.

EUR USD SHORT RESULT Price was at resistance Trendline and zone after the aggressive pump at the news of the previous week, with conflunce of the demand zone to be filled I opened the short, but price went higher to the channel resistance.
Better Set-ups coming
_THE_KLASSIC_TRADER_.💪

1:2 EURUSD SELLS 40 pips gainThe EUR/USD could drop by 40 pips today toward the 1.16120 level due to a combination of market factors. Weaker-than-expected Eurozone data and stronger U.S. figures—or hawkish Fed comments—could push the dollar higher. Risk-off sentiment may also boost demand for the greenback. From a technical standpoint, price action near resistance combined with a possible break below support aligns with this move. Indicators are currently showing strong downside momentum potential, which could accelerate the fall toward the target.

SHORT EURUSDEntry is brought a bit lower to prevent being trapped in a false breakout. this triangular pattern is a wave 2 correction which should follow a sharp move downwards to fill the FVG-fair value gap on the daily timeframe at least

EURUSDEURUSD also have a correction coming this week before anymore upside.
Disclosure: We are part of Trade Nations Influencer program and receive a monthly fee for using their tradingview charts in our analysis.

EURUSD WeeklyAt some point, the selling pressure on the Euro has weakened and the time for liquidity to come in is approaching. According to this possibility, given the formation of a support zone, we can expect the Euro to rise against the Dollar.
Sasha Charkhchian

EURUSD InsightWelcome to all subscribers!
Please share your personal opinions in the comments. Don’t forget to like and subscribe.
Key Points
- U.S. President Donald Trump and Russian President Vladimir Putin are scheduled to meet in Alaska on the 15th to discuss ending the war. It is reported that President Trump is also working to arrange a “trilateral meeting” by inviting Ukrainian President Volodymyr Zelensky.
- On August 12, the U.S. Consumer Price Index (CPI) will be released. The month-over-month growth rate of the core CPI is expected to be 0.3%, marking the second consecutive month of higher growth compared to the previous month.
Major Economic Events This Week
+ August 12: Reserve Bank of Australia interest rate decision, U.S. July Consumer Price Index
+ August 13: Germany July Consumer Price Index
+ August 14: U.K. Q2 GDP, U.S. July Producer Price Index
+ August 15: U.S. July Retail Sales
EURUSD Chart Analysis
After a sharp drop, the pair has successfully rebounded, rising to the 1.17000 level, which indicates that upward momentum is continuing. However, there is resistance at the 1.18300 level, so confirmation of a breakout above this point will be needed before fully confirming a bullish outlook. If the 1.18300 level is breached, there is a high possibility that the rally will extend to the 1.21000 level.

EURUSD BUY SETUPdollar index is weak
eurusd is at daily zone,formation of candlestick pattern in four hours timeframe

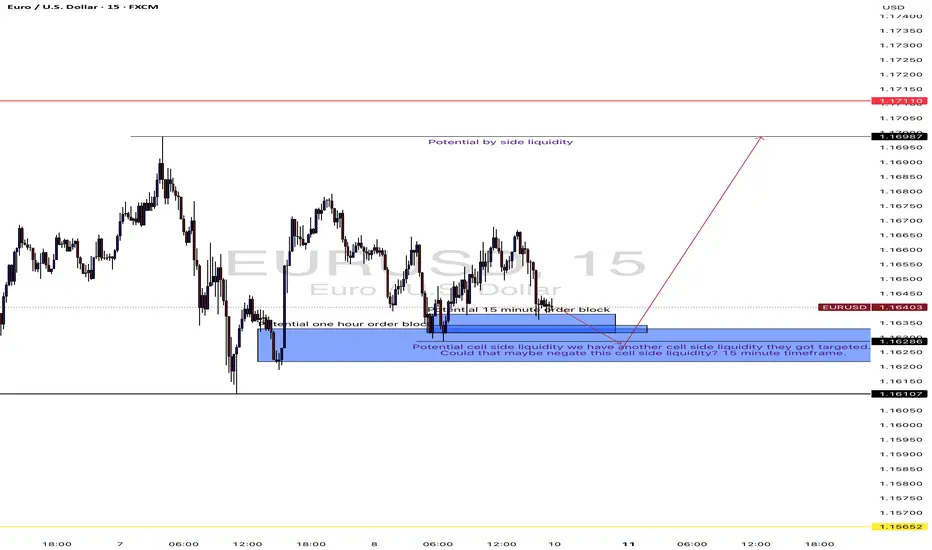
Potential order block two cell side liquidityIn the euro USD, we have a potential cell site to buy some liquidity. I do see a one hour order block and also 215 minutes order blocks. I’m gonna potentially be looking at the Tuesdays high or low of the week and determine what objection I’m gonna have for the week.
Eur this week , Buy with one condition Hello Traders
As you can see on chart
Price locked between 2 levels
1620 - 1670
only buy or sell when price cross one of the mentioned level
if pass 1670 then buy with sl 50 pips and tl 75 pips
If price break 1620 then sell with 50 pips sl and tl 75
As technical instructions . i can see a continuation battern facing up
unless the 2 condions act . I dont recommend any trade
after we reach 1740 - 1760 we can short with big Goals to 1.1450
If you like the post . dont go with no HI :)
Regars ...

Buy then Sell!Hello all. after a very busy week I return to tell you how market will move this week. be happy(wink)

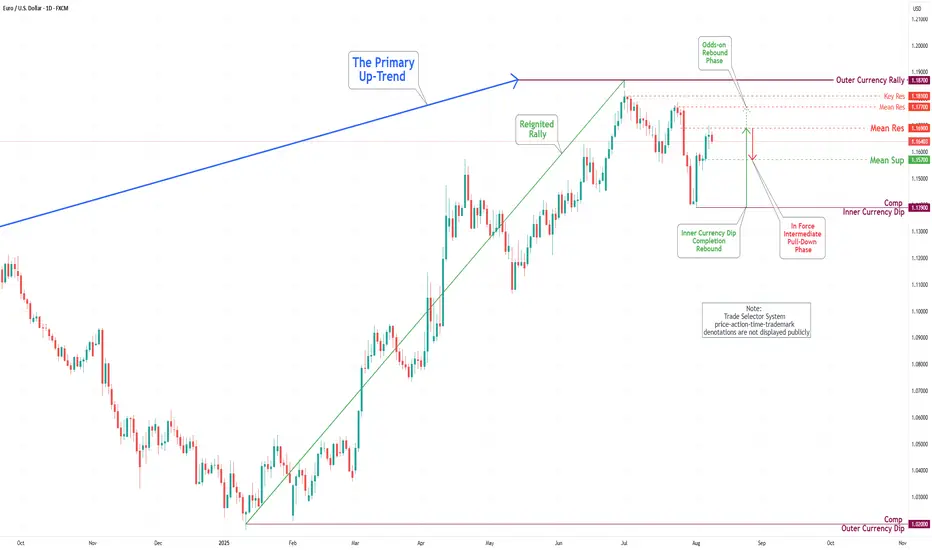
EUR/USD Daily Chart Analysis For Week of August 8, 2025Technical Analysis and Outlook:
During the current trading session, the Euro has exhibited notable volatility, marked by both a significant increase and subsequent decrease in value. Presently, it is approaching the Mean Support level of 1.157. Recent analyses suggest that the Euro is poised for a dead-cat bounce, potentially reaching the Mean Support level of 1.157, and revisiting the target set at the Mean Resistance of 1.169. Additionally, it is essential to assess the likelihood of continued upward momentum towards the Mean Resistance level of 1.177 and the Key Resistance level of 1.181. Such movements could instigate a substantial rebound and contribute to achieving the Outer Currency Rally target of 1.187.
Long 30M EURUSDThis is what I see from 30min chart
It will need to go back to the top once again before heading down
Day Trend is still bearish
RSI of week chart is still at overbought region
Goodluck

EUR/USD REVERSES AFTER BREAK BELOW SUPPORT MORE UPSIDE AHEAD? Hey Traders so today looking at EUR/USD just last week it had looked like it was topping with the 123 top formation on the daily chart.
However always keep in mind that technical analysis works but only when fundamentals line up with it. Therefore if something Fundamentally changes that is big it will completely alter the technical setup. For those new to trading always be aware of Fundamentals that are happening in the market. I am a technical trader but still want to be aware of those reports because these markets can change on a dime!
The last few weeks the Fundamentals for the US dollar were bullish. But last friday the market made a complete 360 when the Unemployment Report came in way lower than expected. Does this mean the Euro Top is over?
No one knows for sure so therefore the scenarios are:
If Bullish- Consider buying the dip back to support at 1.554 consider stop under support at 1.1365 If the FED cuts interest rates that would most likely catapult the Euro fast above 1.833 and the bulls we be happy campers. 😁
If Bearish- If you sold the rally consider reducing risk now that it moved higher. Normally the way you trade the 123 top is sell below the 2 point and put a stop above the 3 point or the 1 point. If the FED holds back on the interest rate Cut that could catapult Euro lower and fast. However this is probably unlikely unless we get strong data before next FED meeting.
COT (Commitment of Traders)- Shows Bearish
The Funds are still long at this point but getting a little crowded on the long side. Normally if they get too long they might get squeezed out of the long positions back to nuetral which could mean buyers are forced to become sellers.
Good Luck & Always use Risk Management!
(Just in we are wrong in our analysis most experts recommend never to risk more than 2% of your account equity on any given trade.)
Hope This Helps Your Trading 😃
Clifford
RISK DISCLOSURE
TRADING IN THE FUTURES AND FOREX MARKET INVOLVES SIGNIFICANT RISK. ALWAYS CONSULT A FINANCIAL ADVISOR AS HIGH RISK ASSET CLASSES MAY NOT BE SUITABLE FOR ALL INVESTORS. THIS IS NOT A RECOMMENDATION TO BUY OR SELL ANY ASSETS. ALL IDEAS ARE MADE FOR EDUCATIONAL PURPOSES. PAST PERFORMANCE DOES NOT GUARANTEE FUTURE RESULTS.
CFTC RULE 4.41 – HYPOTHETICAL OR SIMULATED PERFORMANCE RESULTS HAVE CERTAIN LIMITATIONS. UNLIKE AN ACTUAL PERFORMANCE RECORD, SIMULATED RESULTS DO NOT REPRESENT ACTUAL TRADING.

EURUSD: Local Bearish Bias! Short!
My dear friends,
Today we will analyse EURUSD together☺️
The recent price action suggests a shift in mid-term momentum. A break below the current local range around 1.16638 will confirm the new direction downwards with the target being the next key level of 1.16530 and a reconvened placement of a stop-loss beyond the range.
❤️Sending you lots of Love and Hugs❤️


EUR/USD Bullish Outlook – Why the Euro Could Strengthen📈 EUR/USD Bullish Outlook – Why the Euro Could Strengthen
EUR/USD is showing signs of a potential rebound, supported by both technical setups and shifting fundamentals.
1. Dovish Fed Expectations:
Markets are increasingly pricing in Fed rate cuts as U.S. inflation cools and economic growth shows signs of slowing. A more dovish Fed stance puts downward pressure on the dollar, offering support to the euro.
2. ECB Less Dovish Than Expected:
While the ECB has started easing, recent comments suggest a cautious approach to further cuts. If inflation remains sticky in the Eurozone, the ECB could pause or slow future rate reductions, which would support EUR.
3. Technical Support & Reversal Patterns:
EUR/USD has bounced off strong support forming a bullish reversal pattern (e.g. double bottom / bullish engulfing candle). Momentum indicators like RSI and MACD are turning upward, signaling potential continuation of the move.
4. Improving Eurozone Data:
Recent Eurozone data has surprised to the upside, especially in manufacturing and services PMIs. If this trend continues, confidence in the euro could rise.
📌 Conclusion:
With growing expectations for a Fed pivot and signs of stabilization in the Eurozone economy, EUR/USD could push higher.
