EUR/USD - Buy Idea (long)Watch for opportunities in EUR/USD — a breakout from the forming flag could push the price back to $1.17. Don’t jump in early, wait for the breakout!
EURUSD trade ideas

EURUSD InsightHello to all subscribers, and welcome.
Please feel free to share your personal opinions in the comments. Don't forget to hit the boost and subscribe buttons!
Key Points
- The U.S. Nonfarm Payrolls for July, released last Friday, increased by only 73,000 compared to the previous month, significantly below market expectations of 100,000. Additionally, the job gains for May and June were revised down by a combined 258,000. The unemployment rate rose from 4.1% to 4.2% in July.
- Although the Federal Reserve held interest rates steady at the July FOMC meeting, concerns over economic slowdown have intensified due to weak labor data, making a rate cut in September appear increasingly certain.
- The Bank of England's monetary policy meeting is scheduled for August 7, with a 25 basis point rate cut widely expected.
Major Economic Events This Week
+ August 7: Bank of England interest rate decision
EURUSD Chart Analysis
Following a larger-than-expected drop, the EURUSD pair found a bottom near the 1.14000 level. While a rebound appears to have occurred, the pair is still struggling to break through the resistance at the 1.16000 level, suggesting the potential for further downside. If the price is rejected at this resistance, an additional drop toward the 1.13000 level is likely. On the other hand, if it successfully breaks above the 1.16000 resistance, a further rise toward the 1.18000 level could be expected.

EURUSD policy expectations and risk appetite resonanceAccording to our latest reasoning, the current FX market is entering a structural repair phase driven by policy expectations and risk appetite resonance. Although there is still some uncertainty in the macro environment, a number of leading indicators show that market confidence has begun to gradually repair, with some currency pairs showing stronger upward momentum.
After semantic modeling of news headlines and social buzzwords, we found that positive terms such as "capital reflows", "inflation under control" and "policy clarity" were significantly higher in the keywords related to the currency. The positive terms such as "capital flow back", "inflation control" and "clear policy" were found to be significantly increased. Combined with the market trading behavior data, the system identifies that the long position building behavior has increased, and the ma
We believes that the current market is suitable for adding positions in batches on the low side while controlling risks, especially when short-term market oscillations intensify, and investors can optimize the pace of entry by combining the real-time volatility scoring.

EURUSD LongOn the 15-minute EUR/USD chart, the broader market structure is bullish. A significant Change of Character (CHoCH) occurred around 1.15164, breaking prior bearish structure and indicating a shift in momentum. This was followed by a confirmed Break of Structure (BOS) at approximately 1.15959, confirming bullish continuation and establishing a new higher high.
Looking at the demand zones, we see a strong reaction from the 1.13915–1.14400 area, where buyers stepped in aggressively, initiating a powerful rally. This base is still valid and represents a high-probability area of interest. A secondary demand zone around 1.15100–1.15350 has also formed, and although price has revisited it once already, the reaction was controlled, suggesting buyers are still active there—though slightly weaker than the lower zone.
In the marked region, price is currently pulling back after failing to continue upward past a minor supply level near 1.15800–1.15950. It is retracing toward the local demand zone at 1.15100–1.15350, where we expect a potential bullish bounce. The price action shows a clean retracement with no aggressive selling yet, keeping the bullish bias intact.
Current trade bias is bullish, with the expectation of a continuation to the upside targeting the supply zone between 1.16500–1.17000. The key invalidation level for this bullish scenario would be a clean break and close below 1.15100, which would signal a deeper correction or reversal.
Momentum still favors buyers, given the strong initial impulse and lack of aggressive selling on the pullback. No strong reversal candlestick patterns are present yet, suggesting the retracement may still be developing.
There is no major financial news or macroeconomic catalyst at the moment to invalidate this technical setup. The chart favors a bounce from demand and continuation toward higher supply zones, assuming the key level holds.

EURUSD seems back on track for long continuation.Price did tap into a bigger liquidity pool at around 1.142 and showed a strong change in momentum with an impulsive move to the upside. Price is now in a consolidation phase and left a small Liq.Point at 1.1516, which could act as a base for a continuation structure. The longer it takes for price to tap into said area, the better. I am now looking for a minimum of a 2-touch bullish continuation to enter a long trade into the previous highs.
*** **** *****
👉 The pairs I publish here are usually discussed in detail in my Weekly Forex Forecast (WFF) and are now showing further developments worth mentioning.
Remember, technical analysis is subjective; develop your own approach. I use this format primarily to hold myself accountable and to share my personal market views.
⚠ Ensure you have your own risk management in place and always stick to your trading plan.
*** **** *****

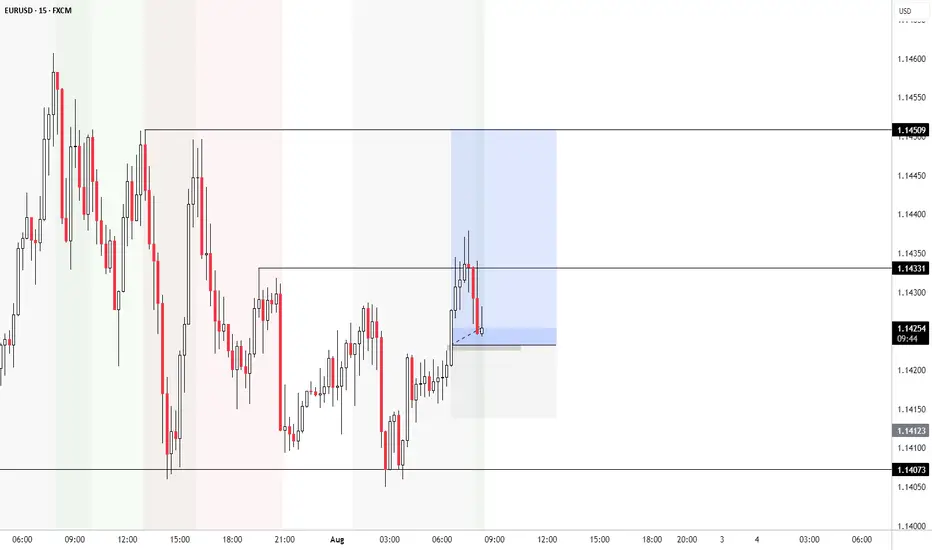
EUR/USD TRADE IDEA — MEMORY LADDER SETUPEUR/USD TRADE IDEA — MEMORY LADDER SETUP
Entry Strategy:
Buy Stop @ 1.1596 (ghost memory trap zone confirmation)
Position Sizing:
• Anchor position: 0.10 lot
• Add-ons: 0.01–0.02 lots every +10 pips
• No SL on add-ons
• SL only on anchor (optional, 14 pips below entry)
Trade Structure:
• Stack long positions every 10 pips above 1.1596
• Begin trailing SL once 3 bricks print (target ~1.1626)
• If price drops below 1.1582 early → anchor SL triggers
• No trade if 1.1596 is never broken
Target Zones:
• 1.1600 → Add-on 1
• 1.1630 → Trail SL to entry
• 1.1730 → First major echo
• 1.2000 → Macro drift target
• 1.2500 / 1.3000 → Long-term Codex zones
Market Context:
• BTC strength + DXY weakness = synthetic gravity alignment
• Ghost memory active from prior cycle (21–45 day echo)
• Price has respected trap coil on lower timeframes
• Awaiting detonation through 1.1596 to activate the trail
Note:
Stacking begins only after a confirmed break of 1.1596.
No SLs on add-ons. Only the anchor is exposed to initial risk.
This setup aims to trail the memory spiral — brick by brick — toward the next epoch zone.
#forex #eurusd #trailstrategy #stacking #renko #codex #fxladder #ghostbrick #dxy #btc

EURUSD. Weekly and Daily AnalysisHi traders and investors!
This analysis is based on the Initiative Analysis concept (IA).
Weekly TF
Price has tapped the 50 % level of the last buyer initiative at 1.14477 and run a manipulation around 1.15569.
Daily TF
We’ve seen a manipulation of the lower boundary of the buyer initiative, and an IKC candle has printed.
Buyer targets on the daily chart: 1.17110, 1.17888, 1.18299.
Before aiming for those, buyers first need to clear the potential sell zones at 1.15994 and 1.16108.
Conservative long setup:
Wait for buyers to defend 1.15994 (or a higher level).
Alternatively, watch the 1-hour support at 1.15165; if buyers hold it, there’s scope for a move toward 1.15994 — and potentially higher after that.
Wishing you profitable trades!

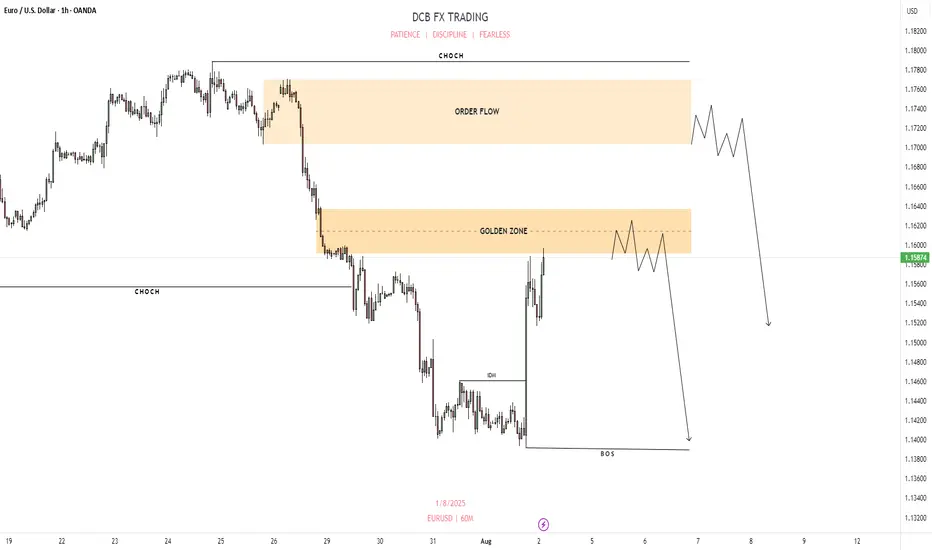
EURUSD SMC ANALYSIS H1 TIME FRAME📉 EURUSD 1H SMC CHART – SHORT BIAS ZONE ACTIVE!
🔶 GOLDEN ZONE REACHED
📍 Zone: 1.15912 – 1.16369
– Previous CHoCH + Clean OB + Premium zone
– Likely area for Smart Money to initiate sell positions
– Price reacting aggressively upon entry
📌 Trade Idea:
– Look for 15M / 5M CHoCH or bearish FVG inside the golden zone
– Ideal sniper entry setup forming soon
– SL above 1.17043 or OB high 1.17692
– TP: Break of structure low and imbalance fill near 1.1450–1.1400
🧠 Bias:
– Order Flow is Bearish
– Strong IDM structure already mitigated
– We anticipate price will grab liquidity and reverse from premium zone
⛔️ Avoid early entries – let Smart Money give the signal. Precision = Power 🎯
#EURUSD #SMC #SniperEntry #SmartMoneyConcept #OrderBlock #GoldenZone #DCBFXTRADING
EURUSD BULLISH-LIKE STRUCTURE!Price maintains a bullish like structure. We’re likely to see more bullish Price movements as price rebounds forming a higher low.
A crucial price level to watchout for is the 1.15784 a breakout above that key level indicates a more bullish strength

Are the EUR re-gained its bullish strength?My technical view on EURUSD Daily:
Trend Direction: Bullish
Stochastic Direction: Stochastic Crossed UP
Daily Resistance: 1.18298
Daily Support: .13871
note: My resistance and Support are based on the last 30 bars, so it may be different form others.
PA Type: Rejection at Support or Resistance
Fundamental News: On Tuesday, 5th, the USD PMI; On Wed, the EUR Retail Sales(YoY)
Conclusion: Due the very bad return from the NFP last Friday we saw all USD pairs change direction. Also the EUR has been in bullish mode since middle of January but couldn't break the 1.1830 Daily Resistance but now it may will continue its upward move heading to re-test the resistance again.
Just note that the technical view on this pair does not mean it will happens. We never know what "pearl" Trump will bring during the week, specially after the NFP results, so trade safe.


The outlook for EUR/USD in the upcoming weekIn the past week, EUR was in a downtrend on the lower cycles, while showing a corrective move on the higher ones.
Following Friday’s news, we saw a strong bullish candle. Unfortunately, the market closed shortly after, so we couldn't confirm whether it was the beginning of a solid trend or just a reaction to the news.
As a result, in the coming week, we need to be more cautious and patient when looking for setups. Since the recent candles were news-driven, it's important to wait for a clear confirmation before acting.
In the chart, three possible scenarios have been outlined — be prepared for any of them.

EURUSD has broken & hovering near resistance.EURUSD has broken & hovering near resistance. US dollar has started weaking again due to Tariff war.

EURUSD - correction ahead of timeWell, well - EUR used the NFP data to start the correction ahead of time. It used the FR 161.8 of the recent correction as support. And it did it in a impressive time...
Now we are heading into Resistance cluster created by the April High and July Low (as wee and FR 38.8 of the whole movement form the July High. Yet the upper level of the cluster is created by the FR 61.8 of the recent impulse, and 1:1 with the recent correction and June High. The second one seems to me as stronger and more probably. However, price may be in hurry again and complete the correction ahead of time... Again.
Just my humble opinion...

TRADE IDEA – EUR/USD SHORT (T2 TRAP REVERSAL)🔻 TRADE IDEA – EUR/USD SHORT (T2 TRAP REVERSAL)
📍 ENTRY ZONE: 1.1560 – 1.1580
🎯 TARGETS:
• TP1 = 1.150
• TP2 = 1.140
• TP3 = 1.130
• TP4 = 1.120
🛡️ STOP LOSS: 1.1600 (above Tier 2 trap extension)
📐 STRUCTURE SNAPSHOT:
• T1 (Macro): 🔻 Down
• T2 (Structure): 🔻 Trap Zone Active (161.8%)
• T3 (Execution): ⚠️ Rejection confirmed via M1 spike + engulf
• T4 (Micro): 🧨 Trap spike → lower high forming
📊 EXECUTION LOGIC:
• M1 rejection at 1.1580 confirmed
• Bearish engulf candle formed post-spike
• Multiple shorts laddered (1.1565 / 1.1580)
• SL held above extension zone
• Price now below both entries
🚦 TRADE STATE: ⚔️ ARMED
• Add-on only valid under 1.1560
• SL trail after 1.1550 break
• No long bias unless 1.1610 breaks with body close
#Renko #FractalCodex #EURUSD #ShortSetup #TrapReversal #Fibonacci #PriceAction

The Day AheadWeekly Summary – Key Data & Earnings (Week Ending August 2, 2025):
Economic Data:
US Jobs Report: Job growth slowed slightly; unemployment ticked up. Supports Fed holding rates steady.
US Manufacturing (ISM): Sector still shrinking, showing weakness.
US Car Sales & Construction: Car sales rose; construction spending up, led by infrastructure.
China Manufacturing: Still contracting due to weak demand.
Japan Jobs Data: Job market remains tight and stable.
Italy: Manufacturing down, car sales slightly up, budget and retail sales steady.
Eurozone Inflation: Inflation slowed, increasing chances of ECB rate cuts.
Canada Manufacturing: Slipped into contraction.
Earnings Highlights:
Exxon & Chevron: Mixed—refining strong, but oil prices hurt results.
Linde: Solid growth from healthcare and clean energy demand.
Nintendo: Strong game and digital sales boosted profits.
AXA: Insurance strong, but investment income dipped.
Regeneron: Beat forecasts, thanks to strong drug sales.
Ares: Private credit demand lifted earnings.
Engie: Renewables helped balance weaker thermal output.
Daimler Truck: Demand steady, but profit margins hit by costs.
LyondellBasell: Missed targets due to weak chemicals demand.
Moderna: COVID sales down; focus now on future drug pipeline.
Takeaway:
The global economy is slowing, but US jobs and spending remain resilient. Companies reported mixed earnings. Central banks are likely to stay cautious, with possible rate cuts ahead if weakness continues.
This communication is for informational purposes only and should not be viewed as any form of recommendation as to a particular course of action or as investment advice. It is not intended as an offer or solicitation for the purchase or sale of any financial instrument or as an official confirmation of any transaction. Opinions, estimates and assumptions expressed herein are made as of the date of this communication and are subject to change without notice. This communication has been prepared based upon information, including market prices, data and other information, believed to be reliable; however, Trade Nation does not warrant its completeness or accuracy. All market prices and market data contained in or attached to this communication are indicative and subject to change without notice.
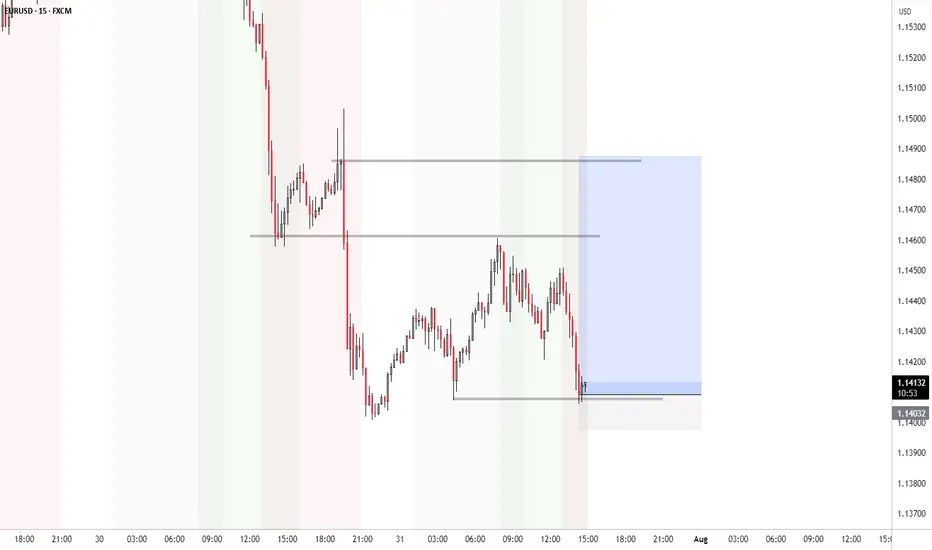
EU LONGCurrently monitoring EUR/USD for potential long opportunities. I’m looking for signs of bullish momentum supported by structure, liquidity sweeps, and alignment with DXY weakness. Waiting for a clean entry confirmation within a key demand or liquidity zone.
EURUSD 8H – 15% Yearly Channel Move, But Is This the Retest?EURUSD has been riding a clean parallel channel since early 2025, printing a steady +15.88% climb from the lower boundary to the upper resistance.
After mid-year rejection at the top of the range, we’re now testing the midline and eyeing the lower channel boundary. Structure still holds, but the next few candles may confirm if this is just a healthy retest or a bigger breakdown brewing.
Big macro structure. Simple levels. Watching for signs of momentum reclaim or deeper drift.

EUR/USD Rising Wedge Break Now Oversold on H4Markets have moved quickly this week and it's been a very bearish outlay for EUR/USD since last Thursday's ECB rate decision. The pair set a lower-high around that announcement and then the day after saw bears make another push, with a key hold at a Fibonacci level plotted at 1.1748. I've been highlighting that level since before the Q3 open and so far, that's the spot that bulls have failed to leave behind.
The quandary now is just how quickly this move has come on. The USD is working on its strongest month since April of 2022 and that prior instance was driven by the Fed starting a rate hike cycle, which clearly isn't happening here. Also complicating the matter is the fact that RSI on the four-hour chart has already pushed into oversold territory, making the prospect of chasing-lower a daunting item.
We've already seen an instance of prior support coming in as resistance with the hold of the daily high at 1.1457. With NFP tomorrow, perhaps the more attractive scenario would be a larger pullback which could then highlight resistance potential at either 1.1500 or 1.1560. - js

EU LONGI'm currently monitoring EUR/USD and looking for potential long opportunities. If price action confirms, I’ll be looking to enter a buy position, anticipating upward momentum in the near term.
EURUSD Forecast📊 Technical Analysis
● FX:EURUSD EURUSD confirmed a double rejection below long-term resistance with two lower highs and broke channel support at 1.1567.
● Price is now trending within a descending channel toward 1.1363, with lower targets pointing into the 1.12–1.11 demand zone.
💡 Fundamental Analysis
● US Q2 GDP surprised to the upside, reinforcing the Fed’s hawkish tone, while Eurozone CPI inflation cooled below forecast.
● Diverging central bank trajectories continue to widen yield differentials in favor of the dollar, sustaining bearish euro flows.
✨ Summary
Short bias confirmed below 1.1567. Break of 1.1450 opens path to 1.1363 ➜ 1.1200 zone. Watch for rallies to fade below trendline.

EURUSD REACHED THE TARGET.EURUSD REACHED THE TARGET.
EURUSD has reached the 1.14500 level and even broke it down. Currently the price consolidates slightly below this level. If the price forms a false breakout of 1.14500 level, this will mean the end of short-term decline in the pair. Stay cautious.

eurusd buy short termafter yesterday's drop of the euro, today and tomorrow should make a small correction of 100 pips, extending to 150 pips, until the value of 1.1550
