Premarket Analysis - Will Price Head Lower?Hello everybody!
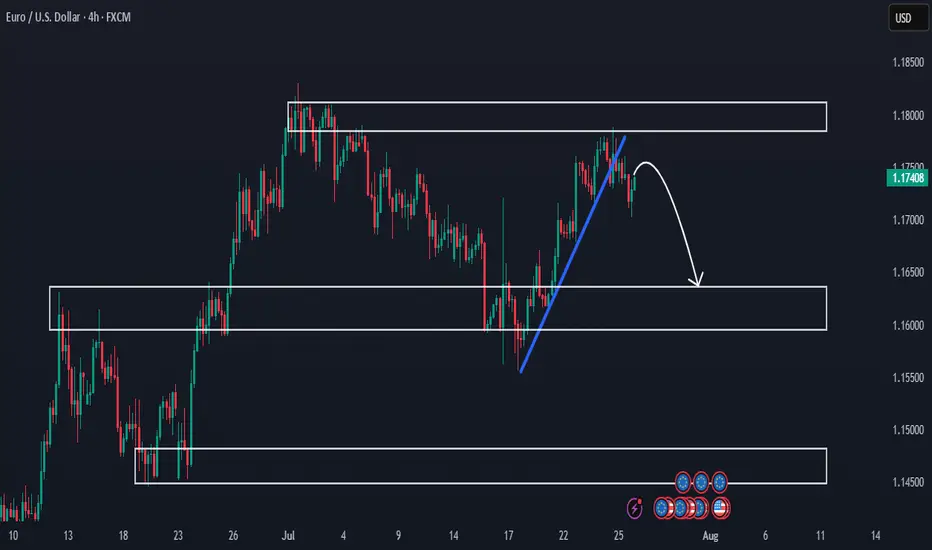
We’re looking at three key areas on the chart.
Price has been rejected from a supply zone.
The clean upward trendline has been broken, and we expect the price to move lower this week.
If the drop continues, we’ll look to sell and aim for the more likely target around 1.16400.
Then we’ll see whether this first demand/support area holds or not.
Have a good trading week ahead!
EURUSD trade ideas
EUR/USD Analysis: Potential Reversal at Key Support📉 Day 3 of 100: EUR/USD Breaks Structure!
Today’s market gave us a lesson! 📚
✅ SL Hit due to news
✅ 61% order block broken
✅ NY session may go bullish after Asia+London trap
.
Are you seeing the pattern unfold?
👇 Comment “Wave Watcher 🌊” if you use Elliott Wave!
Day 3/100 - EUR/USD Breakdown! | Forex Analysis | Elliott Wave | Order Block Strategy
In today’s update: 📌 SL hit due to major fundamental shift
📌 Break of 61% order block; heading to 78% zone
📌 Similar pattern in Tokyo/London sessions—bullish setup possible for NY session
.
💬 Drop a comment if you're also using Elliott Wave price action!
👍 Like | 🔁 Share | 🔔 Subscribe for more daily updates!
🚀 Join the 100-Day EUR/USD Challenge — Let’s decode the market together!
#forex #eurusd #elliottwave #orderblock #forextrader #forexeducation #smartmoneyconcepts #priceaction #forexchallenge #newyorksession #technicalanalysis #forexstrategy
---

EURUSD: Will Go Down! Short!
My dear friends,
Today we will analyse EURUSD together☺️
The market is at an inflection zone and price has now reached an area around 1.15996 where previous reversals or breakouts have occurred.And a price reaction that we are seeing on multiple timeframes here could signal the next move down so we can enter on confirmation, and target the next key level of 1.15562..Stop-loss is recommended beyond the inflection zone.
❤️Sending you lots of Love and Hugs❤️

EURUSD Quality ShortH4 H1 Dropping hard
Stoploss behind solid resistance
Take profit on next nearest support which is solid
80%-90% odds, and positive Risk Reward

EURUSD_1D_SellEurodollar Analysis Medium-term Time Elliott Wave Analysis Style The market can enter a downtrend due to the completion of five ascending waves, which will be in the form of three ABC waves Important and main resistance number 1.1666 Target 1.0800

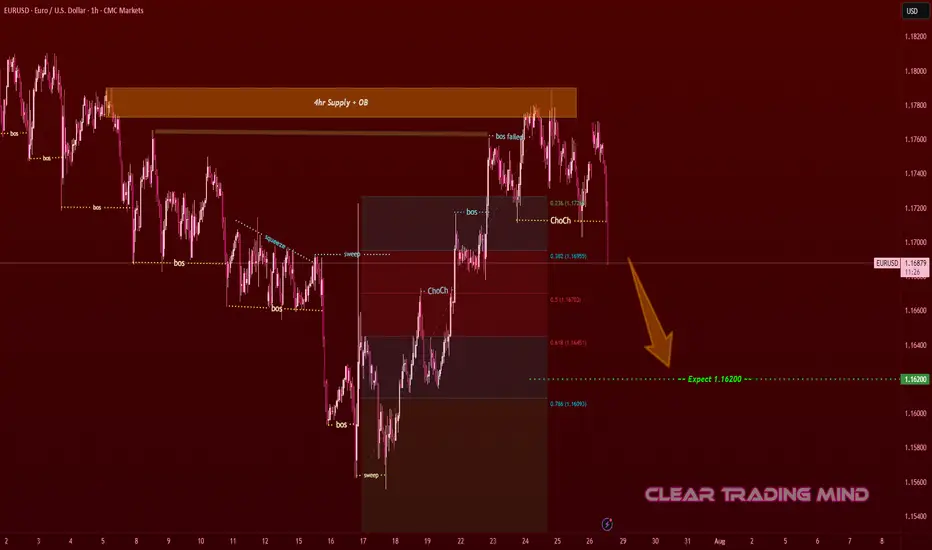
EURUSD Supply Rejection – Bearish Move ExpectedOn the 1-hour chart, EURUSD tapped into the 4hr Supply + OB zone 🟧 and failed to hold above previous structure.
- BoS (Break of Structure) shows weakness at highs
- ChoCh (Change of Character) confirms bearish shift
- Price rejected from 0.236 Fib level (1.17400) and is moving lower
Plan:
- Expecting price to move toward 1.16200 (≈ 120 pips from current level) 🎯
- Bearish momentum remains valid as long as price stays below supply zone
- Confirmation candles & retests strengthen short bias
Reasoning:
- Supply zone rejection + failed breakout
- Clear structure shift (ChoCh) toward lower lows
- Fib retracement confluence (0.5 – 0.618 zone) aligning with sell pressure
(Not financial advice – only a personal observation)
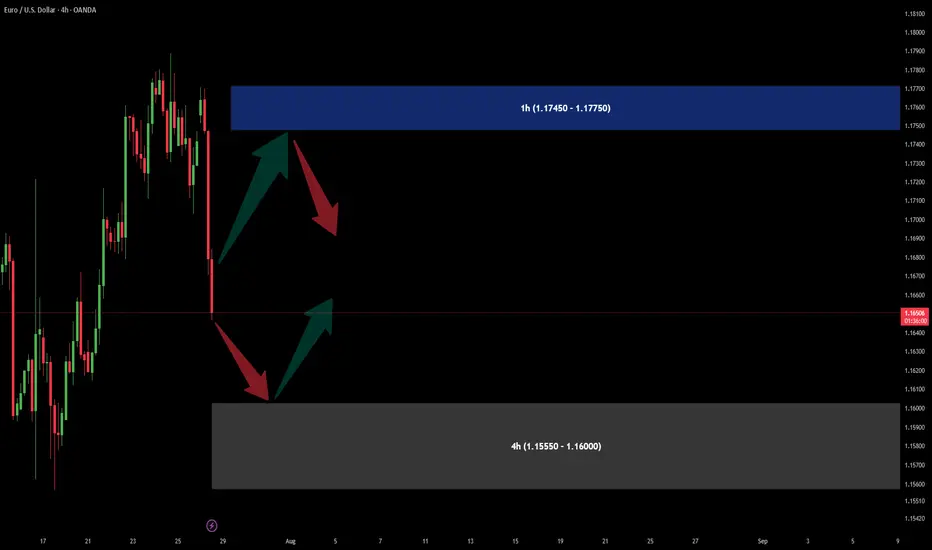
A Sell & A Buy OFFER for EURUSDThere is a Demand area in 4h time frame near (1.15550 - 1.16000) and a good support area in (1.17450 - 1.17750) zone.
S/L would be under (over in sell) zones which I have specified.
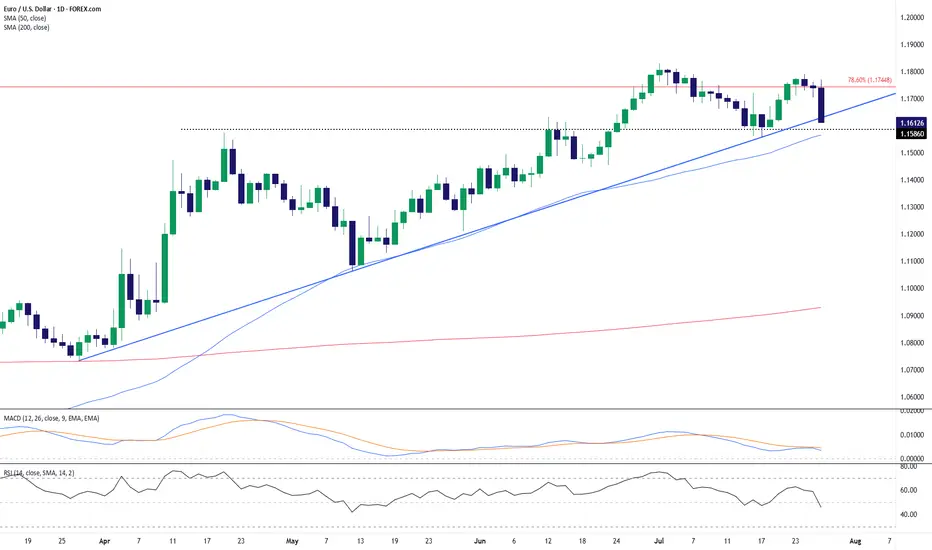
EUR/USD: Breakdown From Key Fib Confluence Threatens UptrendEUR/USD has snapped a key confluence zone after rejecting the 78.6% Fibonacci retracement level near 1.1745. The latest daily candle shows a sharp bearish engulfing bar that sliced below both the ascending trendline and the 50-day SMA (1.1565), signaling a potential trend reversal or deeper correction.
This breakdown follows a multi-week uptrend, and momentum indicators are starting to confirm the bearish shift:
MACD is showing a bearish crossover below the signal line.
RSI has dropped below 50 (currently around 45.8), reflecting weakening bullish momentum.
The pair has now settled just above horizontal support near 1.1586. A decisive close below this level could open the door toward the next support zone around 1.1450–1.1500, where prior consolidation and the rising 200-day SMA (1.0929) may act as stronger demand.
Bulls will need to reclaim the 1.1650–1.1700 zone and see a bullish crossover on momentum indicators to regain control. Until then, the path of least resistance appears tilted to the downside, especially with trendline and Fib support now breached.
Bias: Bearish while below 1.1700. Watch for continuation lower if 1.1586 fails to hold.
-MW
EURUSD ~ Real Time Elliott Wave UpdatesThis is an update of a chart I had previously posted. Here, we can see that Wave 1(Red) has already completed and a pullback occurred soon after, marked as Wave 2(Red) or Wave A(Blue). This has two markings because on one hand it could be a Zigzag formation or it could be the first wave of a Flat correction. All other analysis remains the same as I had previously posted. Sentiment still remains a sell.
@fabrx900

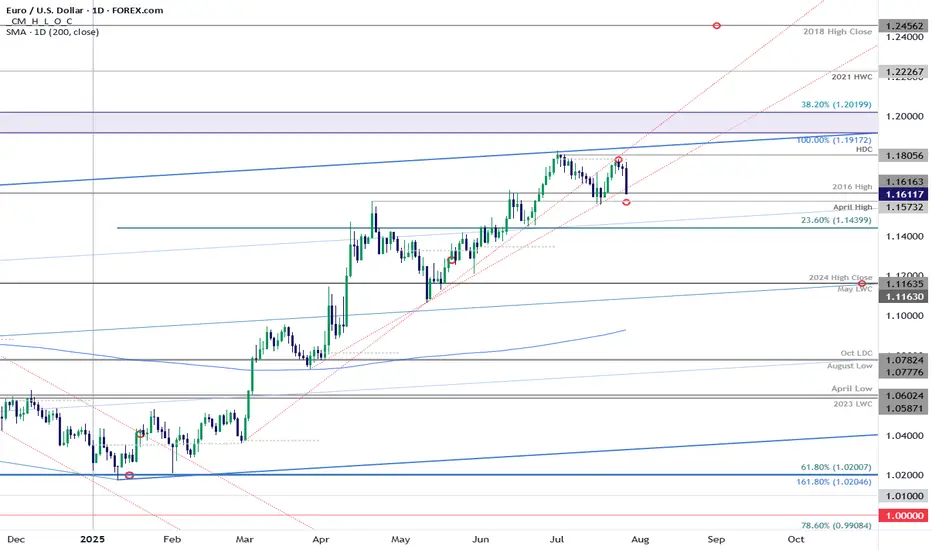
EUR/USD: Euro Poised for Monthly Range Breakout Ahead of FedEuro defended resistance at the monthly opening-range high / July open at 1.1787-1.1805 last week with price plunging back into support today at the late-February trendline / 2016 high at 1.1616.
Medium-term bullish invalidation rests with the April high at 1.1573 and a close below this level would suggest a more significant high is in place / a larger correction is underway. Stay nimble here into the monthly-cross and watch the weekly closes for guidance.
-MB
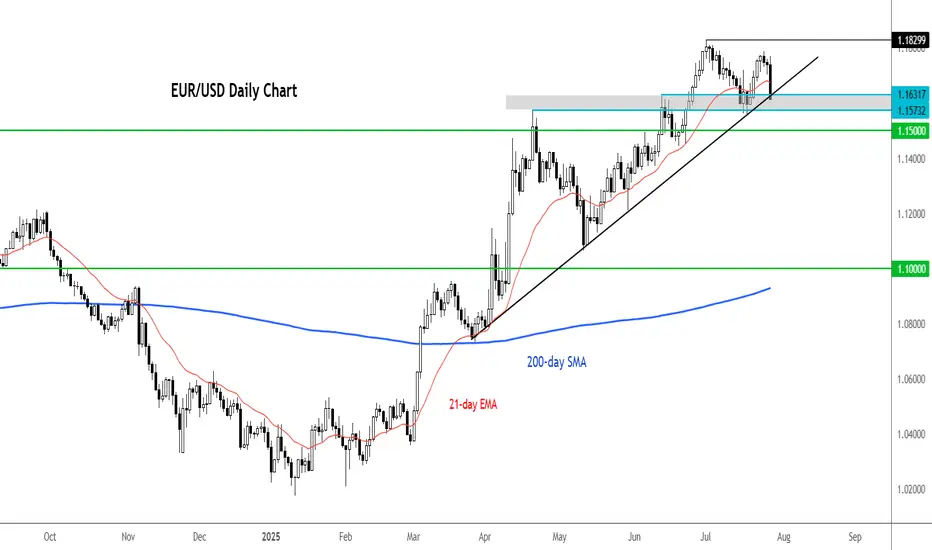
EUR/USD testing bull trend after 1% dropThere are multiple factors weighing on the EUR/USD today. We have seen a broad dollar rally, suggesting that the trade agreements are seen as net positive for the US economy, even it means rising inflation risks. With higher tariffs and Trump’s inflationary fiscal agenda, interest rates in the US are likely to remain elevated for longer.
As far as the euro itself is concerned, the single currency fell all major currencies, which suggests investors were not impressed by the EU’s negotiation tactics. Accepting a 15% tariff on most of its exports to the US while reducing levies on some American products to zero, means the deal will make companies in Europe less competitive. Still, it could have been a far worse situation had we seen a trade war similar to the US-China situation in April. It means that there is now some stability and businesses can get on with things. On balance, though, European leaders will feel that they may have compromised a little too much.
Technically, the EUR/USD is still not in a bearish trend despite today’s sizeable drop. But that could change if the bullish trend line breaks now. If that happens 1.15 could be the next stop. Resistance is now 1.1650 followed by 1.1700.
By Fawad Razaqzada, market analyst with FOREX.com

EUR USD buy setupHello traders!
This is a possible reversal scenario. Today, we had a pump following Trump’s EU deal, which gave the market a bullish push.
However, just like every mountain climb requires a descent, I’m considering this setup as a potential correction.
⚠️ Important: Keep in mind that this trade goes against the trend! So, it's crucial to wait for a confirmed price close above the marked line before taking action.
If the setup offers a favorable risk-to-reward ratio, you may consider an instant execution. If not, you can place a buy limit order instead.
Also, keep an eye on the upcoming JOLTS Job Openings data—it could shift the market sentiment significantly.
Disclaimer: This is just an idea and not a trading signal. It’s shared for educational and backtesting purposes only. Please do your own analysis before making any trading decisions.

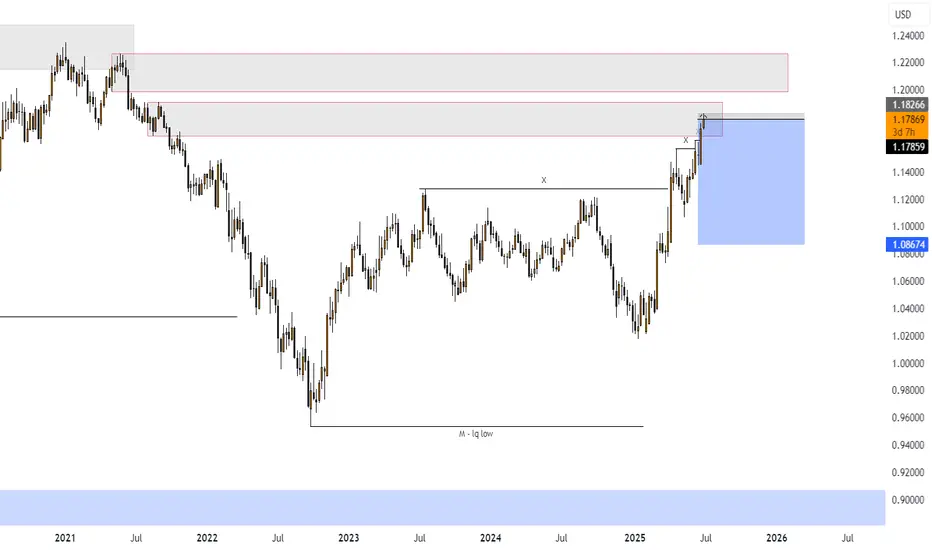
Potentially, A Safer Way To Long The EURUSDIn contrast to my previous outlook, the current price action suggests an increased probability of a deeper bearish move—potentially invalidating the buy zone marked out in the previous analysis. This sudden change is largely driven by the prospect of untapped liquidity residing beneath that zone, reinforcing the well-known market principle that price seeks out liquidity before committing to directional moves.
Given this development, the newly identified zone on the chart emerges as a more technically sound and reliable area from which to anticipate bullish interest. It aligns better with the broader liquidity profile and offers a stronger base for accumulation. Traders may opt to wait for confirmations within this zone or, depending on their risk appetite, consider executing buy positions upon price entry.
As always, patience and clarity are key as we allow price to reveal its intention.
Fingers crossed 🤞
Wishing you all a focused and profitable trading week.
Catch you on the next one. 🫡

EURUSD - Monday analysis - Tarifs EUR/USD Analysis – Market Response to US–EU Tariff Agreement
Following the agreement between the United States and the European Union to implement 15% tariffs, the DXY is strengthening, which is triggering a sharp decline on EUR/USD.
I’m focusing on a potential pullback to rejoin the move or the formation of a new structure.
Given that such strong moves often lack long-term sustainability, I’ll be watching the 1.16654 level closely — looking for a possible structure break and the beginning of a corrective phase.
Trade management will be based on the evolving price action throughout the session.
🔻 In summary: Today, I'm looking for opportunities to either join the ongoing move or enter a fresh structure that sets us up for the next leg — especially with a news-heavy week ahead.
👉 Follow me for more EUR/USD trade ideas, market updates. 💼
I share structured analysis every Monday and Wednesday to help you stay aligned with the market 🗓️📊

TRADE UPDATE – LIVE SHORT IN PLAY⚠️ TRADE UPDATE – LIVE SHORT IN PLAY
📉 Pair: EUR/USD
🔹 Entry: 1.1665 (Short)
🔒 SL: 1.1800
🎯 TP1: 1.1500
📍 Current Price: 1.1633
🧮 Current R:R (TP1): 1.22:1
🧱 Renko Structure: Active inside Brick 16 (1.1600–1.1700)
📊 Bias: Bearish continuation confirmed
⸻
🧠 Why We’re In This Trade:
• The previous long thesis is invalidated — price closed below 1.1700 and rejected Brick 17
• We’re now inside Brick 16, actively rotating downward
• Momentum is cleanly bearish, with H1 confirming lower highs
• 1.1500 is the first Renko target, and macro structure favors continuation to 1.1400+
• All bricks beneath 1.1600 are clean — no support zones until TP1
⸻
🎯 NEXT TARGET ZONE: 1.1500 (TP1)
〰️ Brick 14 Confirm — High-probability completion zone for current leg
⸻
📌 Action Plan:
✅ If price breaks and closes below 1.1600:
→ Move SL to BE
→ Watch for fast drop toward 1.1500
❌ If price closes above 1.1700:
→ Structure is weakening — prepare to cut or re-evaluate
❌ If 1.1800 hits:
→ Full invalidation — trade thesis broken
⸻
📛 Reminder:
No new longs allowed unless Brick 17 (1.1700+) is fully reclaimed
No FOMO shorts — only add on rejection spikes or full brick closes

EURUSD at Make-or-Break Zone: Time to Short?EURUSD – Key Data Out Today, Short Setup Confirmed?
Today, several important economic indexes were released for both the Euro(EUR) and the Dollar(USD) . Let’s break them down in a simple way:
Eurozone PMI Data: Mixed to Weak
France:
Manufacturing PMI: 48.4 (slightly lower than forecast)
Services PMI : 49.7 (flat, but below 50 = contraction)
Germany:
Manufacturing PMI: 49.2 (weaker than expected)
Services PMI : 50.1(slightly expansionary)
Eurozone Overall:
Manufacturing PMI: 49.8 (still below 50)
Services PMI : 51.2 (slightly stronger than forecast)
ECB left the Main Refinancing Rate unchanged at 2.15% , which was widely expected.
U.S. Data( TVC:DXY ): Strong and Surprising
Unemployment Claims: 217K (better than expected 227K)
Manufacturing PMI: 49.5 (below forecast of 52.7 – a negative surprise)
Services PMI: 55.2 (well above forecast and previous – bullish for USD)
Interpretation :
The Eurozone's growth remains sluggish, especially in France and Germany.
Despite a drop in U.S. manufacturing, the services sector remains strong, and unemployment data confirms labor market resilience.
This mixed picture slightly tilts the balance in favor of the U.S. dollar, especially as the ECB remains on hold while the Fed may still consider being restrictive.
Bias: Short EURUSD ( FX:EURUSD )
Fundamentals support a Short position in EURUSD, in line with the current technical setup.
---------------------------------
Now let's take a look at the EURUSD chart on the 4-hour time frame to find the best Short position .
EURUSD is currently trading in an Ascending Channel and at a Heavy Resistance zone($1.1845-$1.1602) .
Also, in terms of Elliott wave theory , it seems that EURUSD is completing a microwave 5 of the main wave 5 .
One of the most important supports ahead for EURUSD could be the 100_SMA(4-hour TF) .
If the currently 4-hour candlestick forms a Shooting Star Candlestick Pattern , it is a better sign for EURUSD to fall .
Also, we can see the Regular Divergence(RD-) between Consecutive Peaks .
I expect EURUSD to decline to at least $1.169 AFTER breaking the lower line of the ascending channel .
Second Target: Support zone($1.1642-$1.158) and Monthly Pivot Point.
Note: Stop Loss(SL)= $1.1850
Please respect each other's ideas and express them politely if you agree or disagree.
Euro/U.S. Dollar Analyze (EURUSD), 4-hour time frame.
Be sure to follow the updated ideas.
Do not forget to put a Stop loss for your positions (For every position you want to open).
Please follow your strategy and updates; this is just my Idea, and I will gladly see your ideas in this post.
Please do not forget the ✅' like '✅ button 🙏😊 & Share it with your friends; thanks, and Trade safe.

EUR/USD | Correction Near Key Demand – Watching for Rebound!By analyzing the EURUSD chart on the 4-hour timeframe, we can see that after the last analysis, the price started a correction and is currently trading around 1.17150. I expect that once it enters the 1.16780–1.17100 zone, we could see a rebound from this key demand area. If the price holds above this zone, the next bullish targets will be 1.17370 as the first target and 1.17730 as the second.
Please support me with your likes and comments to motivate me to share more analysis with you and share your opinion about the possible trend of this chart with me !
Best Regards , Arman Shaban

EURUSD - trade - market structureDXY - trade - market structure , easy setup, clean setup , good probability, if this happen is a big win, use risk and trade managment
EURUSD TEMPORARY BUY THEN SELLBIG picture SELL
There is Temporary BUY since 15m SELL range swiped to BULL.
The BULLISH can start from 1.1736 (BUY ZONE) (I WONT BUY IF SELL ZONE TAPPED FIRST)
TP: 1.1762 (SELL ZONE)
SELL ZONE (1.1762/1.1770) After confirmation SELL.
TP: 1.1710

EURUSD BUY IDEAMe currently on Bull Retracement bias for EURUSD based on candlestick confirmation and divergecne on RSI and Awesome Oscilator, trade your plan ,

EUR/USD – Short from Channel TopHi Traders , Took a short on EUR/USD after price rejected the top of the ascending channel.
Entry: 1.17545
Stop Loss: 1.18015
Take Profit: 1.17098
📌 Why I took this trade:
Price is showing rejection at the upper trendline + near resistance (R1). RSI is cooling off, so I’m expecting a move back to the demand zone around 1.1710.
Clean structure, low risk, good reward.
Just my take, not financial advice.
What do you think — continuation or rejection?

Euro will rebound from support line of wedge to resistance levelHello traders, I want share with you my opinion about Euro. After breaking out decisively from a prior downward channel, the euro initiated a significant structural shift, moving from a clear downward trend into a new and more volatile market condition. This transition has led to the development of a large broadening wedge pattern, which is characterised by higher highs and lower lows, indicating an expansion in volatility as both buyers and sellers fight for control. The boundaries of this struggle are well-defined by a major buyer zone around 1.1650 and a formidable seller zone near 1.1750. Currently, the pair is in a corrective phase, moving downwards within the wedge after a recent upward rebound was rejected from the upper resistance line. The primary working hypothesis is a long scenario, which anticipates that this downward correction will find strong support at the confluence of the wedge's ascending support line and the horizontal buyer zone around 1.1650. A confirmed bounce from this critical area of support would validate the integrity of the broadening wedge pattern and likely trigger another powerful upward rotation. Therefore, the TP is strategically placed at the 1.1750 resistance level. Please share this idea with your friends and click Boost 🚀
Disclaimer: As part of ThinkMarkets’ Influencer Program, I am sponsored to share and publish their charts in my analysis.
