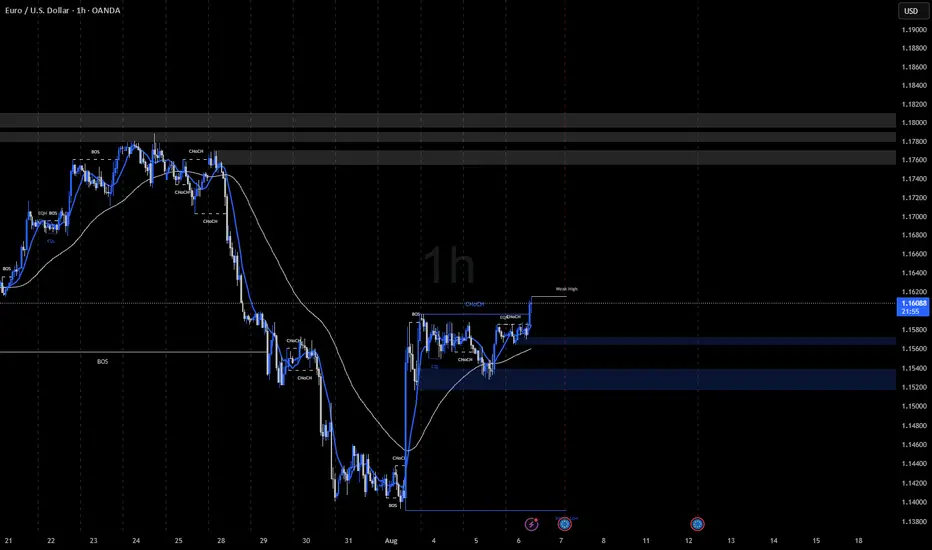
EURUSD After breaking below the ascending trendline, EUR/USD has confirmed a structural shift with strong bearish momentum. The pair retested the broken trendline and is now facing resistance between 1.1589 – 1.1613, which also aligns with a previous demand zone turned supply.
Price is currently respecting this area and forming a potential lower high, indicating the continuation of the downtrend.
🔻 Trade Setup (illustrated on chart):
Entry: Around 1.1589
Stop Loss: Above 1.1629
Target: Down to the 1.1250 area, near previous consolidation support.
This short setup is supported by:
Bearish break of structure
Failed bullish continuation
Macro backdrop (weak US data pushing rate cut odds up, but EUR remains fundamentally weak amid sluggish EU data)
📉 If price holds below 1.1613, bears may remain in control. A break above this zone invalidates the setup.
EURUSD trade ideas

Sell eurusdWeekly still overbought
Monthly sell structure
Weekly buying channel and now respected the upper resistance of buying channel
Ready for the bearish correction now

SELLExpecting EURUSD to go down starting from next week. so far has respected resistance levels on multiple timeframes

EUR/USD short: Can King USD survive King DJT?Hello traders.
The market has been to kind to me since Friday's NFP print.
I closed my long EUR/USD, EUR/CAD and GBP/USD positions this morning.
The charts tell the story.
The reaction to the NFP print was dramatic but despite all the negative factors(tariffs, inflation, uncertainty, NATIONAL DEBT!) influencing the USD, I still believe that the greenback is the cleanest shirt in the laundry hamper.
For now, the technical picture point to a correction after the Euro Zone tariff announcement 10 days ago. If it really comes down to a contest, the USA will prevail in the tariff war.
Which brings me to my caption. I was watching President Trump announcing Apple's increased investment in the USA(another $100B in addition to the existing $500B commitment) and the best part of the announcement was that he did not call Mr. Cook, Tim Apple again.
While I am certainly supportive of Apple increasing production in certain sectors like their own M chips, recycling rare earths and so on, it still does not solve the problem of a us living on a planet with economic and trade practices that benefit everyone, especially the most needy on our planet of abundance.
And there lies the conundrum in my mind. President Trump wants to be the kid in the playpen that grabs all the toys and do not share. "Mine, mine, mine". Well, if all the toys are yours, it will lead to a stronger USD, increased inflation and therefore no rate cuts from the FOMC other than the projected 25bps in September. So, increased yields on USD 10Y treasuries and a deeper debt hole for future American generations but for now, I think the USD will prevail. Cleanest shirt, folks because as long as we have Don Donald in the Oval Office strong arming and black mailing everyone, King USD will reign. But woe the day that is is no longer true.
I am certain King USD will outfox King DJT. Why? As I have indicated in my profile, I live by the mantra that markets are sometimes irrational, but mostly right.
DXY is still holding above an uptrend line dating back to May 2011.
As for GBP/USD, rate decision later tonight.
Please share your thoughts.

EUR/USD Analysis – August 10, 2025
EUR followed our previous scenario to the letter.
After hitting our take-profit level, price retraced right into our anticipated zone.
With the current sideways price action and compression,
I expect high volatility in the coming week.
Bias remains bearish – I anticipate another break to the downside,
with a likely move back to the previous swing low.

EURUSD Short (Update)EURUSD is still net short during the northern hemisphere summer.
There is lower volume causing a lack of conviction and direction.
Which way will it go?

EUR/USD bullish short- termThe US dollar (USD) is under pressure as markets anticipate a possible rate cut from the Federal Reserve, which could weaken the currency.
Meanwhile, the eurozone remains stable, supporting the euro’s position.
On the chart, price is currently testing a key support level reinforced by an ascending trendline and a strategic Fibonacci level. As long as this support holds, the bullish scenario remains favored, with a potential target around 1.1698.
💡 Strategy: Monitor price action at this support, especially ahead of any Fed announcements that could confirm or deny the expected rate cut.


TRADING RECAP ON AUDJPY AND EURUSDHey, my people, I have made a quick video on the trades I took from last week, and I hope that I have shared some lessons that would be useful for you all to take on board and I hope that by the end of this video, you will have clarity on what the trade probability would look like.

EUR/USD Bullish Reversal Pattern Targets 1.1695The EUR/USD 30-minute chart shows a completed ABCD harmonic pattern with a sharp bounce from the 1.1600 support zone. Price action suggests a bullish reversal toward the projected target of 1.1695, supported by strong demand at point D and a break above minor resistance. Traders may watch for confirmation on pullbacks before continuation.
1. Pattern Structure – ABCD Harmonic
The chart outlines an ABCD harmonic pattern, with points labeled A, B, C, and D.
Point D aligns with a strong horizontal support level around 1.1600, suggesting a potential reversal zone.
2. Trend Context
The pair had been in an uptrend from August 6–8, followed by a correction forming the ABCD structure.
The correction ended with a sharp drop from point C to D, creating an oversold condition.
3. Support & Reversal Zone
Point D is positioned at a confluence of prior lows and trendline support, increasing the probability of a bounce.
The recent candles show stabilization and early bullish pressure.
4. Projection & Target
The pattern projects a potential upward move toward 1.16952.
This aligns with previous swing highs and offers a realistic short-term bullish target.
5. Trade Implication
A break above minor consolidation near 1.1625 would add confirmation.
Risk management should place stops below 1.1600 in case of a false breakout.

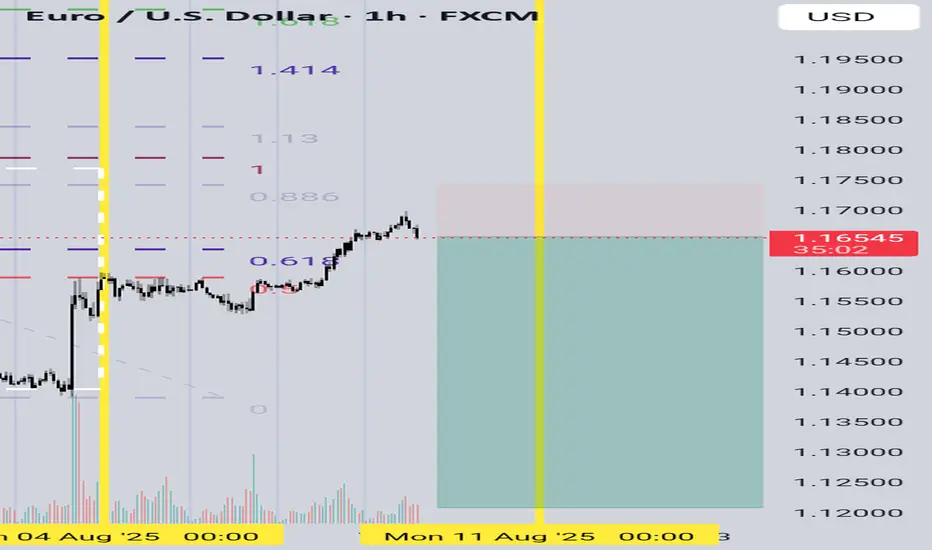
EUR/USD 4-Hour Candlestick Chart - OANDA4-hour candlestick pattern for the Euro/U.S. Dollar (EUR/USD) currency pair on the OANDA platform, showing a recent price of 1.16068 with a 0.00348 (-0.30%) decrease. Key levels include a sell signal at 1.16059 and a buy signal at 1.16076, with a highlighted resistance zone around 1.16697-1.16797 and support around 1.15453. The chart indicates a downward trend following a peak, with price action tracked from August 11 to September 11, 2025.

EUR/USD Technical Analysis:EUR/USD is currently trading near 1.1540, after failing to break through the 1.1600 resistance, creating a key decision zone.
🔹 Bearish Scenario:
If the price breaks below 1.1530 and holds, it may trigger a drop toward 1.1450, with further downside potential to 1.1400 if bearish momentum continues.
🔹 Bullish Scenario:
If the pair breaks above 1.1600 and holds, a move toward the 1.1650–1.1700 zone becomes likely.
⚠️ Disclaimer:
This analysis is not financial advice. It is recommended to monitor the markets and carefully analyze the data before making any investment decisions.

EUROUSD NEW OUTLOOKAccording to M15 analysis EUROUSD Market is running in side wave from last few hours now market will be go down RESISTANCE LEVEL So if you are intersted then Go sell from RESISTANCE LEVEL TRADE AT YOUR OWN RISK

EURUSD My Opinion! SELL!
My dear subscribers,
My technical analysis for EURUSD is below:
The price is coiling around a solid key level - 1.1668
Bias - Bearish
Technical Indicators: Pivot Points Low anticipates a potential price reversal.
Super trend shows a clear sell, giving a perfect indicators' convergence.
Goal - 1.1588
About Used Indicators:
By the very nature of the supertrend indicator, it offers firm support and resistance levels for traders to enter and exit trades. Additionally, it also provides signals for setting stop losses
Disclosure: I am part of Trade Nation's Influencer program and receive a monthly fee for using their TradingView charts in my analysis.
———————————
WISH YOU ALL LUCK

EUR/USD at Major Resistance Confluence – Rejection Ahead?EUR/USD – Key Decision Zone
The price is testing a major confluence between horizontal resistance (1.16–1.20) and a long-term descending trendline. The weekly RSI shows overbought conditions, similar to 2017, 2018, and 2021 — all followed by corrections. Likely scenario: a possible false breakout above resistance followed by rejection and consolidation. Price action in this zone will be crucial.
Technical Analysis Process: EUR/USD (Weekly Chart)
1. Descending Red Line (Trendline)
This line represents a long-term dynamic resistance.
It has been respected multiple times in the past, which increases its relevance.
The current price action is approaching this trendline again, suggesting a potential bearish reaction from sellers.
2. Static Resistance Zone (Upper Brown Rectangle)
Ranges approximately between 1.16 – 1.20.
Historically acted as both support and resistance, marking it as a strong horizontal level of confluence.
Now overlaps with the descending trendline, increasing its technical significance.
3. Major Support Zone (Lower Brown Rectangle)
Located around 1.03 – 1.05.
This is the area from which the price previously launched a strong upward movement, potentially marking a cyclical bottom.
Projected Scenario (Yellow Arrow)
Indicates a possible false breakout above the resistance area and trendline.
Suggests a structure of consolidation or distribution, where price may spike above key resistance but quickly retreat.
This could lead to a retracement back toward lower support, or act as a base before a real breakout develops.
RSI Indicator (Relative Strength Index)
Weekly RSI is currently in the overbought zone, near the 70 level.
The vertical dotted orange line aligns with previous RSI peaks (2017, 2018, 2021), each followed by major tops and corrections.
This pattern suggests that the market could again experience a local top and a retracement after this overbought signal.
Overall Interpretation
EUR/USD is currently at a critical technical zone, where:
A long-term trendline and a horizontal resistance intersect.
RSI signals a potential reversal point.
The most probable outcome (as indicated by the yellow arrow):
A short-lived breakout above resistance, followed by a bearish rejection and consolidation.
Alternatively, price could consolidate here before attempting a stronger breakout.

EURUSD: Local Bullish Bias! Long!
My dear friends,
Today we will analyse EURUSD together☺️
The price is near a wide key level
and the pair is approaching a significant decision level of 1.16045 Therefore, a strong bullish reaction here could determine the next move up.We will watch for a confirmation candle, and then target the next key level of 1.16229.Recommend Stop-loss is beyond the current level.
❤️Sending you lots of Love and Hugs❤️

EURUSD : Status @ 8/8Just a weekly update.
There is no change since status @ 1/8. Buyer still in control. Looking into the future, it seems buying interest is still strong.
No sign of the SELL signal yet. Will keep exercising patience and wait.
Good luck.

EURUSD BUYING CORRECTION AND SHORTThe price is now at a strong support level and if it can be a double bottom it will retest the descending channel line and reach the orange resistance, but in the general direction the price prefers to fall due to breaking the black uptrend line. We also have a more beautiful scenario, which is if it can break the strong support we will go with the downward trend.

EURUSD... This is it ?Almost recovered large part of the fall. Is this the start of a down trend market ?
What does macro say ? This is blurry as EU Zone as US Zone is....
I guess that BCE will start dovish, and Fed hawkish...

EuRUsD Downtrend continuation after pullback.EURUSD has seen considerable drop after massive gain through the year. Previous weeks downtrend is a clear directional significance for a pullback from all that gain. Looking forward to a continuation down in the following days... Please leave a like.
Usando cuenta Real (journal)August 4, I already have a real account, but I haven't used it for fear of losing...
Yes, I have used the demo account, and so far, things are going well. Obviously, it's a demo account, so it's not that scary.
On July 21, I started using the demo account as a real one and applied the 5 or 3 rule: (5) win, 0 (3) lose, whichever comes first. And that's the trade of the day, no matter what.
I started with 10, raised it to 38, but now it's at 28.
Today I didn't enter, and yesterday I went from -3 and +3.
I'm using MA (EMA 50), MA (SMA 3) on the chart, and in addition, Stoch Oscillator (5, 3, 3), RSI (7).
And I always use EURUSD OTC in 1 minute, trading at $1 per trade to start.
EURUSD trading range. Top-bottom trading strategy✏️ OANDA:EURUSD surged after Nonfarm data. Formed a wide trading range bounded by 2 trendlines. The market needs more momentum to break out of the range. If there is confirmation at the upper and lower bands, it is a top-bottom trading signal for this pair.
📉 Key Levels
SELL trigger: reject resistance 1.175
BUY trigger: reject support 1.145
Leave your comments on the idea. I am happy to read your views.

A sell on EURUSD #EURUSD has shown that the liquidity laws still works. While it may seem as a bullish market, it is actually a liquidity grab which serves as weekly FVG and bearish OB, also bearish OTE. Don't get trapped in buys.
ASX:EUR will sell this week.
@SAForexedu We learn to earn.
