Euro takes a hit as trade deal with the US sparks a market rallyTrading this week kicked off with a trade agreement between the United States and the European Union, which pushed both the US and European indices to open in the green.
However, this development had a negative impact on the euro, which is experiencing a significant decline during today's session, Monday, July 28, 2025. Meanwhile, the US dollar is making a strong comeback, rising by 0.60% ahead of the US session open.
This recent decline has reversed the euro’s upward trend that it had maintained since the beginning of this month. The EUR/USD pair dropped again, hitting a new low below the 1.17110 level, which represents the last lower high of the bullish trend.
What is the likely upcoming scenario?
A price increase for the pair to the 1.17635 level would be considered a corrective move within the ongoing bearish trend. The negative outlook would not change unless the price records a higher high above the 1.17889 level on the 4-hour timeframe.
However, the EUR/USD is heading into an important week filled with key economic data and news, particularly from the US. This includes the US Non-Farm Payrolls set to be released on Friday, August 1, 2025, and the Federal Reserve meeting on Wednesday, July 30, 2025. The later will cover interest rate decisions and upcoming economic projections. The outcomes of these events are expected to have a direct impact on both the US dollar and the EUR/USD pair.
EURUSD trade ideas

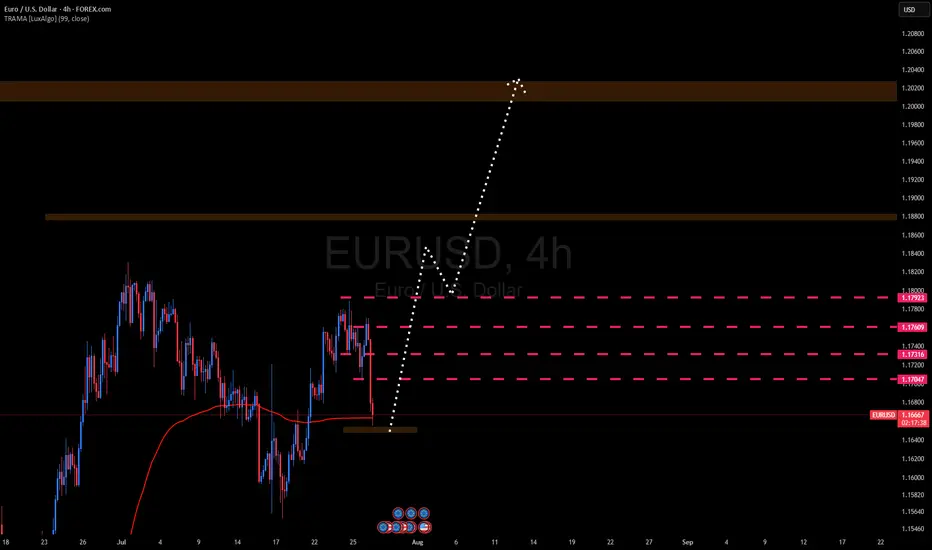
EURUSD BULLISH TREND 28-15 JUL-2025EUR/USD is expected to enter a bullish phase, with an upward move likely to start from the 1.16557–1.16486 range. The pair is projected to rise throughout the week, potentially reaching the 1.20051–1.20200 levels. As long as it continues toward that zone, the trend remains bullish

EURUSD GOING SHORT AFTER A PULL BACKPrice has completed a corrective pullback into a well-defined supply zone, where it has now mitigated previous unfilled sell orders. We’re seeing early signs of bearish intent and anticipate a continuation to the downside as supply takes control.
💡 Key Notes:
• Trend is bearish unless price closes above the mitigated supply zone.
• If price returns to the supply zone without breaking lower, it may become a distribution range.
• Patience and confirmation are critical — no need to rush entry without market structure break.
Let me know your thoughts

SHORT TRADE PLAN (LIVE REVERSAL SETUP)🔻SHORT TRADE PLAN (LIVE REVERSAL SETUP)
🔹 Entry: 1.1665
🔹 Stop Loss: 1.1800 (Brick 18 reclaim = hard invalidation)
🔹 Risk: 135 pips
🔹 Style: Macro Renko reversal — Brick 17 collapse, now short inside Brick 16
🔹 Bias: Downtrend targeting full structure rotation and fib reversion
⸻
🧠 WHY THIS SHORT?
• ❌ Bullish structure invalidated: H4 candle closed beneath 1.1700, violating Brick 17
• 🧱 Renko breakdown confirmed: Price now actively trading inside Brick 16 (1.1600–1.1700)
• 🧬 Momentum flipped: Largest bearish candle in weeks signals shift in institutional control
• 📉 No support until 1.1500–1.1400 → multiple clean Renko bricks below = high velocity window
• 🧲 Macro magnet pull: 1.1000 is full cycle reversion zone — untouched since last major fib reset
• 🔐 Longs are trapped under Fib 100 → sentiment rotated hard → fade is now the high-probability play
⸻
🎯 SHORT TARGET LADDER (100 PIP BRICKS)
TP1 — 1.1500 📉
〰️ Brick 14 confirm — early exit zone
+165 pips | R:R 1.22:1
TP2 — 1.1400 🔻
〰️ Brick 13 confirmation — structural break builds
+265 pips | R:R 1.96:1
TP3 — 1.1300 📉
〰️ D1 structural pivot — macro memory zone
+365 pips | R:R 2.70:1
TP4 — 1.1200 📉
〰️ Fib 0.0 / round number test
+465 pips | R:R 3.44:1
TP5 — 1.1100 📉
〰️ Trend extension base
+565 pips | R:R 4.18:1
TP6 — 1.1000 🧲
〰️ Full macro cycle alignment
+665 pips | R:R 4.92:1
TP7 — 1.0900 🪤
〰️ Trap zone for blowout shorts
+765 pips | R:R 5.66:1
TP8 — 1.0800 🧠
〰️ Max extension pressure
+865 pips | R:R 6.40:1
TP9 — 1.0700 🏁
〰️ Renko structure finality zone
+965 pips | R:R 7.14:1
TP10 — 1.0600 🌀
〰️ Overshoot runner — hold only 10–15%
+1065 pips | R:R 7.89:1
⸻
⚙️ EXECUTION RULES
• SL → locked at 1.1800 (only full Brick 18 reclaim = exit)
• Move SL to BE after TP2 hits
• Begin 1-brick trailing after TP3
• Book 70–80% of size by TP6
• Only hold runners beyond TP7–TP10 if Renko bricks remain unbroken
📛 Long bias is off — no reentry until Brick 17 is reclaimed on Renko
🟠 Optional new short entries on bounce into 1.1685–1.1700

EURUSD Massive Long! BUY!
My dear friends,
EURUSD looks like it will make a good move, and here are the details:
The market is trading on 1.1665 pivot level.
Bias - Bullish
Technical Indicators: Supper Trend generates a clear long signal while Pivot Point HL is currently determining the overall Bullish trend of the market.
Goal - 1.1728
About Used Indicators:
Pivot points are a great way to identify areas of support and resistance, but they work best when combined with other kinds of technical analysis
Disclosure: I am part of Trade Nation's Influencer program and receive a monthly fee for using their TradingView charts in my analysis.
———————————
WISH YOU ALL LUCK

EURUSD: A New Possibility On The Horizon!!Following my previous post just a few minutes ago, I’ve observed that price may retrace deeper into the 4H supply zone, which could invalidate our earlier bearish setup. This shift is due to visible signs of uncollected liquidity still resting above the current price.
If price continues its rally to the upside, we’ll shift bias and look for potential opportunities to ride the bullish move instead. Losses are part of the game, guys—but no worries, my sell entries are already secured✌️😂.
Stay sharp and stay active, traders. Let’s see how price unfolds from here. Follow for more updates. See you on the next one. ⚔️📊

EUR/USD | Moving bullish Why Is EUR/USD Always Moving?
Ever asked yourself, "Why does the Euro rise or fall against the Dollar?" 💡
It’s not magic – it’s all about money flow, news, and market mood.
📉 When traders feel unsure, they might sell the Euro.
📈 When Europe’s economy looks strong, the Euro can fly!
Right now, we’re watching some key price zones 👀:
Breakout above 1.17485 could push us to 1.18792 🚀
Drop below 1.17038 might take us lower 📉

EURUSD LOSSES BULLISH MOMENTUM. WHERE TO GO?EURUSD LOSSES BULLISH MOMENTUM. WHERE TO GO?
The asset didn't reach the local resistance of 1.18300 and started to consolidate before reaching this level. RSI shows weakness of the impulse on 4-h chart, as well as MACD is in the red zone. Therefore, we expect the price to slowly decline towards local trendline, where SMA200 is situated.

Europe and the US Sign Trade Agreement, EUR/USD DeclinesEurope and the US Sign Trade Agreement, EUR/USD Declines
The past weekend was marked by the official signing of a trade agreement between the United States and Europe, as announced by US President Donald Trump and President of the European Commission Ursula von der Leyen following their meeting in Scotland.
According to reports, the agreement is based on a 15% baseline tariff on goods exported from Europe to the United States, with certain exemptions. As previously reported, a trade agreement with a 15% baseline tariff had earlier been concluded between the US and Japan.
According to President Trump:
→ under no circumstances did he allow the baseline tariff for Europe to fall below 15%;
→ the European Union committed to investing in the US economy, purchasing weapons, and importing energy resources.
The financial markets’ reaction to this news is noteworthy:
→ European stock indices opened the week with a bullish gap, reflecting relief that previously feared tariffs of up to 30% did not materialise;
→ the EUR/USD pair is exhibiting bearish momentum this morning.
Technical Analysis of the EUR/USD Chart
As indicated by the black arrow, bearish sentiment intensified on Monday morning, pushing the pair towards the 1.1700 level, which had previously acted as resistance in mid-July.
From the perspective of the ascending channel (shown in blue), its median line is currently acting as a resistance level – following contact with it, a short-term rally was broken (highlighted in purple). This reinforces the notion that bears are currently in control.
Given the above, we could suggest that, should bearish sentiment persist on the EUR/USD chart, we may soon witness an attempt to break through the 1.1700 support level. A successful breach could open the path for further downside movement of the euro against the dollar, towards the lower boundary of the channel.
This article represents the opinion of the Companies operating under the FXOpen brand only. It is not to be construed as an offer, solicitation, or recommendation with respect to products and services provided by the Companies operating under the FXOpen brand, nor is it to be considered financial advice.

EURUSD Did Not Like the EU–US DealThe heavily one-sided EU–US deal has put negative pressure on EURUSD. Ahead of a crucial week filled with major events, including GDP data from both the Eurozone and the US, the PCE report, payrolls, and meetings from the FOMC and BOJ, EURUSD has broken a short-term head and shoulders formation. The pattern's target is near 1.1610.
A retest of the broken support is possible and could even extend to 1.1725. However, unless sentiment changes due to some news, this move may offer only a selling opportunity. The downward trend could also continue without pause.
Options market activity suggests that the 1.16 to 1.18 range is viewed as a "safe zone," with large players likely aiming to keep EURUSD within this band for the week. If the head and shoulders target is reached, EURUSD might stabilize and bounce around the 1.16 level.

DeGRAM | EURUSD is correcting from the channel boundary📊 Technical Analysis
● A second rejection at the upper channel/1.1780 supply (red arrows) signals overextension; price is retracing toward the mid-July demand cluster where the rising-channel floor and prior swing base intersect near 1.1600.
● Momentum remains positive on higher-time-frame: each pull-back since May has held the channel support, and the current decline is unfolding as a corrective ABC that projects into 1.1585-1.1620 — a historically bid zone.
💡 Fundamental Analysis
● Softer US Q2-GDP deflator cooled 2-yr yields, while July Euro-area CPI flash is expected to stay sticky, trimming the Fed–ECB policy gap and limiting EUR downside.
✨ Summary
Buy 1.1585-1.1620; hold above 1.1594 targets 1.1687 → 1.1780. Long view invalidated on an H4 close below 1.1530.
-------------------
Share your opinion in the comments and support the idea with a like. Thanks for your support!

EURUSD - Break of support?In this moment we have a potential distribution of volume with a potential break of dinamic support we can have a deep rebound until area 1.14

EURUSD EURUSD is on an exhaustion trend after a long buy, taking a sell correctional move. The market objective yet to be fulfilled, we continue the sells the the objective is fulfilled. Having a valid sell structure that lead to a break of structure, having a structural liquidity making the low a protected low. Looking to take a sell from the supply zone(strong low) and target the weak high

Short Term Market Reversal IncomingRetail’s still buying breakouts, but the music just stopped.
This was the rally they weren’t supposed to catch.
Now it’s time to flip the script and bleed it back to origin.
Trading is a very difficult profession. Most people fail, but it's also not impossible. If you don't trade you're a loser.
It's a zero-sum game. 0 1
Zero-sum game is a mathematical representation in game theory and economic theory of a situation that involves two competing entities, where the result is an advantage for one side and an equivalent loss for the other.
It's all just digits on a screen and if they want your money they'll take your money, so you gotta respect your risk management if you don't want to lose everything or you'll have to break the matrix by seeing into the future,
Once you get to see the future. THERE IS NO TURNING BACK.
If you're reading this I hope you're having a great year. This year is all about endings and new beginnings. So stay locked in.
WAGMI
Oh yeah don't forget I gave you guys FX_IDC:EURUSD at 1.03 and FX_IDC:XAGUSD at $22
Nerds

Will the Euro collapse on US Tariffs? Traders eye 1.15The EURUSD is under pressure today, dropping nearly half a percent. This follows the new US–EU trade deal that introduces a 15 percent baseline import tariff on most goods. That means Americans buying European products must now pay 15 percent more.
Naturally, markets are adjusting. When one side of a trade deal takes the hit, its currency often weakens. In this case, the euro is sliding as the cost of EU exports rises. If the euro were to fall by the full 15 percent in response, we could see EURUSD drop to parity again. That would balance the new cost for American buyers, making European goods just as affordable as before.
Still, the technical outlook remains neutral. The trend on EURUSD remains bullish until a break below 1.15 occurs. If that happens, it could open the door to 1.12 or even 1.10. Until then, traders watching the chart may stay cautious.
One reason why the EURUSD might gain is that President Trump continues to pressure the Federal Reserve to cut interest rates. If the Fed caves while inflation is still rising, the US could face the same issues that have plagued countries like Turkey, where political pressure has undermined monetary stability and triggered runaway inflation.
In that case, the euro might strengthen, pushing EURUSD back toward 1.20 or higher.
Is this the peak for EURUSD or just a pause before the next leg higher? The next few weeks will reveal the answer.
This content is not directed to residents of the EU or UK. Any opinions, news, research, analyses, prices or other information contained on this website is provided as general market commentary and does not constitute investment advice. ThinkMarkets will not accept liability for any loss or damage including, without limitation, to any loss of profit which may arise directly or indirectly from use of or reliance on such information.

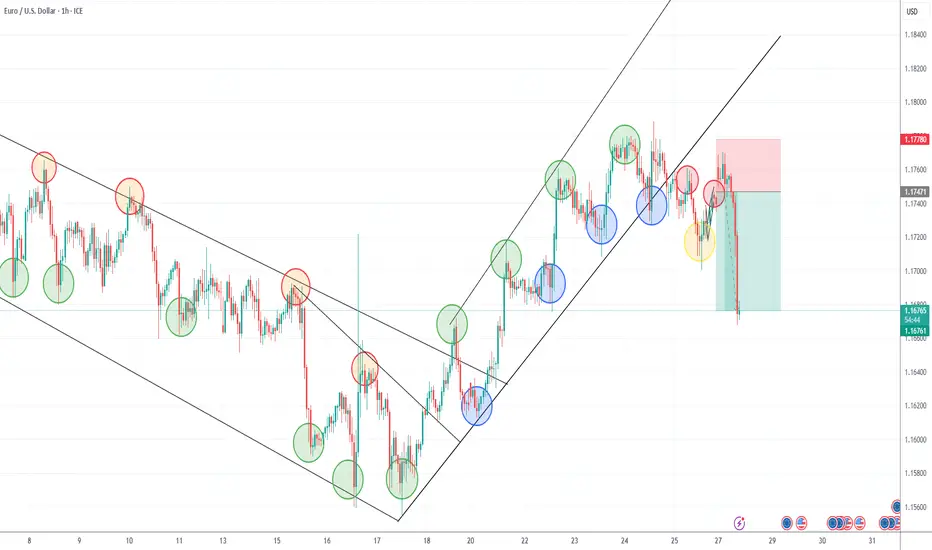
EUR/USD Channel Breakout to Trend Reversal – Clean RR SetupPrice was moving in a descending channel with clear lower highs and lower lows. After a breakout and retest, I entered long during the bullish structure shift. The uptrend held until resistance, where reversal signs appeared. I took a short position based on lower high confirmation. Trade hit TP successfully with clean price action respecting structure.
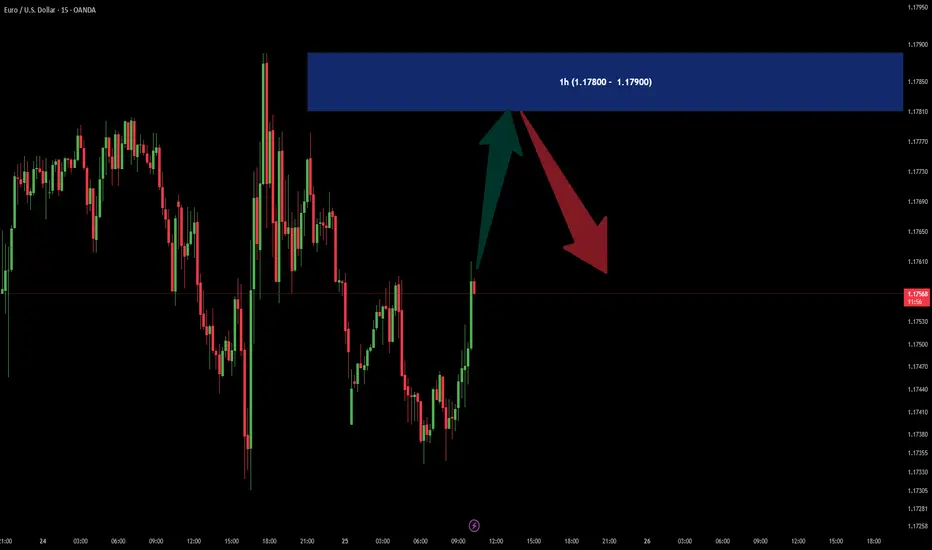
EURUSD SELL OFFERIn 1h time frame there is a SUPPLY area in (1.17800 - 1.17900) price zone.
It could be good for a SELL scalpers.
Lingrid | EURUSD Drops from 1.18000 RESISTANCE. Possible ShortFX:EURUSD is showing strong rejection at the resistance zone near 1.1790 after multiple fake breaks and failed attempts to sustain above the key level. Price has now broken below the mid-range and is forming a bearish rejection pattern right at the edge of the breakout area. With bearish momentum accelerating and a move toward 1.1620 support appears likely. Breakdown from the consolidation channel favors trend continuation to the downside.
📉 Key Levels
Sell trigger: Breakdown below 1.1660
Sell zone: 1.1700 – 1.1730
Target: 1.1620
Invalidation: Break above 1.1750
💡 Risks
Sudden bullish engulfing near 1.1670 could negate the breakdown
Support at 1.1620 may trigger a bounce
US macro data could shift trend dynamics mid-move
If this idea resonates with you or you have your own opinion, traders, hit the comments. I’m excited to read your thoughts!

EUR USD LONG RESULT Price had formed a minor flag pattern after holding the Major Support Trendline and expected price to bounce higher at the resistance Trendline and support zone confluence, which it did.
But I extended TP higher than the supply zone, so price reversed and closed at BE.
Better Setups To Come 💪
_THE_KLASSIC_TRADER_.🔥

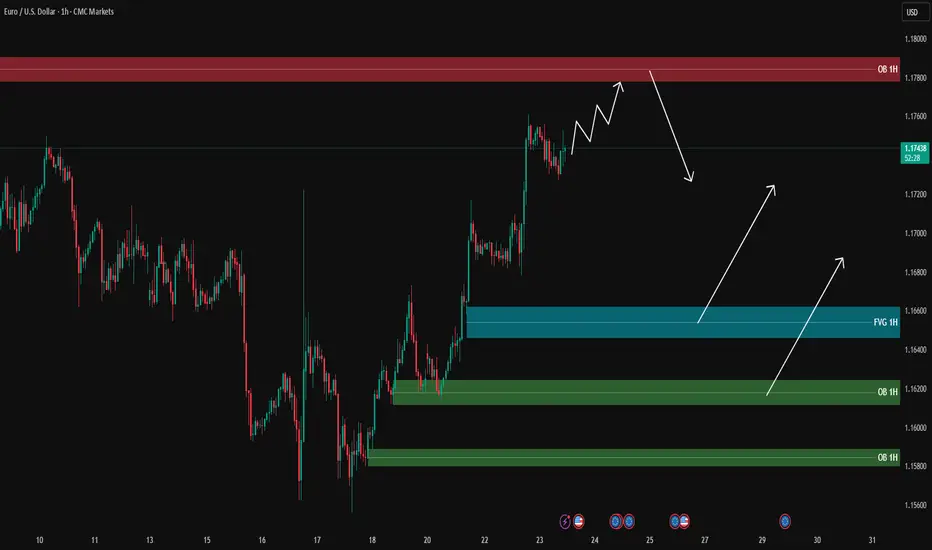
EURUSD analysis - 1H FVG and OB setupsOn the 1H timeframe, price is moving strongly towards the 1H supply zone (around 1.1780), and it is likely to reach this area first before pulling back.
During the pullback, the blue FVG and green OB zones below are key areas for potential long entries:
🔹 FVG 1H around 1.1660
🔹 OB 1H around 1.1620
🔹 OB 1H around 1.1580
📌 Plan:
1️⃣ If the price reaches the upper supply zone, we will look for short scalps with confirmation on the lower timeframe (5M/3M).
2️⃣ After the pullback to lower zones, we will look for long opportunities with PA confirmation.
🎯 Long targets after pullback: 1.1700 – 1.1720, potentially 1.1750.
❌ No entry without confirmation.
Not looking good for the dollarRising wedge broken on the long term chart, EUR will probably keep strengthening

Eurousd techinical analysis.Eurousd techinical analysis next move posibale at h1 time frame.not finchinal advice.
