Eurousd techinical analysis.Eurousd techinical analysis next move posibale at h1 time frame.not finchinal advice.
EURUSD trade ideas

EURUSD Outlook – July 27, 2025This week, the EU is set to release key economic data, including GDP figures.
Given the recent U.S. tariff pressure, there’s a strong chance that these numbers will come in weak — weighing further on the euro.
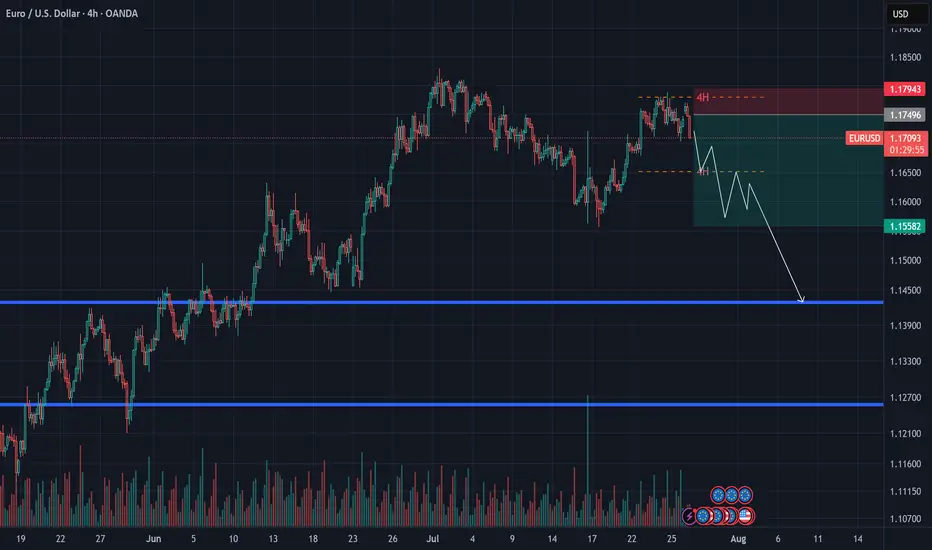
📉 After bouncing from the 1.15 level, EURUSD entered a corrective move, but even with extended consolidation, it failed to reach the previous high — a sign of growing exhaustion.
📌 Price action suggests a lack of bullish momentum, and candles are reflecting market fatigue.
🔁 I expect the euro to enter a mid-term corrective phase, potentially heading back toward the 1.13 zone.
🎯 A short entry below 1.18 could offer a favorable risk-reward setup.
EUR/USD Bearish Reversal SetupEUR/USD is forming a head and shoulders pattern with bearish divergence, indicating a potential price drop. A sell below the neckline confirms the breakout of the last higher low.

28.07.25 Morning ForecastPairs on Watch -
FX:EURCAD
FX:GBPUSD
OANDA:XAUUSD
FX:EURUSD
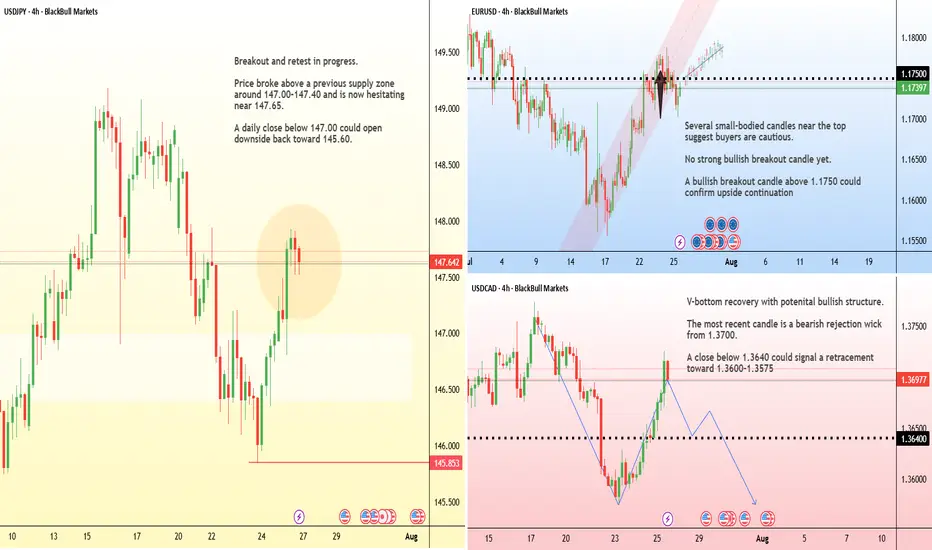
A short overview of the instruments I am looking at for today, multi-timeframe analysis down to what I will be looking at for an entry. Enjoy!

EURUSD RetestEURUSD is currently going for a retest since its in a uptrend , its going to test zone 1.16648 before it continues to go up plus there some FED news that will be coming this will also shift the markets . lets keep a kin eye

LONG TRADE PLAN (RENKO STRUCTURE)
🧱 LONG TRADE PLAN (RENKO STRUCTURE)
🔹 Entry: 1.1740
🔹 SL: 1.1690 (50 pip risk)
🔹 Style: 100-pip Renko Target Ladder
🔹 Bias: Macro uptrend forming — targeting Fib 100 and above
⸻
🎯 TARGET LADDER + STRATEGIC WHY
TP1 — 1.1800 📈
〰️ Brick 18 confirm — breakout ignition point
+60 pips | R:R 1.2:1
TP2 — 1.1900 💰
〰️ Mid-run exit — early profit-taker zone
+160 pips | R:R 3.2:1
TP3 — 1.2000 🧲
〰️ Full Fib 100 — magnet + reversal hotspot
+260 pips | R:R 5.2:1
TP4 — 1.2100 🚀
〰️ Post-Fib breakout — trap zone for late shorts
+360 pips | R:R 7.2:1
TP5 — 1.2200 🔄
〰️ Minor stall zone — profit lock-in level
+460 pips | R:R 9.2:1
TP6 — 1.2300 🔥
〰️ Thin continuation — extension in motion
+560 pips | R:R 11.2:1
TP7 — 1.2400 ⚠️
〰️ Trend exhaustion zone — monitor Renko structure
+660 pips | R:R 13.2:1
TP8 — 1.2500 🧠
〰️ Round number + gamma cluster — exit partials
+760 pips | R:R 15.2:1
TP9 — 1.2600 🪤
〰️ Liquidity sweep — trap and fade zone
+860 pips | R:R 17.2:1
TP10 — 1.2700 🏁
〰️ Full cycle climax — final high probability exit
+960 pips | R:R 19.2:1
⸻
🧠 Plan:
• Go 50% at 1.1740, scale 50% after 1.1800 confirm
• SL to BE after TP2
• Trail by 1 Renko brick after TP3
• Exit final ladder by TP8–TP10 unless macro reasserts
🔐 Invalidation: Close below 1.1700 = full reset

EUR/USD – Testing Premium Zone, ECB & USD Macro Drive Next MoveEUR/USD – Testing Premium Zone, ECB & USD Macro Drive Next Move
EUR/USD is consolidating near 1.1770–1.1780, right inside the premium liquidity zone (0.786–0.886 Fib) and just below the Weak High at 1.1830. This level is critical for the next directional move.
Macro Landscape
ECB paused at 2.0% after eight consecutive cuts but may ease again in late 2025 as inflation trends toward 1.4% (ECB, 2025).
USD remains under pressure on expectations of Fed cuts, high fiscal deficits, and tariff concerns, creating a medium-term bias toward EUR strength (Reuters, 2025).
EU–U.S. trade deal at 15% tariff base reduces downside risks but does not fully remove growth headwinds (OECD, 2025).
Technical Outlook
Key Resistance: 1.1780–1.1830 (premium zone).
Upside Targets: 1.1905 (N) and 1.2085 (V) on breakout.
Support: 1.1680–1.1630 (Cloud/Kijun) and 1.1500 pivot for mean reversion.
VolanX DSS Signal:
Score: 58/100 (Neutral-to-Bullish)
Trend remains constructive but premium levels suggest a possible pullback unless the pair clears 1.1835 with momentum.
Plan:
Watch for a fade setup at 1.178–1.183 with stops >1.184.
A confirmed breakout above 1.1835 opens a run toward 1.19–1.21.
#EURUSD #Forex #MacroStrategy #ECB #CurrencyMarkets #TradingView
For educational purposes only. Not financial advice.

Important week for EURUSDOn Friday, EURUSD reached a support level and bounced off it.
This week, all eyes are on the Fed's interest rate decision on Wednesday and the U.S. jobs data on Friday.
The trend remains bullish for now, and the upcoming news will likely determine the next move.
Today and tomorrow, the market may stay in a range as traders wait for the key events.
Don't rush into new trades and avoid using large position sizes!

$EURUSDTrade Idea: EUR/USD – Short Position Opportunity We are $EURUSDTrade Idea: EUR/USD – Short Position Opportunity
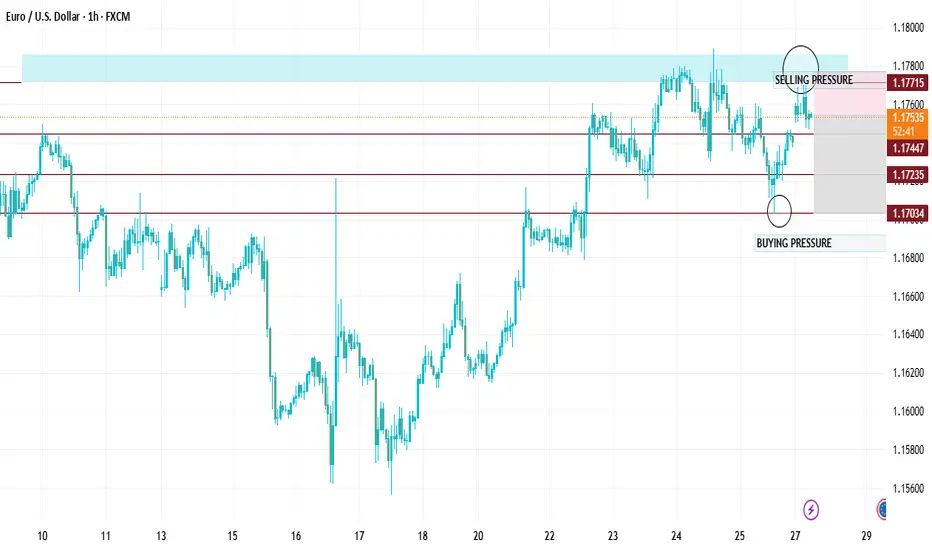
We are currently observing a EUR/USD selling opportunity.
📌 Entry Zone: 1.17539
This level presents a favorable point to initiate a short (sell) position, based on current market structure and momentum indicators.
🎯 Target 1: 1.17300
🎯 Target 2: 1.17200
🎯 Target 3: 1.17150
These targets are based on key support levels and recent price action. The pair is showing signs of downward pressure, which may push the price toward these levels.
🛑 Stop Loss: 1.17920
This stop loss is placed just above recent resistance to protect against unexpected reversals or volatility spikes.
EURUSD InsightWelcome, everyone.
Please share your personal opinions in the comments. Don’t forget to hit the boost and subscribe buttons.
Key Points
- The U.S. and the EU have reached a trade agreement to impose a 15% tariff on EU goods, including automobiles. However, President Trump stated that pharmaceuticals, steel, and aluminum would be exempt from the 15% tariff. Both sides also agreed to mutually waive tariffs on "strategic items" such as aircraft and semiconductor equipment. Additionally, the EU has agreed to purchase $750 billion worth of U.S. energy and to invest an additional $600 billion in the U.S.
- High-level trade talks between the U.S. and China will be held on July 28–29, with the market expecting an extension of the current trade truce.
- Ahead of the FOMC meeting scheduled for July 29, markets are projecting an interest rate cut more likely in September rather than July.
Key Economic Events This Week
+ July 29: U.S. Department of Labor JOLTS
+ July 30: Germany Q2 GDP, U.S. July ADP Non-Farm Employment Change, U.S. Q2 GDP, Bank of Canada interest rate decision, FOMC meeting outcome
+ July 31: Bank of Japan interest rate decision, Germany July CPI, U.S. June Core PCE Price Index
+ August 1: Eurozone July CPI, U.S. July Non-Farm Payrolls, U.S. July Unemployment Rate
EURUSD Chart Analysis
The pair is showing an upward trend after finding support near the 1.16000 level. However, with resistance at the 1.18000 level—where the price previously faced rejection—the overall bias still appears bearish. That said, a breakout above this resistance line could signal a continuation of the uptrend, warranting close monitoring. For now, the outlook remains bearish toward the 1.15000 level. Should a breakout be confirmed, we will promptly revise our strategy.

EURUSD(20250728) Today's AnalysisMarket news:
Trump announced that the US and Europe reached a trade agreement: 15% tariffs on the EU, $600 billion in investment in the US, zero tariffs on the US by EU countries, the EU will purchase US military equipment, and will purchase US energy products worth $750 billion. However, the US and Europe have different opinions on whether the 15% tariff agreement covers medicines and steel and aluminum. Von der Leyen: 15% tariff rate is the best result that the European Commission can achieve.
US Secretary of Commerce: The deadline for tariff increase on August 1 will not be extended. The United States will determine the tariff policy on chips within two weeks.
Technical analysis:
Today's buying and selling boundaries:
1.1735
Support and resistance levels:
1.1792
1.1771
1.1757
1.1712
1.1698
1.1677
Trading strategy:
If the price breaks through 1.1757, consider buying, the first target price is 1.1771
If the price breaks through 1.1735, consider selling, the first target price is 1.1712

SELL EURUSD for bullish trend reversal SELL EURUSD for bullish trend reversal
STOP LOSS : 1.1808
Trade trade is based on false breakout and divergence.....
First what is false breakout, A false breakout in Forex occurs when the price breaks through a key level (like support or resistance) but quickly reverses and returns to its original range, often trapping traders who were expecting a continuation of the breakout. It's essentially a false signal, indicating a potential trend reversal or continuation, but the price doesn't follow through....
Secondly what is divergence ,In forex trading, divergence occurs when the price of a currency pair moves in one direction, while a technical indicator (like an oscillator) moves in the opposite direction. This mismatch can signal a potential trend reversal or weakening trend. There are two main types: bullish and bearish divergence.
On this trade we are taking it because we saw regular bearish divergence
Regular Bearish Divergence
In case of Regular Bearish Divergence:
* The Indicator shows Lower Highs
* Actual Market Price shows Higher Highs
We can see a strong divergence on the RSI already and There is a strong trend reversal on the daily time frame chart.....
The daily time frame is showing strength of trend reversal from this level resistance so we are looking for the trend reversal and correction push from here .....

SELL BTCUSD for bullish trend reversal STOP LOSS : 122,500 SELL EURUSD for bullish trend reversal
STOP LOSS : 1.1808
Trade trade is based on false breakout and divergence.....
First what is false breakout, A false breakout in Forex occurs when the price breaks through a key level (like support or resistance) but quickly reverses and returns to its original range, often trapping traders who were expecting a continuation of the breakout. It's essentially a false signal, indicating a potential trend reversal or continuation, but the price doesn't follow through....
Secondly what is divergence ,In forex trading, divergence occurs when the price of a currency pair moves in one direction, while a technical indicator (like an oscillator) moves in the opposite direction. This mismatch can signal a potential trend reversal or weakening trend. There are two main types: bullish and bearish divergence.
On this trade we are taking it because we saw regular bearish divergence
Regular Bearish Divergence
In case of Regular Bearish Divergence:
* The Indicator shows Lower Highs
* Actual Market Price shows Higher Highs
We can see a strong divergence on the RSI already and There is a strong trend reversal on the daily time frame chart.....
The daily time frame is showing strength of trend reversal from this level resistance so we are looking for the trend reversal and correction push from here .....

Bullish momentum to extend?The Fiber (EUR/USD) is falling towards the pivot, which acts as an overlap support and could rise to the 1st resistance, which has been identified as a swing high resistance.
Pivot: 1.1588
1st Support: 1.1447
1st Resistance: 1.1817
Risk Warning:
Trading Forex and CFDs carries a high level of risk to your capital and you should only trade with money you can afford to lose. Trading Forex and CFDs may not be suitable for all investors, so please ensure that you fully understand the risks involved and seek independent advice if necessary.
Disclaimer:
The above opinions given constitute general market commentary, and do not constitute the opinion or advice of IC Markets or any form of personal or investment advice.
Any opinions, news, research, analyses, prices, other information, or links to third-party sites contained on this website are provided on an "as-is" basis, are intended only to be informative, is not an advice nor a recommendation, nor research, or a record of our trading prices, or an offer of, or solicitation for a transaction in any financial instrument and thus should not be treated as such. The information provided does not involve any specific investment objectives, financial situation and needs of any specific person who may receive it. Please be aware, that past performance is not a reliable indicator of future performance and/or results. Past Performance or Forward-looking scenarios based upon the reasonable beliefs of the third-party provider are not a guarantee of future performance. Actual results may differ materially from those anticipated in forward-looking or past performance statements. IC Markets makes no representation or warranty and assumes no liability as to the accuracy or completeness of the information provided, nor any loss arising from any investment based on a recommendation, forecast or any information supplied by any third-party.

EURUSD will push higher toward month endBased on price action last Friday and early Monday movement,
I foresee market will retest highest mark at 1.182++.
calculate your own risk & reward.
Good Luck

EURUSD SHORT IDEAIm looking for short positions on EUR/USD. Since Price Currently in a significant key level and swept the previous day high and previous day asian high . Also the candlestick was closed in engulfing in m15 and m30 which indicate there is seller in the market . All the best adios 🙏

A POTENTIAL TREND REVERSAL Hello Traders 👋
What are your views about EURUSD
Looking at the daily timeframe we can see that price action didn't take out liquidity at the top which is indicated with a blue rectangle.
Am seeing price action retracing to that liquidity zone which is indicated with a blue rectangle and from there reversing to the downside.
Let's look at the fundamental analysis of EURUSD.
Trump announced the conclusion of a trade agreement with the EU:
The EU will invest $600 billion more in the US than before
15% tariff on EU goods, including cars
All EU countries will open their markets to the US
EU to purchase hundreds of billions of dollars worth of military equipment
EU to purchase $750 billion worth of energy from the US. Energy is a key part of the agreement.
PS:
It is worth monitoring the market reaction from the opening. Pay attention to the market reaction during different sessions.
Markets may react ambiguously, but against the general backdrop, the following reaction should be expected:
USD → sharp rise (dollar strengthening due to capital inflows and growth in energy exports).
EUR → down, as the EU will bear the costs of tariffs and rising imports from the US.
Gold → down (correction or decline due to the strengthening of the dollar and reduced demand for hedging).
BTC → neutral or slight decline (due to USD strength):
If the agreement stimulates the economy and liquidity, this could be a bullish factor for BTC.
………………………………………….

EURUSD End July BearsEURUSD will short this week and continue selling into AUGUST. A double top pattern on the daily chart confirms this trade. We sell from Wednesday.

A POTENTIAL TREND REVERSAL Hello Traders 👋
What are your thoughts on EURUSD
Looking at the daily timeframe we can see that price action didn't take out the liquidity which is located with a blue rectangle which is also acting as the all-time high for EURUSD.
I'm seeing price retracing to reach the liquidity around that blue rectangle and then after start falling downwards.
Let's look at the fundamentals of EURUSD
Trump announced the conclusion of a trade agreement with the EU:
The EU will invest $600 billion more in the US than before
15% tariff on EU goods, including cars
All EU countries will open their markets to the US
EU to purchase hundreds of billions of dollars worth of military equipment
EU to purchase $750 billion worth of energy from the US. Energy is a key part of the agreement.
PS:
It is worth monitoring the market reaction from the opening. Pay attention to the market reaction during different sessions.
Markets may react ambiguously, but against the general backdrop, the following reaction should be expected:
USD → sharp rise (dollar strengthening due to capital inflows and growth in energy exports).
EUR → down, as the EU will bear the costs of tariffs and rising imports from the US.
Gold → down (correction or decline due to the strengthening of the dollar and reduced demand for hedging).
BTC → neutral or slight decline (due to USD strength):
If the agreement stimulates the economy and liquidity, this could be a bullish factor for BTC.
………………………………………….


EURUSD| Bullish Bias - Refined OB Play into ContinuationPair: EURUSD
Bias: Bullish
HTF Overview (4H):
Bullish structure remains intact — recent break to the upside was followed by a healthy pullback. Now price is continuing the push toward external 4H highs.
LTF Confirmation (30M):
Structure refined from last week. Price recently mitigated a 30M demand OB and is now showing signs of continuation. Watching for clean 5M shift to confirm the next leg.
Entry Zone: 5M CHoCH flip followed by pullback into demand zone
Targets: 30M highs, then extended target at 4H highs
Mindset Note: Keeping it clean and reactive. No guessing — I’m tracking Smart Money flow, structure shift, and waiting on my cue.

Markets face a PACKED schedule this weekThe tariff truce between the U.S. and several major trading partners is set to expire on August 1 . A deal with Japan has already been reached, but talks with the EU, Canada, and Mexico remain active.
In monetary policy, the Federal Reserve is widely expected to hold rates steady at 4.5% during its midweek meeting .
Across the border, the Bank of Canada is also expected to leave its interest rate unchanged at 2.75% . After cutting rates twice earlier this year, the BoC is seen as entering a wait-and-see phase.
In Asia, the Bank of Japan will announce its decision on Wednesday . While the BoJ isn’t expected to hike this month, recent U.S.–Japan trade progress has opened the door for policy tightening later this year.
Finally, the week concludes with the U.S. Non-Farm Payrolls report on Friday. Economists expect job gains of around 110,000 in July, down from 147,000 in June.
EURUSD – Channel Forming at Trend Top?EURUSD remains bullish but is showing signs of topping out, possibly forming a downward channel. We’re eyeing a mid-channel entry near a weekly gap, looking for one more push higher before a potential reversal. Key levels could form a double top – a breakout or rejection here will be telling.
