EU possible buy idea?7 days ago, I shared a bullish idea that remains valid despite price failing to hold above 1.04321.
Current Market Analysis:
Price appears to be forming an Elliot Wave 2 (a-b-c) correction.
Key Levels to Watch:
- 38.2% Fibonacci retracement level (minimum required for Wave 2)
- 88.7% Fibonacci retracement level (maximum allowed for Wave 2 to maintain bullish bias)
Trade Plan:
With my initial position at break-even, I'll employ dollar-cost averaging for additional buys targeting 1.065 :
1. 50% Fibonacci retracement level
2. 61.8% Fibonacci retracement level
3. 78.6% Fibonacci retracement level
Stop Loss: 1.017
This is not a financial advice but if you must take the trade, apply proper risk and money management while scaling into the trade.
EURUSD trade ideas

Xmoon Indicator Tutorial – Part 1 – Strategy🔻🔻🔻+ Persian version below🔻🔻🔻
📘 Xmoon Indicator Tutorial – Part 1
🎯 3Push Divergence RSI Strategy
🔥 The core of the Xmoon indicator
is built upon one of the most powerful strategies in technical analysis:
The advanced 3Push Divergence RSI pattern
🔁 A pattern that typically appears at key market turning points.
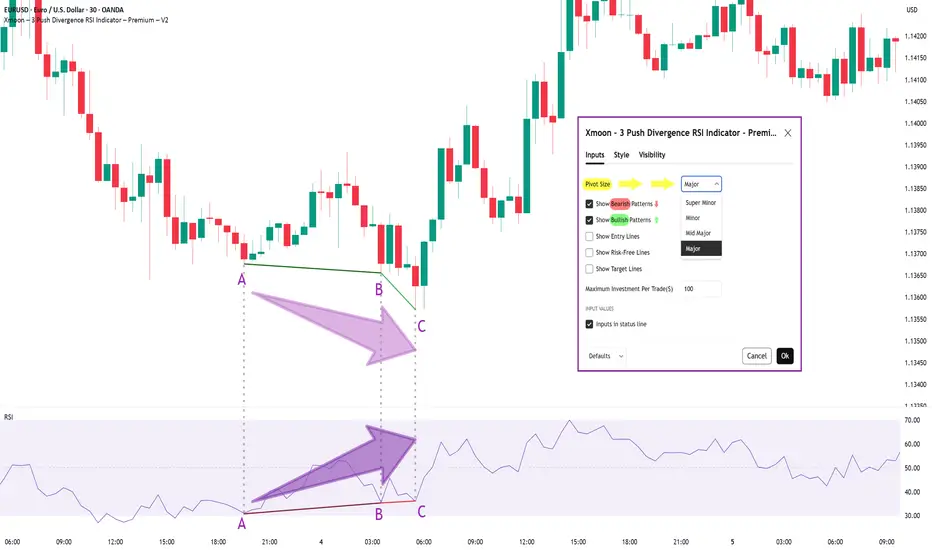
📉 When the price moves in the same direction three consecutive times on pivot points (e.g., making lower lows or higher highs), but the RSI shows the opposite behavior, it indicates a clear divergence !
💡 This divergence can act as a strong signal for a potential trend reversal.
🎯 The Xmoon Indicator is designed to detect this critical moment.
⚙️ Xmoon Indicator Settings Panel
The Xmoon settings panel offers the following options:
🔸 Pattern Type Selection: In the first and second lines, you can specify which type of pattern should be displayed: only bullish patterns or only bearish ones. You can also check both options.
🔸 Pivot Type Selection: From the dropdown menu, you can choose one of four pivot types:
“Super Minor”, “Minor”, “Mid-Major”, and “Major”, ordered from smallest to largest.
📌 Educational Note: The greater the distance (in candle count) between two lows or two highs, the larger the pivot is considered.
A Major Pivot is the largest among them.
✅ Larger Pivot = Higher Accuracy
❗ But naturally = Fewer Signals
📣 If you have any questions or need guidance, feel free to ask us. We’d be happy to help.
🔻🔻🔻بخش فارسی – Persian Section 🔻🔻🔻
📘 آموزش اندیکاتور ایکسمون - قسمت اول
🎯 استراتژی سهپوش واگرایی (3Push Divergence RSI)
🔥 هسته اصلی ایکسمون
بر پایه یکی از قویترین استراتژیهای تحلیل تکنیکال طراحی شده است
الگوی پیشرفته سهپوش واگرایی
🔁 الگویی که معمولاً در نقاط چرخش مهم بازار ظاهر میشود
📉 وقتی قیمت سه بار پشت سر هم روی نقاط پیوت ، در یک جهت حرکت میکند (مثلاً کفهای پایینتر یا سقفهای بالاتر میسازد) ، اما آر-اِس-آی خلاف آن را نشان میدهد، یعنی یک واگرایی آشکار رخ داده است
💡این واگرایی میتواند سیگنالی قوی برای برگشت روند باشد
🎯 اندیکاتور ایکسمون این لحظه را شناسایی میکند
⚙️ پنجره تنظیمات اندیکاتور ایکسمون
در بخش تنظیمات اندیکاتور ایکسمون، امکاناتی در اختیار شما قرار دارند
🔸 انتخاب نوع الگو: در خط اول و دوم میتوانید مشخص کنید چه نوع الگویی نمایش داده شود
فقط الگوهای صعودی یا فقط نزولی. همچنین می توانید تیک هر دو گزینه را بزنید
🔸 انتخاب نوع پیوتها: از پنجره کشویی بالا، می توانید یکی از ۴ نوع پیوت را انتخاب کنید
پیوت ها به ترتیب از کوچک به بزرگ عبارتند از: سوپر مینور ، مینور ، میدماژور و ماژور
📌 نکته آموزشی: هرچه فاصله بین دو کف یا دو سقف بیشتر باشد (یعنی تعداد کندلهای بین آنها زیادتر باشد)، آن پیوت، بزرگتر محسوب میشود
پیوت ماژور از بقیه بزرگ تر است
✅ پیوت بزرگتر = دقت بالاتر
❗ اما طبیعتاً = تعداد سیگنال کمتر
📣 اگر سوالی دارید یا نیاز به راهنمایی دارید، خوشحال میشویم از ما بپرسید
با کمال میل در خدمتتان هستیم
Smart Money Concepts (SMC) Strengths of the analysis:
1. Break of Structure (Choch + Bos)
A break of Structure (Bos) is clearly identified after s Choch, indicating the star of a new bearish structure.
2. OB 1H and FVG as an entry zone:
the price returns to a block order (OB-1H) within the resistance zone, which is an excellent institucional area to look for a short entry. Furthermore, the presence of a FVG on the 1H provides additional confluence.
3.Projection toward the last LL (Lower Low):
It is very accurate to project the bearish continuation toward the support zone, which coincides with the last LL, an area with a high probability of being mitigated.....

There are more entries and ways….🧠 Smart Traders Don’t Chase… They Wait for Confluence.
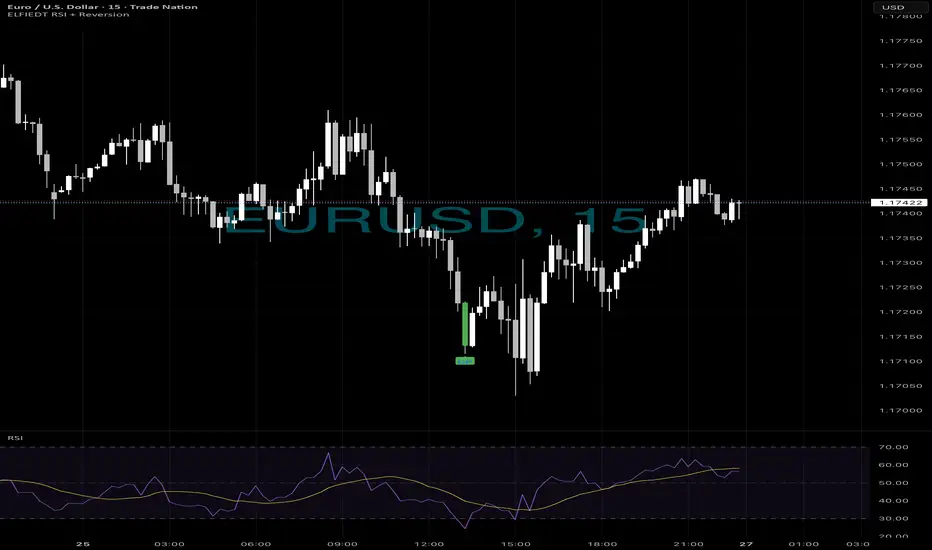
On EUR/USD, price dipped hard — but my system didn’t panic.
It waited — and when the conditions aligned, it fired the BUY.
✅ RSI + Reversion Signal printed right at the low
✅ RSI formed a classic bullish divergence
✅ Price reversed within 2 candles
✅ Textbook bounce — no guesswork
⸻
🔍 What Created the Signal?
1. Price made a lower low
2. RSI made a higher low (momentum shift)
3. Signal confirmed with an “UP” tag from ELFIEDT
4. Candle closed above reversion band = ENTRY
5. SL = just below the signal candle’s low
6. Target = 2R minimum (easily achieved)
⸻
This is what confluence looks like.
📉 Momentum shift +
📈 Reversion overshoot +
🟢 System confirmation = High-Conviction Trade
⸻
💬 DM “DIVERGENCE” if you want this tool
📲 Follow for more setups with real edge
Let the indicators do the thinking — you focus on execution.
EURUSD has broken channal and hovering near resistance.EURUSD has broken channal and hovering near resistance.

EURUSD--LONG-- 26-07-25--2 weeks before tested end bounced from monthly support level 1.15652
--last week was a rising week.
--upward movement will likely to continue this week too.
--best enrty level is around 1.17096

Euro is pumping up Officially the market is targeting the buy side liquidity on the 1.8 , next week we will see if the market confirm the up trend in lower time frame

EUR USD longas trend suggest and as today is Friday everything should settle this trade can be viable but the question that the target will hit would not be answered today
Please note: This is for educational purposes only and not a trading signal. These ideas are shared purely for back testing and to exchange views. The goal is to inspire ideas and encourage discussion. If you notice anything wrong, feel free to share your thoughts. In the end, to learn is to share !

EURUSD BUYTapped into an orderblock on the 4hr time frame, so i scaled down to the 30mins to look for a buy entry
Entry : 1.17172
TP : 1.17891
SL : 1.17001

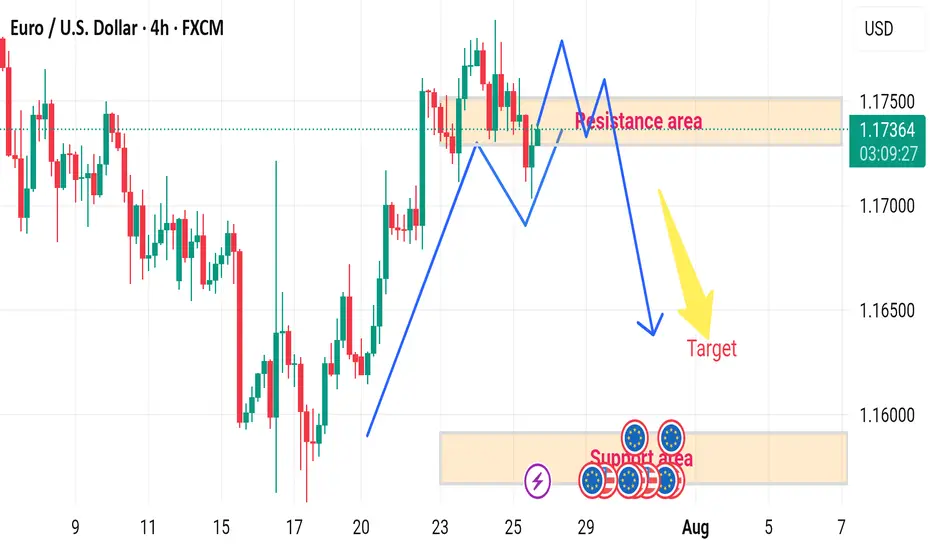
EUR/USD H4 DOWNWARD 🔄 Disrupted EUR/USD 4H Analysis
🟢 Current Context:
Price is currently at 1.17375, slightly below the resistance area (1.17400–1.17500).
Market shows a recent bullish impulse, followed by consolidation within the marked resistance zone.
Projection in the image suggests a double-top pattern forming at resistance, followed by a bearish reversal toward the target demand area (~1.15800–1.16000).
---
⚠️ Disruption Points:
1️⃣ Failed Double Top Scenario
Disruption Hypothesis: Instead of forming a clean double top and reversing, price may break above the resistance zone at 1.17500.
Reasoning: Strong bullish momentum and recent higher highs indicate potential for bullish continuation, invalidating the bearish target.
Disrupted Path: Price could break out → retest the resistance as new support → continue toward 1.18000–1.18300 zone.
2️⃣ Mid-Range Liquidity Trap
The current range may act as a liquidity trap:
Smart money could push the price slightly below support (fake breakdown), attract sellers, then reverse sharply upwards.
This would trap retail sellers targeting the 1.15800 zone.

EUR/USD – The Cleanest Buy Setup EUR/USD – The Cleanest Buy Setup This Quarter (Wave E Targeting New Highs)
---
📄 TradingView explanation
📊 EUR/USD 4H Chart Analysis
The pair has beautifully respected the corrective channel from Wave C to D and is now preparing for the final leg — Wave E.
🟦 Key Highlights:
🔹 Price bouncing off demand zone
🔹 Tight consolidation near mid-channel = accumulation
🔹 Next targets: 1.1900 / 1.2050
🔹 Bullish continuation expected after liquidity sweep
🎯 The cleanest and most technically sound buy opportunity this quarter — align your longs with the trend before the breakout happens.
💬 Let them call it a bubble — we call it precision and patience. 🧠💸
#ElliottWave #EURUSD #ForexSetups #SmartMoneyMoves
?

EUR/USD – 1H Timeframe – Bearish Setup- Fibonacci levelsWe’re closely monitoring EUR/USD on the 1-hour chart.
🔻 Trend: Bearish
📉 Price action is clearly forming a series of Lower Highs (LH) and Lower Lows (LL) — a textbook downtrend.
🔎 Divergence: None observed, confirming trend strength.
📊 Current Action: Market is in a retracement phase.
We’ve used Fibonacci retracement, and price has now reached the 38.2% level, a key reversal zone. Based on this, we’ve entered a market sell position.
📌 Trade Setup:
🔹 Entry: Instant Sell @ 1.17302
🔹 Stop Loss: 1.17633
🔹 Take Profit 1: 1.17025
🔹 Take Profit 2: 1.16754
🔹 Risk/Reward: 1:1 and 1:2
🔹 Lot Size: 0.38
🔹 Risk: $200
🔹 Reward: $200 (TP1), $400 (TP2)
⚠️ Bias: Bearish
📍 This trade setup follows strict risk management principles and is based on solid technical confluence.
📈 Let’s see how the price reacts at the key Fib level. Always trade responsibly.
#EURUSD #ForexTrading #BearishSetup #FibonacciTrading #RiskManagement #PriceAction #TradingViewIdeas

EURUSD - Next Buy Zone? This one has some nice potential
We will see how it plays out if we get tagged in

EURUSD pullback short- 25/7/25Price failed to break through the supply zone above that was identified on the higher 4hr and 1hr TF.
The last unmitigated zone is highlighted in green and looking to take a short from there to the next low.
There is equal level liquidity below that will draw price there.
In addition the HH is just a wick giving me more confidence that there is weakness in the EUR.

I'm optymist. 1.183-1.185 In front us3 year channel saying that we should to touch it.
Yellow line.
Before us
In my opinion before us is level. 1.18-1.20 before bigger correction until 1.12 even.
Then in few month i see 1.4-1.6

eur usdI drew the support and resistance on the daily time frame. It broke the resistance and had a pullback, but the last uptrend left a lot of liquidity and it is not a clean and high-quality uptrend that has an order block.

EURUSD: Will Go Up! Long!
My dear friends,
Today we will analyse EURUSD together☺️
The price is near a wide key level
and the pair is approaching a significant decision level of 1.17201 Therefore, a strong bullish reaction here could determine the next move up.We will watch for a confirmation candle, and then target the next key level of 1.17348.Recommend Stop-loss is beyond the current level.
❤️Sending you lots of Love and Hugs❤️

NZDUSD - EURUSDHi TRADERS, while we are looking to trade NZDUSD mkt wave to the upside on the 4h chart let's not think that "it may" be the same as to EURUSD, because the DOUBLE TOP PATTERN that was formed from January 4th through May 21st 2021 and then breaks to the downside have just came to retest supply zone aera on JUNE 30th 2025, and sell off a little. And this week JULY 21st 2025, buyers push price to that same W/D supply zone that also can be called SOPPRT RESISTANCE PIVOT POINT AERAS after a long period of FOUR YEARS, for the first time . My humble opinion

Eurousd techinical analysis.Eurousd techinical analysis next move posibale at h1 time frame not finchinal advice.

eurusd sell tradeThe Relative Strength Index (RSI) is showing a downward trend, indicating weakening momentum. Additionally, the Moving Average Convergence Divergence (MACD) is showing a bearish crossover, further supporting the potential for a downward move

EURUSDPossible sell opportunity. Waiting for price to make a retest + bearish confirmation on the smaller time frame before we go short.
@musehanezwothe

EURUSD: Long Signal with Entry/SL/TP
EURUSD
- Classic bullish pattern
- Our team expects retracement
SUGGESTED TRADE:
Swing Trade
Buy EURUSD
Entry - 1.1724
Stop - 1.1714
Take - 1.1743
Our Risk - 1%
Start protection of your profits from lower levels
Disclosure: I am part of Trade Nation's Influencer program and receive a monthly fee for using their TradingView charts in my analysis.
❤️ Please, support our work with like & comment! ❤️
