Eurusd Tomorrow's forecastThe correction process is expected to continue tomorrow.
The yellow zone, as usual, is the separator.
I wish you success.
EURUSD trade ideas

Eurousd techinical analysis.Eurousd techinical analysis next move posibale at h1 time frame not finchinal advice.

EURUSD Massive Bullish Breakout!
HI,Traders !
#EURUSD is trading in a strong
Uptrend and the price just
Made a massive bullish
Breakout of the falling
Resistance line and the
Breakout is confirmed
So after a potential pullback
We will be expecting a
Further bullish continuation !
Comment and subscribe to help us grow !

EURUSD BUY SETUPFOLLOW THE PRICE WILL GO UP
BECAUSE WE HAVE PATTERN ON 5 M
WE have strong candle on frame 4h

EUR/USDThe EUR/USD Is proving to show a weekly bearish reversal, but as you know within the weekly swing are smaller fractals that make the occasional (2H - 4H) hedge impulses. I have entered from the (1H - 2H) chart to the down side with a take profit of 1.01310 knowing that due to USA regulation I will not be able to hedge I will add lot size at the peak of every (4H) pull back


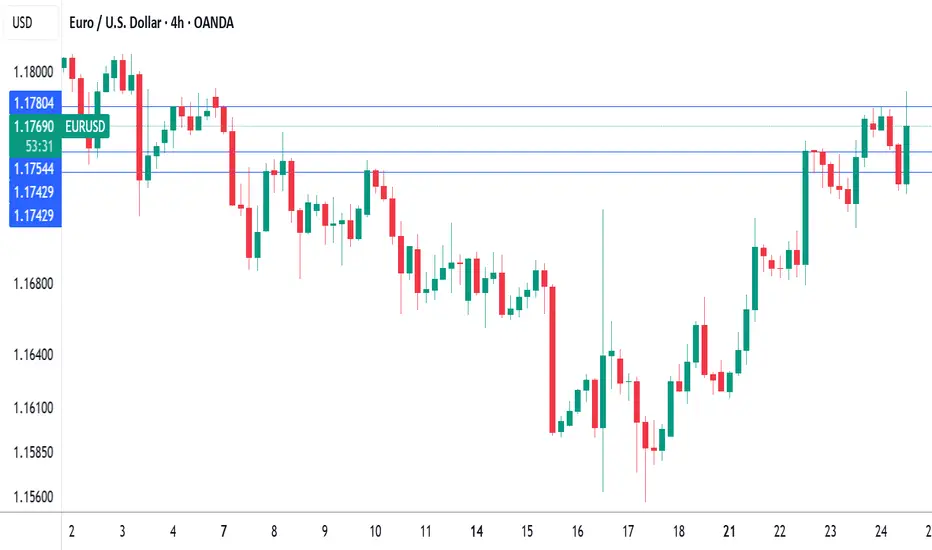
EURUSD Challenging Trend + Liquidity ZoneEURUSD appears to be challenging the lower bound of this upward trend through a pretty major liquidity zone. If it survives, looking for entry after initial retest (confirmation on the 4h ideally) up to the upper bound of the trend channel.

ECB holds rates as expected, Euro steadyThe euro is showing limited movement on Thursday. In the North American session, EUR/USD is trading at 1.1763, down 0.03% on the day. Earlier, the euro climbed to a high of 1.1788, its highest level since July 7.
The European Central Bank's decision to maintain the key deposit rate at 2.0% was significant but not a surprise. With the hold, the ECB ended a streak of lowering rates at seven consecutive meetings. The ECB has been aggressive, chopping 250 basis points in just over a year.
The ECB statement said that inflation was falling in line with the Bank's forecasts and that future rate decisions would be data dependent. President Lagarde has said that the easing cycle is almost down, but the markets are expecting at least one more rate cut before the end of the year.
The European Union and the United States are locked in negotiations over tariffs, with hopes that an agreement can be reached, on the heels of the US-Japan deal earlier this week. US President Trump has threatened to hit the EU with 30% tariffs if a deal is not made by August 1, but there are signals that the sides will agree to 15% tariffs on European imports, as was the case in the US-Japan agreement.
If an agreement is reached, it will greatly reduce the uncertainty around tariffs and will make it easier for the ECB to lower rates and make more accurate forecasts for inflation and growth.
In the US, Services PMI rose to 55.2 in July, up from 52.9 in June and above the market estimate of 53.0. This pointed to strong expansion and marked the fastest pace of growth in seven months. Manufacturing headed the opposite direction, falling from 52.6 in June, a 37-month high, to 49.5. This was the first contraction since December, with new orders and employment falling.
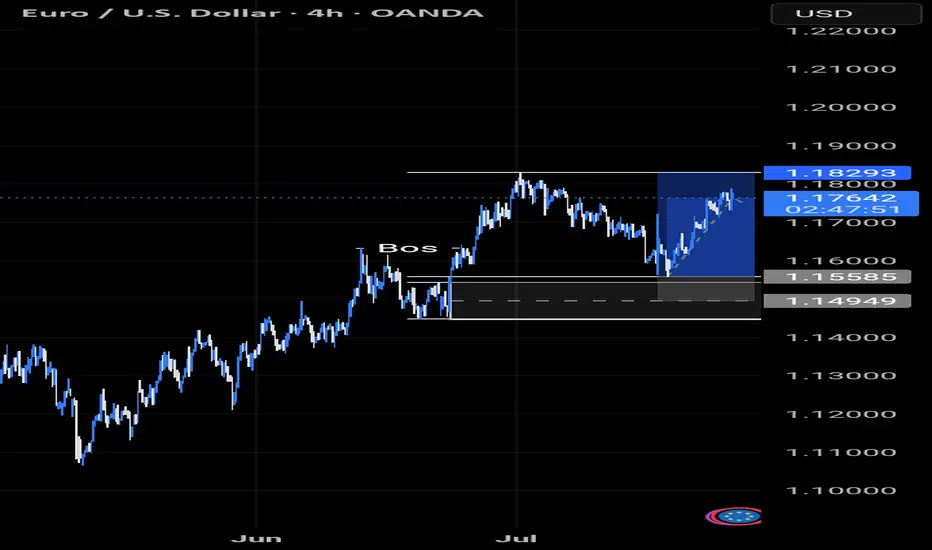
Euro will rise a little and then start to fall to support lineHello traders, I want share with you my opinion about Euro. After a prolonged consolidation period, a strong upward trend was initiated from the buyer zone around 1.1285, propelling the EUR significantly higher. This initial impulsive move has since transitioned into a more complex and mature phase, taking the shape of a large upward wedge formation, a pattern which often signals underlying exhaustion in the prevailing trend. Currently, the pair is operating within this defined market zone, characterized by a clear ascending support line and a corresponding resistance line. The price action inside the wedge has become corrective, with the most recent upward correction originating from the support area near 1.1575. The working hypothesis is centered on a short-term bearish scenario, which anticipates that this current rally will fail as it approaches the upper boundary of the wedge. A rejection from this resistance would confirm that selling pressure is increasing and that the bullish momentum is waning. This would likely trigger a significant downward rotation within the structure, with the immediate objective being a retest of the main ascending support line. For this reason, the TP is strategically and logically placed at the 1.1665 level, as this point lies directly on the trend line and serves as the most critical test for the existing uptrend's viability. Please share this idea with your friends and click Boost 🚀
Disclaimer: As part of ThinkMarkets’ Influencer Program, I am sponsored to share and publish their charts in my analysis.

EURUSD Scalp trade setupWait for the entry, if tp achieves first then cancel the trade. Today also the news day manipulation will be on peak. So take minimum risk and must use SL.


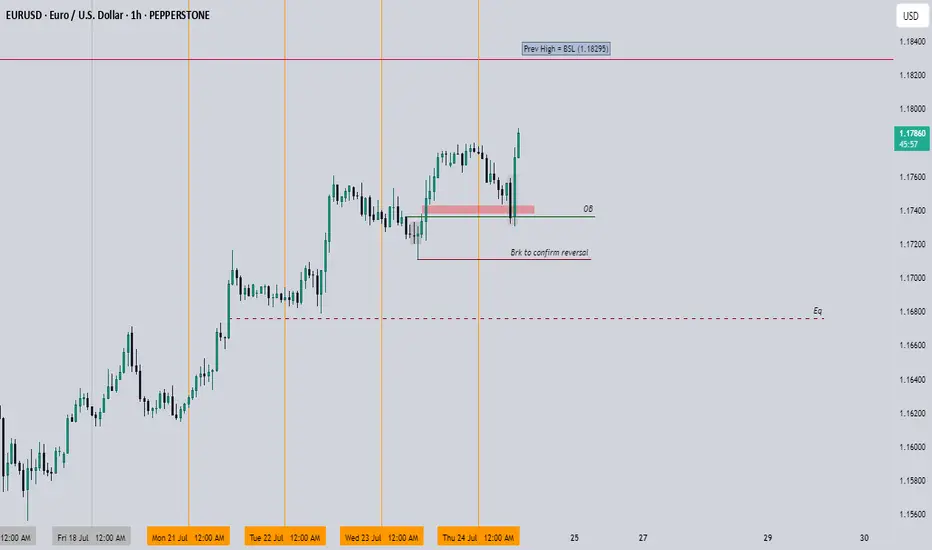
EURUSD Looking bullish in all areasI think now it is safe to say we know where EURUSD is heading to, I am looking for a sweep above the 1.18295 level
Trade Cautiously
Eurusd long 6k profit live execution EUR/USD stays defensive below 1.1800 ahead of ECB decision
EUR/USD remains in a bullish consolidation mode below 1.1800 in European trading on Thursday. Traders refrain from placing fresh bets ahead of the European Central Bank policy announcements and the US preliminary PMI data. Mixed PMI data from Germany and the Eurozone failed to trigger a noticeable reaction.


EURUSD 60/15 Pullback LongOverall strong up trend. Now under consolidate phase, then pullback, looking for long.
Possible buy zones are marked, monitor when reaching buy zones.

EURUSD LIVE TRADE 65PIPS 5K PROFITEUR/USD stays defensive below 1.1800 ahead of ECB decision
EUR/USD remains in a bullish consolidation mode below 1.1800 in European trading on Thursday. Traders refrain from placing fresh bets ahead of the European Central Bank policy announcements and the US preliminary PMI data. Mixed PMI data from Germany and the Eurozone failed to trigger a noticeable reaction.

EURUSD: Next Move Is Down! Short!
My dear friends,
Today we will analyse EURUSD together☺️
The price is near a wide key level
and the pair is approaching a significant decision level of 1.17658 Therefore, a strong bearish reaction here could determine the next move down.We will watch for a confirmation candle, and then target the next key level of 1.17506..Recommend Stop-loss is beyond the current level.
❤️Sending you lots of Love and Hugs❤️

EURUSD SELLEUR/USD stays defensive below 1.1800 ahead of ECB decision
EUR/USD remains in a bullish consolidation mode below 1.1800 in European trading on Thursday. Traders refrain from placing fresh bets ahead of the European Central Bank policy announcements and the US preliminary PMI data. Mixed PMI data from Germany and the Eurozone failed to trigger a noticeable reaction.
The EUR/USD pair retreated from a fresh two-week peak at 1.1781 posted during Asian trading hours, hovering around 1.1750 ahead of the European Central Bank (ECB) monetary policy announcement. The US Dollar (USD) edged lower on the back of risk appetite, amid headlines indicating a trade deal between Japan and the United States (US).
US President Donald Trump announced in a post on social media a trade deal with Japan that sets "reciprocal" tariffs at 15% on Tuesday, while Japanese Prime Minister Shigeru Ishiba acknowledged the trade agreement on Wednesday, saying it would benefit both sides. Trump shifted his attention to the European Union (EU), noting that if the Union agrees to open up to US businesses, he will then charge lower levies.
Meanwhile, the Hamburg Commercial Bank (HCOB) published the preliminary estimates of the July Purchasing Managers’ Indexes (PMIs). European growth stands at its highest in almost a year according to the surveys, as the Composite PMI rose to 51.0 in July from 50.6 in Jun,e while beating expectations of 50.8.
As for the ECB, the central bank announced its decision to keep the benchmark rates on hold, as widely anticipated. The interest rate on the main refinancing operations, the interest rates on the marginal lending facility and the deposit facility stood at 2.15%, 2.4% and 2%, respectively. The headline had no impact on EUR/USD, which kept trading at around 1.1750.
Right afterwards, the US released Initial Jobless Claims for the week ended July 19, which improved to 217K from the 221K previously posted and the 227K anticipated. Coming up next is ECB President Christine Lagarde's press conference, and the US S&P Global preliminary July PMIs.
SUPPORT 1.17118
SUPPORT 1.16767
SUPPORT 1.16316
RESISTANCE 1.17937
RESISTANCE 1.17703

Trading balanceTrading balance The price of the asset has rebounded from the balance zone. With the prospect of growth into the resistance zone.

Short or Long-Market is at has broken resistance level but has not tested.
-Market may be rejected by resistance to form a double top (M shape)
-If 14:15 interest rates news are positive on the Euro, we will have to take a long position, to which it may come to retest the new support after some time, confirming the long position.
-If the markets for a double bottom, it means we have tested the resistance level at a second rejection. We would then have to short that position.

EURUSD A Fall Expected! SELL!
My dear friends,
Please, find my technical outlook for EURUSD below:
The instrument tests an important psychological level 1.1751
Bias - Bearish
Technical Indicators: Supper Trend gives a precise Bearish signal, while Pivot Point HL predicts price changes and potential reversals in the market.
Target - 1.1708
About Used Indicators:
Super-trend indicator is more useful in trending markets where there are clear uptrends and downtrends in price.
Disclosure: I am part of Trade Nation's Influencer program and receive a monthly fee for using their TradingView charts in my analysis.
———————————
WISH YOU ALL LUCK

EUR/USD Analysis:🔹 Performance Overview:
The short-term trend is bullish, and price is likely to continue rising toward a key liquidity zone at 1.1829 USD.
1️⃣ Holding above 1.1780 could push the price toward testing the 1.1829 level.
2️⃣ However, a break below the 1.1715 support and stability beneath it may lead to a retest of 1.1680, followed by 1.1640.
⚠️ Disclaimer:
This analysis is not financial advice. It is recommended to monitor the markets and carefully analyze the data before making any investment decisions.
