EURUSD – The Comeback is Real! After weeks trapped in a descending channel, EURUSD has broken out in style, launching into a clean bullish channel. Price is now carving a staircase of FVG zones, with momentum clearly favoring the bulls.
What’s fueling the fire?
Flash Manufacturing PMI from Europe beat forecasts
Eurozone consumer confidence improved
Markets pricing in dovish Fed as jobless claims dropped but inflation expectations stall
As long as price stays above 1.1750 and respects the ascending channel, the 1.1850 zone is well within reach.
Strategy: Buy the dips inside the bullish channel. FVGs act as stepping stones for further upside.
EURUSD trade ideas

EURUSD Identified a more pronounced risk aversion bias Identified a more pronounced risk aversion bias in the current market after integrating news opinion, social media keyword distribution and institutional trading behavior. Recent economic data has deviated from expectations, raising concerns about global economic growth. Relevant currency pairs gradually lost the initiative in the market, and the price trend showed signs of weak oscillation or downward break.
From the viewpoint of sentiment index, investors generally turned to be cautious, and the attraction of safe-haven assets such as the dollar, yen, Swiss franc, etc. rose. This risk aversion is also confirmed on the flow side of the equation - the system recognizes that some funds have withdrawn from risky currency pairs and flowed to more liquid assets.
Combines these dynamic information to judge that the bearish trend may continue in the short term, and recommends that investors maintain a defensive mindset and lay out their strategies in a predominantly short direction.
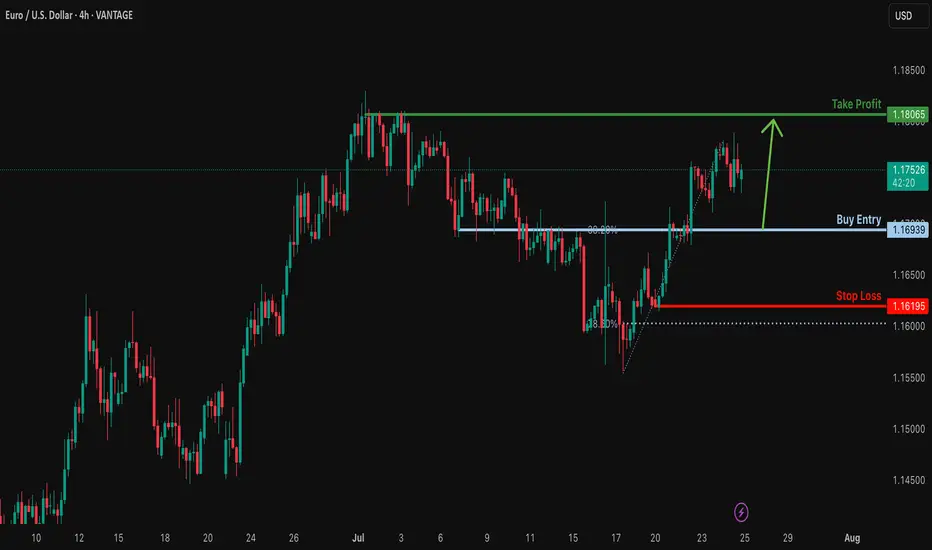
Bullish bounce off overlap support?EUR/USD is falling towards the support level, which is an overlap support that aligns with the 38.2% Fibonacci retracement and could bounce from this level to our take profit.
Entry: 1.1693
Why we like it:
There is an overlap support that lines up with the 38.2% Fibonacci retracement.
Stop loss: 1.1619
Why we like it:
There is a pullback support that is slightly above the 78.6% Fibonacci retracement.
Take profit: 1.1806
Why we like it:
There is a swing high resistance.
Enjoying your TradingView experience? Review us!
Please be advised that the information presented on TradingView is provided to Vantage (‘Vantage Global Limited’, ‘we’) by a third-party provider (‘Everest Fortune Group’). Please be reminded that you are solely responsible for the trading decisions on your account. There is a very high degree of risk involved in trading. Any information and/or content is intended entirely for research, educational and informational purposes only and does not constitute investment or consultation advice or investment strategy. The information is not tailored to the investment needs of any specific person and therefore does not involve a consideration of any of the investment objectives, financial situation or needs of any viewer that may receive it. Kindly also note that past performance is not a reliable indicator of future results. Actual results may differ materially from those anticipated in forward-looking or past performance statements. We assume no liability as to the accuracy or completeness of any of the information and/or content provided herein and the Company cannot be held responsible for any omission, mistake nor for any loss or damage including without limitation to any loss of profit which may arise from reliance on any information supplied by Everest Fortune Group.
EURUSD - Short Term Setup Could Trigger MAJOR ReversalThis bounce is likely to be a connective wave into another wave down.
In the video I break down a classic algo driven liquidity sweep just above the 0.786 retracement.
This signals potential reversal.
Stop loss placement depends on how aggressive you want to be with margin.
Tighter risk gives more upside potential with defined exposure.
Invalidation of potential retracement failure swing @ $1.18.
If this unfolds on a higher timeframe, it could develop into a heavy-hitting move.
I'm layering shorts through this area, as discussed in the video.
Trade executed on Pepperstone CFD 👍.
This analysis is shared for educational purposes only and does not constitute financial advice. Please conduct your own research before making any trading decisions.


Eurusd Tomorrow's forecastThe correction process is expected to continue tomorrow.
The yellow zone, as usual, is the separator.
I wish you success.

Eurousd techinical analysis.Eurousd techinical analysis next move posibale at h1 time frame not finchinal advice.

EURUSD Massive Bullish Breakout!
HI,Traders !
#EURUSD is trading in a strong
Uptrend and the price just
Made a massive bullish
Breakout of the falling
Resistance line and the
Breakout is confirmed
So after a potential pullback
We will be expecting a
Further bullish continuation !
Comment and subscribe to help us grow !

EURUSD BUY SETUPFOLLOW THE PRICE WILL GO UP
BECAUSE WE HAVE PATTERN ON 5 M
WE have strong candle on frame 4h

EUR/USDThe EUR/USD Is proving to show a weekly bearish reversal, but as you know within the weekly swing are smaller fractals that make the occasional (2H - 4H) hedge impulses. I have entered from the (1H - 2H) chart to the down side with a take profit of 1.01310 knowing that due to USA regulation I will not be able to hedge I will add lot size at the peak of every (4H) pull back


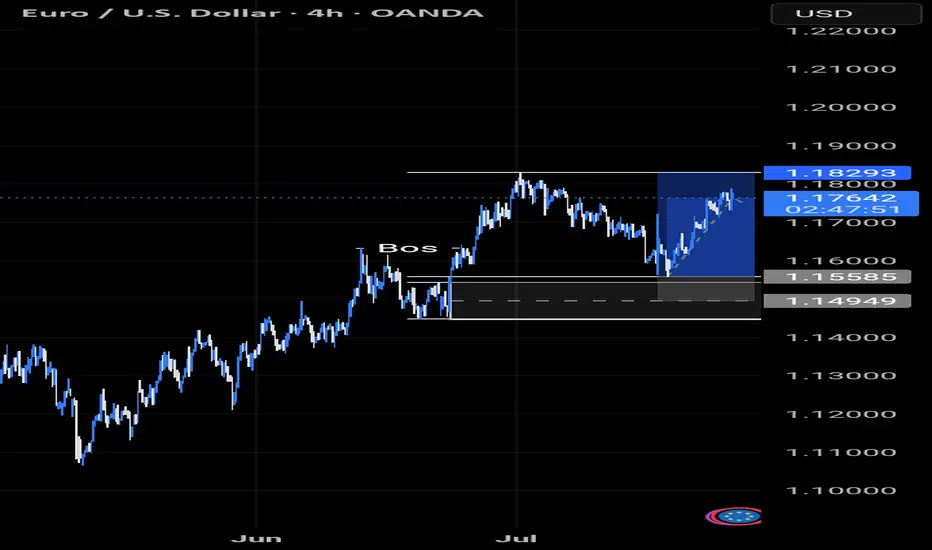
EURUSD Challenging Trend + Liquidity ZoneEURUSD appears to be challenging the lower bound of this upward trend through a pretty major liquidity zone. If it survives, looking for entry after initial retest (confirmation on the 4h ideally) up to the upper bound of the trend channel.

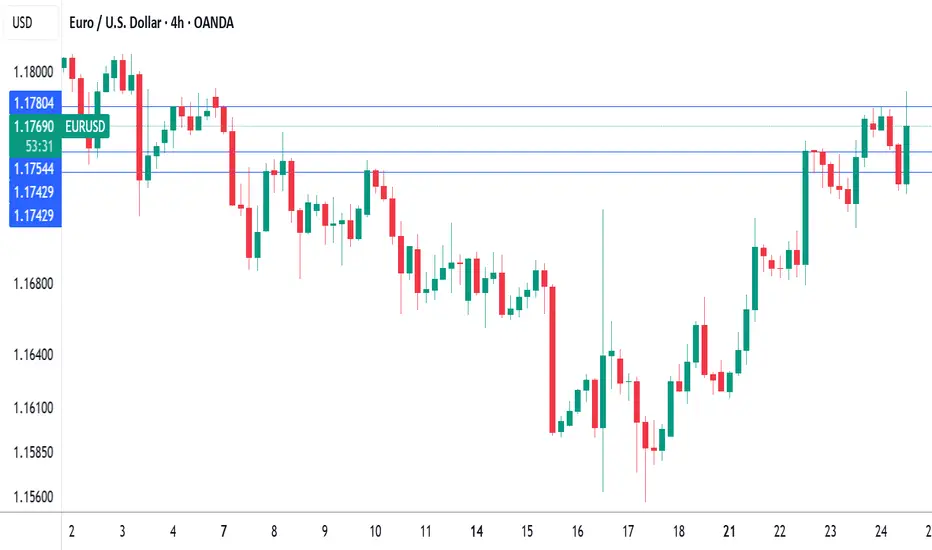
ECB holds rates as expected, Euro steadyThe euro is showing limited movement on Thursday. In the North American session, EUR/USD is trading at 1.1763, down 0.03% on the day. Earlier, the euro climbed to a high of 1.1788, its highest level since July 7.
The European Central Bank's decision to maintain the key deposit rate at 2.0% was significant but not a surprise. With the hold, the ECB ended a streak of lowering rates at seven consecutive meetings. The ECB has been aggressive, chopping 250 basis points in just over a year.
The ECB statement said that inflation was falling in line with the Bank's forecasts and that future rate decisions would be data dependent. President Lagarde has said that the easing cycle is almost down, but the markets are expecting at least one more rate cut before the end of the year.
The European Union and the United States are locked in negotiations over tariffs, with hopes that an agreement can be reached, on the heels of the US-Japan deal earlier this week. US President Trump has threatened to hit the EU with 30% tariffs if a deal is not made by August 1, but there are signals that the sides will agree to 15% tariffs on European imports, as was the case in the US-Japan agreement.
If an agreement is reached, it will greatly reduce the uncertainty around tariffs and will make it easier for the ECB to lower rates and make more accurate forecasts for inflation and growth.
In the US, Services PMI rose to 55.2 in July, up from 52.9 in June and above the market estimate of 53.0. This pointed to strong expansion and marked the fastest pace of growth in seven months. Manufacturing headed the opposite direction, falling from 52.6 in June, a 37-month high, to 49.5. This was the first contraction since December, with new orders and employment falling.
Euro will rise a little and then start to fall to support lineHello traders, I want share with you my opinion about Euro. After a prolonged consolidation period, a strong upward trend was initiated from the buyer zone around 1.1285, propelling the EUR significantly higher. This initial impulsive move has since transitioned into a more complex and mature phase, taking the shape of a large upward wedge formation, a pattern which often signals underlying exhaustion in the prevailing trend. Currently, the pair is operating within this defined market zone, characterized by a clear ascending support line and a corresponding resistance line. The price action inside the wedge has become corrective, with the most recent upward correction originating from the support area near 1.1575. The working hypothesis is centered on a short-term bearish scenario, which anticipates that this current rally will fail as it approaches the upper boundary of the wedge. A rejection from this resistance would confirm that selling pressure is increasing and that the bullish momentum is waning. This would likely trigger a significant downward rotation within the structure, with the immediate objective being a retest of the main ascending support line. For this reason, the TP is strategically and logically placed at the 1.1665 level, as this point lies directly on the trend line and serves as the most critical test for the existing uptrend's viability. Please share this idea with your friends and click Boost 🚀
Disclaimer: As part of ThinkMarkets’ Influencer Program, I am sponsored to share and publish their charts in my analysis.

EURUSD Scalp trade setupWait for the entry, if tp achieves first then cancel the trade. Today also the news day manipulation will be on peak. So take minimum risk and must use SL.


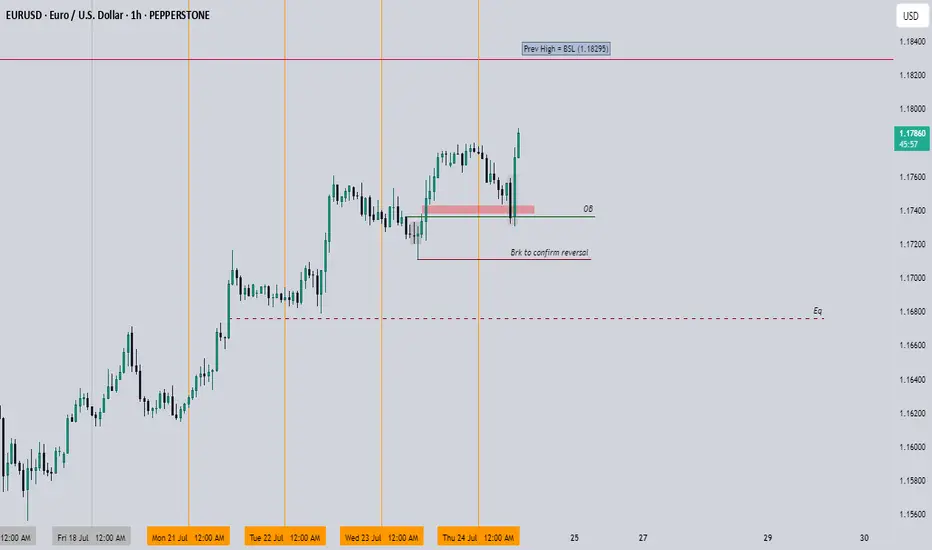
EURUSD Looking bullish in all areasI think now it is safe to say we know where EURUSD is heading to, I am looking for a sweep above the 1.18295 level
Trade Cautiously
Eurusd long 6k profit live execution EUR/USD stays defensive below 1.1800 ahead of ECB decision
EUR/USD remains in a bullish consolidation mode below 1.1800 in European trading on Thursday. Traders refrain from placing fresh bets ahead of the European Central Bank policy announcements and the US preliminary PMI data. Mixed PMI data from Germany and the Eurozone failed to trigger a noticeable reaction.


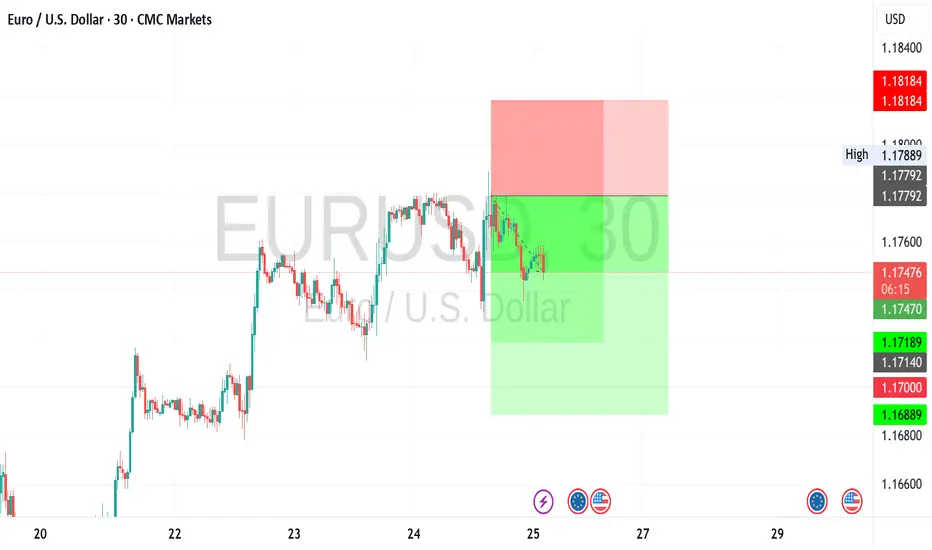
EURUSD 60/15 Pullback LongOverall strong up trend. Now under consolidate phase, then pullback, looking for long.
Possible buy zones are marked, monitor when reaching buy zones.

EURUSD LIVE TRADE 65PIPS 5K PROFITEUR/USD stays defensive below 1.1800 ahead of ECB decision
EUR/USD remains in a bullish consolidation mode below 1.1800 in European trading on Thursday. Traders refrain from placing fresh bets ahead of the European Central Bank policy announcements and the US preliminary PMI data. Mixed PMI data from Germany and the Eurozone failed to trigger a noticeable reaction.

EURUSD: Next Move Is Down! Short!
My dear friends,
Today we will analyse EURUSD together☺️
The price is near a wide key level
and the pair is approaching a significant decision level of 1.17658 Therefore, a strong bearish reaction here could determine the next move down.We will watch for a confirmation candle, and then target the next key level of 1.17506..Recommend Stop-loss is beyond the current level.
❤️Sending you lots of Love and Hugs❤️
