EURUSD trade ideas

EUR/USD Update: Bullish Momentum Builds The euro just popped above $1.17 as optimism grows around a potential US-EU trade deal, following the recent US-Japan agreement. 📊
From a technical perspective:
• The euro found support at the April high of 1.1573, rebounding sharply — a strong sign that the bull trend is still intact. 🚀
• Next resistance levels to watch:
o 1.1830 – July’s high 📅
o 1.1850 – Top of a long-term channel from 2022 📈
o 1.2000 – The 200-month moving average, a major long-term target that often attracts price reaction 🔄
📌 Key takeaway: The path of least resistance remains to the upside, with momentum building toward 1.18+ in the near term.
Disclaimer:
The information posted on Trading View is for informative purposes and is not intended to constitute advice in any form, including but not limited to investment, accounting, tax, legal or regulatory advice. The information therefore has no regard to the specific investment objectives, financial situation or particular needs of any specific recipient. Opinions expressed are our current opinions as of the date appearing on Trading View only. All illustrations, forecasts or hypothetical data are for illustrative purposes only. The Society of Technical Analysts Ltd does not make representation that the information provided is appropriate for use in all jurisdictions or by all Investors or other potential Investors. Parties are therefore responsible for compliance with applicable local laws and regulations. The Society of Technical Analysts will not be held liable for any loss or damage resulting directly or indirectly from the use of any information on this site.

The dollar is still weak against the euroThe EURUSD has risen directly with the market opening without visiting the OB, which was a good area to buy,
but that's okay, we now know where its next target will be, which is to sweep the liquidity that is above the Trend line and then break the Main High.
An expected scenario may occur when this high is broken, which is SMT (divergence), and there will be a good selling entry with GBPUSD, but until now, we have not anticipated events until this break occurs.

EUR USD LONG RESULT Price had broken down the falling channel and held the the 4HTF Trendline Support and rejected twice already, so expect a third rejection from the indicated zone from which I entered the trade and It moved just as expected and TP Done ✅
_THE_KLASSIC_TRADER_.🙏🔥

EURUSD TECHNICAL ANALYSIS📊 EUR/USD Technical Analysis – July 23, 2025
The pair is currently respecting an ascending trendline on the 1H timeframe, showing bullish momentum after breaking previous highs. Price is consolidating just below a key resistance zone, suggesting a potential breakout or rejection scenario in the coming sessions.
🔍 Key Levels:
🔴 Resistance 1: 1.17607
🔴 Resistance 2: 1.18415
🟢 Support 1: 1.16793
🟢 Support 2: 1.15983
✅ Bullish Scenario:
If price holds above the ascending trendline and breaks above the 1.17607 resistance zone with strong volume, we could see a continuation towards the next resistance at 1.18415. A bullish breakout with a retest offers a buy opportunity, targeting the higher resistance level with a stop below the trendline.
Buy Entry Idea:
Entry: After breakout and retest of 1.17607
TP: 1.18415
SL: Below 1.17250
❌ Bearish Scenario:
If price fails to hold above the trendline and breaks below 1.16793, it may signal a shift in momentum. In that case, a sell opportunity could emerge on the retest of broken support, targeting the next support level at 1.15983.
Sell Entry Idea:
Entry: Below 1.16793 after confirmation
TP: 1.15983
SL: Above 1.17000
💡Conclusion:
EUR/USD is currently at a key decision point. Traders should wait for a confirmed breakout in either direction before entering. Monitor volume and price action around the resistance and trendline area for the best setup.
📌 Always manage your risk and stick to your trading plan.
#EURUSD #ForexAnalysis #TradingSetup #PriceAction #SupportResistance #FXSMART

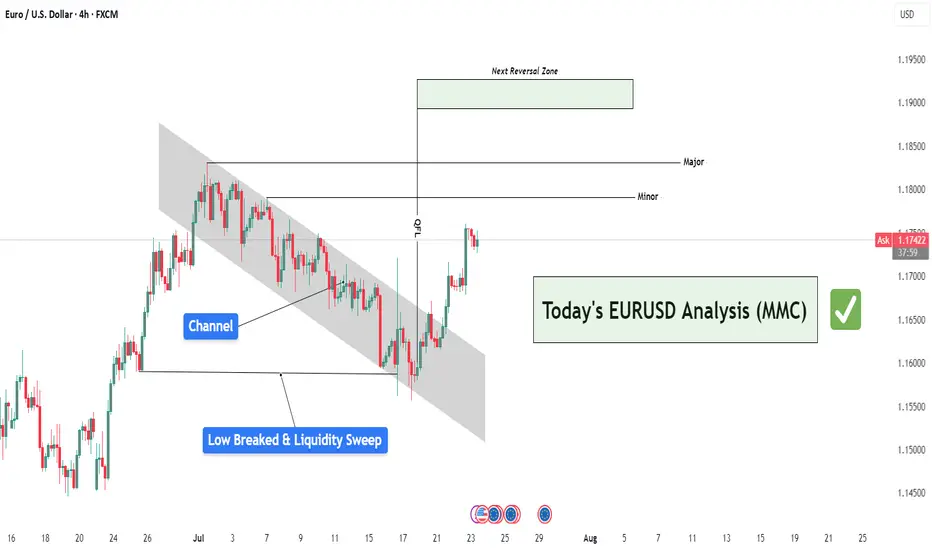
EURUSD Analysis : Liquidity Sweep – EURUSD Targets TO Reversal🧠 Institutional Context & Big Picture
EURUSD has been in a tightly controlled descending channel for several weeks—a classic sign of a market being engineered for liquidity collection. Rather than a naturally trending bearish market, this price action reflects stealth accumulation and market maker manipulation.
The channel structure was used to:
Establish a visible bearish trend (to trap sellers)
Trigger emotional bias for continued shorting
Build up stop orders below swing lows
This phase was about building energy, not continuation.
🔍 Detailed Breakdown of the Chart Elements
📌 1. Descending Channel – Controlled Manipulation
The pair moved within a well-defined bearish channel for multiple weeks.
Each touch respected the top and bottom perfectly—not random, but institutional structure.
It fostered retail confidence in the downtrend while market makers prepared for a reversal.
💥 2. Liquidity Sweep & Trap (Low Breaked & Liquidity Grabbed)
Price spiked below the previous low, clearly sweeping liquidity on July 21.
This is the "engineered breakdown", meant to trigger breakout sellers and stop out early longs.
Immediately after the sweep, the price violently reversed—clear evidence of a liquidity trap.
This is classic MMC logic: induce, trap, reverse.
🟩 3. QFL Base Formed – Bullish Engine Ignited
At the point of reversal, the chart shows the formation of a QFL (Qualified Liquidation Failure) zone.
This QFL base is the core of smart money accumulation—price broke below a base, then quickly reclaimed it.
It's not just support—it’s the true origin of the reversal and an optimal entry point.
📈 4. Breakout from the Channel – Structure Shift Confirmed
Price broke out of the descending channel with strong momentum, confirming:
Structure shift from lower lows → higher highs
Momentum shift in favor of bulls
Entry confirmation for MMC-based long setups
This breakout invalidates the bearish trend and signals a fresh leg up, likely toward unmitigated supply zones.
🟨 5. Current Price Action – Healthy Bullish Consolidation
After the breakout, price is consolidating just above the broken channel, forming a mini-flag or base.
This indicates:
Smart money is accumulating more
No significant selling pressure
Likely continuation toward next supply
🎯 6. Next Targets – Reversal Zones
Minor Resistance: ~1.1800
Major Resistance: ~1.1850 – 1.1880
Next Reversal Zone: 1.1900–1.1950
This zone is highlighted as a potential sell-off area where institutions may offload positions or create new traps.
Watch for signs of exhaustion or redistribution here.
📌 Trade Plan Based on MMC Structure
✅ Bullish Scenario (Currently Active)
Entry Area: Ideally at QFL base or breakout retest (~1.1700–1.1720 zone)
Confirmation: Bullish price action (engulfing, flag break, or liquidity wick)
Targets:
🎯 TP1: 1.1800
🎯 TP2: 1.1850
🎯 TP3: 1.1950 (Reversal Supply Zone)
❌ Invalidation:
A break below the QFL base (~1.1670) with bearish volume would invalidate the bullish MMC structure.
🧠 Smart Money Insight & Logic Recap
This entire move reflects a classic Market Maker Strategy:
Build a trend (descending channel) to shape trader bias
Trigger liquidity events (false breakdown)
Accumulate at the lows via QFL logic
Shift structure (channel breakout)
Target unfilled institutional supply (1.1850–1.1950)
This isn’t random—it’s engineered movement. Your job as a trader is to identify footprints, not follow the crowd.
Euro Steady at $1.17 as ECB Holds FireThe euro hovered near $1.17 as traders awaited Thursday’s European Central Bank decision. With rates expected to remain steady following eight consecutive cuts, policymakers tread cautiously amid strength in the euro and lingering U.S. tariff uncertainty. Meanwhile, EU officials are preparing contingency plans in case trade negotiations with President Trump collapse before the August 1 deadline.
Resistance for the pair is at 1.1830, while support is at 1.1660.
DeGRAM | EURUSD in the consolidation zone📊 Technical Analysis
● Price broke the month-long bearish channel and is now basing inside the 1.165-1.169 consolidation block; repeated intraday retests (blue zone) turn the former cap into fresh support.
● A steep hourly up-sloper is carving successive higher-lows; its width and the prior channel depth project follow-through toward 1.1745 (mid-July pivot) with room to the next swing line at 1.1800.
💡 Fundamental Analysis
● FXStreet highlights softer US PMIs and a pull-back in 2-yr yields, while ECB sources flag “data-dependent patience” rather than imminent cuts—narrowing the short-rate gap and favouring the euro.
✨ Summary
Long 1.1650-1.1680; hold above the blue base targets 1.1745 ➜ 1.1800. Long view void on an H1 close below 1.1615.
-------------------
Share your opinion in the comments and support the idea with a like. Thanks for your support!

EURUSD - Price ActionYesterday’s accumulation phase pushed the market to new highs 📈, with a top forming at 1.17605. After the price pullback during the Asian session, it appears that London used the opportunity to enter short positions, potentially forming a distribution range.
As long as we remain above the vWAP from yesterday’s accumulation, I still see a possibility for a continued move to the upside 🚀
The next key level where I’ll be watching for long entries is the demand zone supported by vWAP around 1.16940 📊
👉 Follow me for more EUR/USD trade ideas, market updates. 💼
I share structured analysis every Monday and Wednesday to help you stay aligned with the market 🗓️📊

EUR/USD PROBABLY!Waiting for confirmation on candles and Real Volume 5min or 15min (power of Real Volume)-without real volume I am like a blind man in a dense forest :)
Tools:
- real volume (proper interpretation)
- Fibonacci expansion ABC (an additional, new goal every day)
- Fibonacci retracement (combined with the real volume, it shows me the real probable movement for the next hours and days)
- volume support and resistance levels (confirmation of the price recovery level)
- oversold/overbought index (focusing on 1H and 4H something is already overvalued or undervalued)
- candlestick patterns (my entry point for 5 minutes or 15 minutes candlestick formations confirmed by particularly increasing volume).

EURUSD Will Move Higher! Long!
Here is our detailed technical review for EURUSD.
Time Frame: 9h
Current Trend: Bullish
Sentiment: Oversold (based on 7-period RSI)
Forecast: Bullish
The market is testing a major horizontal structure 1.174.
Taking into consideration the structure & trend analysis, I believe that the market will reach 1.184 level soon.
P.S
Overbought describes a period of time where there has been a significant and consistent upward move in price over a period of time without much pullback.
Disclosure: I am part of Trade Nation's Influencer program and receive a monthly fee for using their TradingView charts in my analysis.
Like and subscribe and comment my ideas if you enjoy them!

EURUSD BUY TRADE PLAN WITH CAUTIONEURUSD TRADE PLAN** 🔥
📅 Date: July 23, 2025
---
### 📋 Trade Plan Overview
| Plan ID | Type | Direction | Confidence | R\:R | Status |
| ----------------- | -------- | ----------------- | ---------- | ----- | ---------- |
| EURUSD-20250723-A | Swing | **Buy** (Primary) | ⭐⭐⭐⭐ (80%) | 3.5:1 | 🕒 Waiting |
| EURUSD-20250723-B | Tactical | Sell (Alt. Setup) | ⭐⭐⭐ (65%) | 2.5:1 | 🕒 Waiting |
🧭 **Guidance:**
Favor the **buy plan** due to HTF trend and liquidity sweep setup. Sell setup is tactical against trend.
---
## 📈 Market Bias & Trade Type
* **Bias:** Bullish overall (HTF)
* **Trade Type A:** Continuation (Buy) - PRIMARY / PREFERRED
* **Trade Type B:** Countertrend (Sell) - ALTERNATIVE
---
## 🔰 Confidence Level Breakdown
* ⭐⭐⭐⭐ 80% (Buy Plan A)
* H4 OB + Volume Imbalance = 35%
* Fib Confluence = 25%
* Sentiment Score +6/10 = 10%
* DXY Divergence = 10%
* ⭐⭐⭐ 65% (Sell Plan B)
* Short-term exhaustion pattern
* Inducement to the downside
---
## 📍 Entry Zones & Status
### 🟩 **Primary Buy Zone**
* **Zone:** 1.1680 – 1.1705 (H4 OB + Fib 61.8%)
* **Status:** 🕒 *Waiting*
### 🟧 **Secondary Buy Zone**
* **Zone:** 1.1640 – 1.1660 (Deeper imbalance)
* **Status:** 🕒 *Waiting*
---
### 🟥 **Sell Zone (Scenario B)**
* **Zone:** 1.1760 – 1.1790 (Liquidity sweep, bearish engulfing risk)
* **Status:** 🕒 *Waiting*
---
## ❗ Stop Loss Levels
* **Buy SL:** 1.1620 (Below OB + 1.5x ATR)
* **Sell SL:** 1.1815 (Above H4 supply & wick inducement)
---
## 🎯 Take Profit Targets
* 🥇 **TP1:** 1.1745 (OB imbalance reclaim) – \~65 pips
* 🥈 **TP2:** 1.1785 (Swing high) – \~100 pips
* 🥉 **TP3:** 1.1840 (Full extension / trail) – *Swing only*
---
## 📏 Risk\:Reward
* Buy Plan A: **3.5:1** to TP2, **5.2:1** to TP3
* Sell Plan B: **2.5:1** to TP2
---
## 🧠 Management Strategy
* Risk: 1.0% of account ($\ , \ lots)
* SL to breakeven at TP1
* Take: 30% at TP1, 50% at TP2, trail final 20%
* Exit if: H4 BOS or USD Index flips strongly bullish
---
## ⚠️ Confirmation Checklist
* Bullish engulfing or inside bar (H1-H4)
* Volume confirmation on bounce (preferably NY or London open)
* Optional: M30 RSI divergence
* **Avoid:** FOMC / ECB pressers
---
## ⏳ Validity
* **Buy Plan (H4):** Valid 48–72 hours → until July 26
* **Sell Plan (H1):** Valid 12–16 hours → intraday only
---
## ❌ Invalidation Conditions
* Close below 1.1620 (Buy)
* Close above 1.1815 (Sell)
* Major USD macro shift
---
## 🌐 Fundamental & Sentiment Snapshot
* COT: USD weak bias
* DXY: Retracing lower from 106.00
* Retail: 68% short EURUSD
* Cross-Pair: EURGBP also trending up
* Macro: EUR resilience post-ECB minutes
* Sentiment Score: **+6/10**
---
## 📋 Final Trade Summary
🟩 **Buy plan is preferred**, aligned with HTF trend, clean OB-Fib structure, and good RR.
🟥 **Sell plan** is tactical, potential liquidity grab before bullish continuation.
Both setups allow flexibility with proper confirmation and risk control.
---
Major EUR-related news is scheduled this week, and it's critical to factor into both trade timing and plan execution. Here's your ⚠️ Fundamental Update for EURUSD:
🌐 EUR Fundamental Events – This Week
Date Event Time (UTC) Impact Level Forecast / Notes
July 24 (Wed) 🇪🇺 Eurozone PMIs (Manu. & Services) 08:00 UTC 🔴 High Strong driver of EUR intraday volatility
July 25 (Thu) 🇪🇺 ECB Interest Rate Decision 12:15 UTC 🔴🔴🔴 Very High Key market mover – Dovish = bearish EUR
ECB Press Conference 12:45 UTC 🔴🔴🔴 Critical High volatility expected
July 26 (Fri) 🇩🇪 IFO Business Climate 08:00 UTC 🟡 Medium Impactful for EUR strength sentiment
🔍 Implications for Your EURUSD Trade Plan
✅ Buy Plan
Wait until post-ECB OR only take the setup with strong candle confirmation, ideally after NY session pullback.
Hold reduced exposure before July 25 ECB to avoid whipsaw.
❌ Sell Plan
Be extremely cautious; if ECB is neutral/hawkish, any tactical short may get invalidated rapidly.
If you take the short, exit before Thursday's ECB, unless trailing with SL to breakeven.
📊 Summary:
Yes, major EUR events this week — especially Thursday's ECB — could invalidate technical setups or accelerate them violently. Patience + confirmation = priority. Avoid entry during red events. Let volatility settle.
Let me know if you'd like to pause your trade plan until post-news or want a modified low-volatility alternative!
🧠 Always manage risk tightly around macro events. This is not investment advice.
🧠 Fundamental Snapshot
🔵 EUR Macro Landscape:
Factor Signal Explanation
Inflation 🔼 Still elevated Keeps ECB hawkish bias alive
ECB Policy ⚠️ Potentially hawkish hold Market expects no cut, but hawkish tone could push EUR higher
Economic Activity ⚪ Mixed PMIs Slight slowdown, but not recessionary
COT/Positioning 🟢 Light EUR longs Room for upside without overcrowding
Retail Sentiment 🔴 Bearish crowd Contrarian signal supports buys
USD Pressure 🟠 Mixed Fed possibly done hiking, but US economy resilient
⚠️ ECB SCENARIOS (July 25):
Scenario Likelihood Market Reaction
🟢 Hawkish Hold (no cut, firm inflation tone) 60% 🔼 EURUSD likely rallies
🟡 Neutral/Dovish Hold 30% 🔄 EUR consolidates or fades spike
🔴 Surprise Cut / Dovish Pivot 10% 🔽 EUR drops hard – buy invalidated
Most institutional forecasts lean toward a hawkish or neutral hold, giving EURUSD room to rise after the event.
🎯 Conclusion:
✅ Fundamentals support a buy, especially post-ECB.
❗ Best entry is after July 25, when market digests Lagarde's tone.
🔄 If entering early, stay small and manage risk very tightly — ECB surprises = volatility.
EURUSD Q3 | D23 | W30 | Y25📊EURUSD Q3 | D23 | W30 | Y25
Daily Forecast🔍📅
Here’s a short diagnosis of the current chart setup 🧠📈
Higher time frame order blocks have been identified — these are our patient points of interest 🎯🧭.
It’s crucial to wait for a confirmed break of structure 🧱✅ before forming a directional bias.
This keeps us disciplined and aligned with what price action is truly telling us.
📈 Risk Management Protocols
🔑 Core principles:
Max 1% risk per trade
Only execute at pre-identified levels
Use alerts, not emotion
Stick to your RR plan — minimum 1:2
🧠 You’re not paid for how many trades you take, you’re paid for how well you manage risk.
🧠 Weekly FRGNT Insight
"Trade what the market gives, not what your ego wants."
Stay mechanical. Stay focused. Let the probabilities work.
FRGNT

Euro Surges as Dollar Falters Amid Political TensionsThe EUR/USD pair is experiencing a strong rally, breaking above the 1.1760 level — its highest point in two weeks as of Tuesday. This sharp move not only signals the Euro’s recovery strength but also highlights the impact of heavy selling pressure on the US dollar.
The driving force? Ongoing trade tensions, coupled with rising uncertainty surrounding the escalating feud between President Trump and Fed Chair Jerome Powell, are shaking investor confidence in the stability of US monetary policy.
As a result, the dollar is losing its safe-haven appeal, paving the way for EUR/USD to climb higher. If this bullish momentum holds, the next key target for the pair could be around 1.1800.

EURUSD M30 I Bearish Drop Based on the M30 chart analysis, we can see that the price is testing our sell entry at 1.1736, which is an overlap resistance.
Our take profit will be at 1.1712 a pullback support level.
The stop loss will be placed at 1.1768, which is above a swing high resistance level.
High Risk Investment Warning
Trading Forex/CFDs on margin carries a high level of risk and may not be suitable for all investors. Leverage can work against you.
Stratos Markets Limited (tradu.com ):
CFDs are complex instruments and come with a high risk of losing money rapidly due to leverage. 66% of retail investor accounts lose money when trading CFDs with this provider. You should consider whether you understand how CFDs work and whether you can afford to take the high risk of losing your money.
Stratos Europe Ltd (tradu.com ):
CFDs are complex instruments and come with a high risk of losing money rapidly due to leverage. 66% of retail investor accounts lose money when trading CFDs with this provider. You should consider whether you understand how CFDs work and whether you can afford to take the high risk of losing your money.
Stratos Global LLC (tradu.com ):
Losses can exceed deposits.
Please be advised that the information presented on TradingView is provided to Tradu (‘Company’, ‘we’) by a third-party provider (‘TFA Global Pte Ltd’). Please be reminded that you are solely responsible for the trading decisions on your account. There is a very high degree of risk involved in trading. Any information and/or content is intended entirely for research, educational and informational purposes only and does not constitute investment or consultation advice or investment strategy. The information is not tailored to the investment needs of any specific person and therefore does not involve a consideration of any of the investment objectives, financial situation or needs of any viewer that may receive it. Kindly also note that past performance is not a reliable indicator of future results. Actual results may differ materially from those anticipated in forward-looking or past performance statements. We assume no liability as to the accuracy or completeness of any of the information and/or content provided herein and the Company cannot be held responsible for any omission, mistake nor for any loss or damage including without limitation to any loss of profit which may arise from reliance on any information supplied by TFA Global Pte Ltd.
The speaker(s) is neither an employee, agent nor representative of Tradu and is therefore acting independently. The opinions given are their own, constitute general market commentary, and do not constitute the opinion or advice of Tradu or any form of personal or investment advice. Tradu neither endorses nor guarantees offerings of third-party speakers, nor is Tradu responsible for the content, veracity or opinions of third-party speakers, presenters or participants.

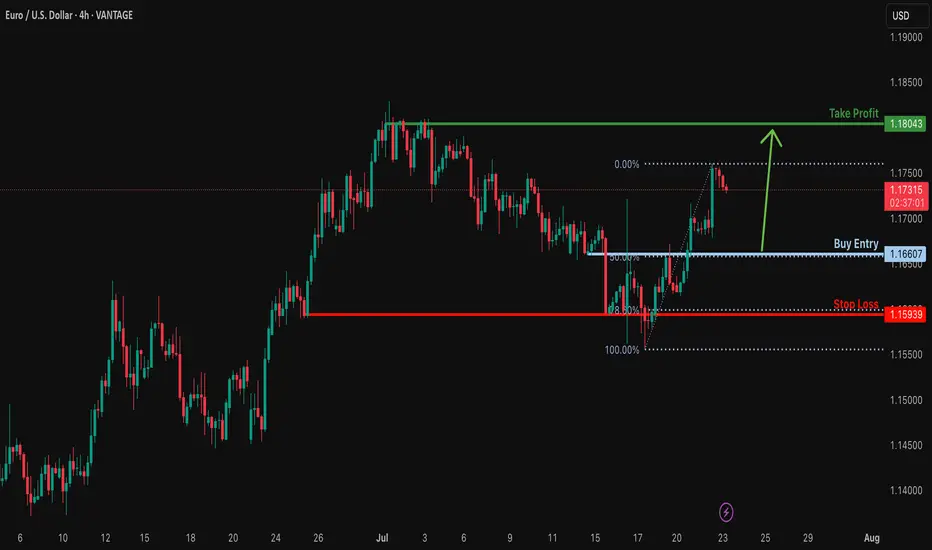
Bullish bounce?EUR/USD is falling towards the support level which is a pullback support that aligns with the 50% Fibonacci retracement and could bounce to from this level to our take profit.
Entry: 1.1660
Why we like it:
There is a pullback support that lines up with the 50% Fibonacci retracement.
Stop loss: 1.1593
Why we like it:
There is a multi swing low support that is slightly below the 78.6% Fibonacci retracement.
Take profit: 1.1813
Why we like it:
There is a swing high resistance.
Enjoying your TradingView experience? Review us!
Please be advised that the information presented on TradingView is provided to Vantage (‘Vantage Global Limited’, ‘we’) by a third-party provider (‘Everest Fortune Group’). Please be reminded that you are solely responsible for the trading decisions on your account. There is a very high degree of risk involved in trading. Any information and/or content is intended entirely for research, educational and informational purposes only and does not constitute investment or consultation advice or investment strategy. The information is not tailored to the investment needs of any specific person and therefore does not involve a consideration of any of the investment objectives, financial situation or needs of any viewer that may receive it. Kindly also note that past performance is not a reliable indicator of future results. Actual results may differ materially from those anticipated in forward-looking or past performance statements. We assume no liability as to the accuracy or completeness of any of the information and/or content provided herein and the Company cannot be held responsible for any omission, mistake nor for any loss or damage including without limitation to any loss of profit which may arise from reliance on any information supplied by Everest Fortune Group.
EUR/USD Elliott Wave Update –Classic Wave 5 Breakout OpportunityThis chart of the EUR/USD pair shows a well-structured Elliott Wave impulse pattern unfolding on the 4-hour timeframe. The price action is currently progressing in the final Wave (5) of the impulse cycle, which typically represents the last bullish leg before a larger correction begins.
Wave (1): The initial move up from the bottom (early May), showing a clean 5-wave internal structure.
Wave (2): A healthy retracement after Wave 1, forming a base for further upside.
Wave (3): The strongest and steepest rally, as expected in Elliott theory. It broke past previous highs and extended sharply.
Wave (4): A corrective phase that formed a falling wedge pattern — typically a bullish continuation pattern.
Wave (5): Currently in progress. The wedge has broken to the upside, confirming the potential start of Wave 5.
Target 1 (T1): 1.18306
Target 2 (T2): 1.19012
Stop Loss (SL): 1.16600
After a strong uptrend, the market went sideways in a wedge pattern (a typical wave 4 behavior). It has now broken out, signaling the start of the final wave 5 move. This is often a strong and sharp push. Since the breakout is clean and the Elliott wave count aligns well, this creates a favorable long opportunity

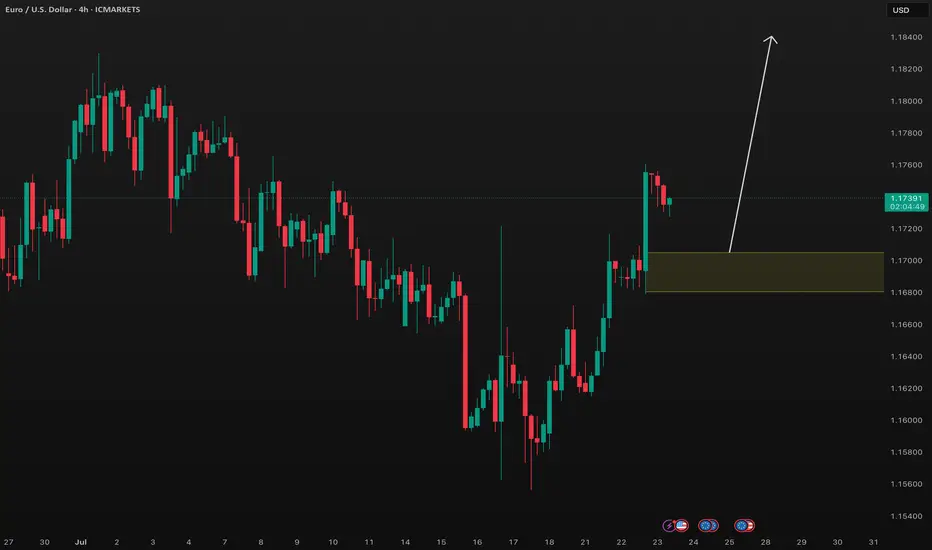
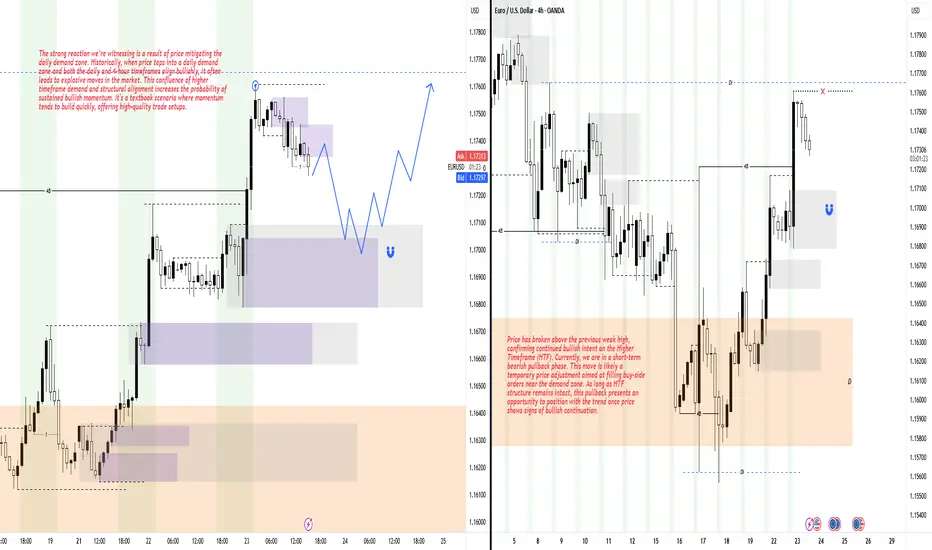
Short-Term Pullback Within a Bullish Higher Timeframe StructureHey Traders, hope you're all doing well! 👋
Price has recently broken above the previous weak high, showing strong bullish momentum. At the moment, we're seeing a short-term bearish pullback — a common market behavior aimed at filling buy orders near the demand zone.
Despite this minor retracement, the Higher Timeframe (HTF) remains firmly bullish. As long as that structure holds, this pullback could present a solid opportunity to rejoin the trend. Wait for bullish confirmation before executing any entries to stay aligned with the prevailing market direction.
EUR/USD – The Cleanest Buy Setup This Quarter
Channel respecting every pivot.
Liquidity beneath – Smart Money needs fuel.
This is not an entry.
This is a precision blueprint.
🔹 Tap into the demand zones at 1.15824 or 1.13862, and ride the next impulse to 1.19614+
Wave D correction underway.
Wave E coming to steal the spotlight.
🧠 Elliott wave structure. Liquidity mapping. Channel geometry.
You’re either chasing price... or anticipating it. I prefer the second.
📍Forex | Where Price Meets Purpose
—
#EURUSDSetup | #WaveEIncoming | #SmartMoneyMoves | #ForexBlueprint | Forex | Trading | #InstitutionalFlow | #LiquidityHunt
---

Take profit on EURUSD buy now and sell once from here Take profit on our EURUSD trade now and sell from this position

EURUSD on the riseYesterday, EURUSD broke through the 1,1720 resistance level with strong momentum.
This confirms the uptrend and opens up opportunities for buying.
The ECB is set to announce interest rates tomorrow, which could trigger increased market volatility.
Keep an eye out for higher lows and signs of the uptrend continuing.

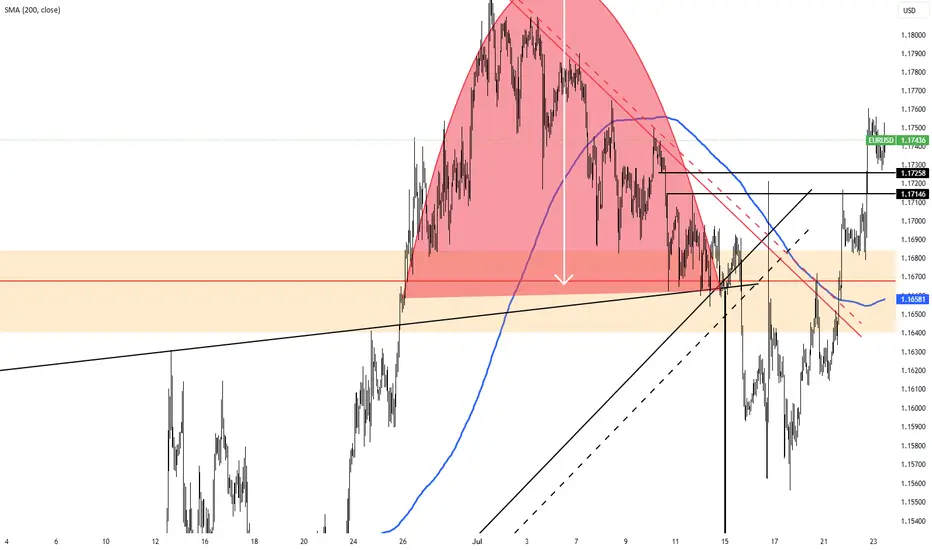
EUR/USD neutral: Proceed with cautionHello traders
My short was short lived and not too damaging.
This powerful EUR/USD bounce is not unusual but perhaps a little bit of a head scratcher.
No economic data of note.
Maybe some positioning before the ECB rate decision?
I don't know what time this morning Senator Mike Lee(R) of Utah decided it was a good idea to repost a clearly fake resignation letter from Chairman Jerome Powell on X, so perhaps that was a factor.
Once again, Scott Bessent calmed the markets by stating that he does not see any reason for Chair Powell to resign.
The technical picture is clear. The pair has broken and closed above a long term downtrend line/channel but is at the upper boundary of the short term channel.
I have noticed several ideas and minds looking for a decline to 1.1450. The intersection of the up and downtrend lines identifies that as a possible level to go long.
However, I take it one day at a time and I am generally hesitant to make long term predictions, so use your own best judgment.
The current economic environment is rife with uncertainty, so keep the risk small. To diversify,
I have been looking for potential growth stocks to dip my toes back into the stock market.
JOBY or ACHR anyone?
Best of luck

EU London Protocol, Bread & ButterOn this quick video I share my past trade I took using the London protocol. And the anticipation of the next day and how I will look to take my setup, if it will form.
