#AN023: US Tariffs and Jobs Data Sinking the Dollar
Today I want to talk to you about the latest relevant news of the week, focusing on US tariffs and the jobs data sinking the dollar and their overall impact on forex. Hello, I'm Forex Trader Andrea Russo, an independent trader and prop trader with $200,000 in capital under management. Thank you in advance for your time.
Let's get started:
1. Disappointing US jobs & new Trump tariffs
The Non-Farm Payrolls report (July) shows only 73,000 new jobs (+unemployment rates at 4.2%), with negative revisions for May-June: -258,000 jobs.
President Trump immediately signed executive orders imposing reciprocal tariffs (10–41%) on 68 countries, including Canada, Switzerland, India, and Taiwan.
The US dollar has lost ground, Treasury yields have fallen sharply, and the market is now pricing in a 90% rate cut as early as September.
FOREX Impact:
USD weak across all major crosses (EUR/USD, GBP/USD, AUD/USD).
Emerging currencies such as MXN, TRY, and INR could stabilize or gain against the USD.
JPY and CHF gain safe-haven appeal; USD/JPY and USD/CHF face possible reversals.
2. Return of $5 billion RBI swap, impact on Indian liquidity
RBI swap expiration of ₹43,000 cr (~$5 billion) scheduled for August 4: possible drain of liquidity from the Indian banking system.
FOREX Impact:
Potential downside pressure on the INR, volatility on USD/INR.
Monitor capital flows: USD/INR gains possible if trade roles remain balanced.
3. IMF Improves Forecasts but Beware of Tariff Risks
The IMF revised global growth for 2025 to 3.0%, but warns of persistent risks from high tariffs and geopolitical tensions.
FOREX Impact:
Commodity currencies (AUD, CAD, NZD) benefit from a moderately positive tone.
USD weak, but emerging markets vulnerable if growth weakens further.
4. 🇺🇸 Fed Maintains High Rates and Delays Cuts
The FOMC left Fed rates at 4.25–4.50%, adopting a wait-and-see approach. Internal disagreements on potential anticipated cuts.
FOREX Impact:
USD gains limited in the short term.
If Powell remains wait-and-see, the dollar will tend to remain weak or stagnant.
5. 📉 Correct Treasury rise and rate cut expectations
2-year bond yields -25 bps, pricing in 65–100 bps of cuts by the end of the year. Markets are losing confidence in jobs data, and the credibility of the BLS is being questioned.
FOREX Impact:
USD under pressure, especially on EUR/USD and GBP/USD.
Higher-yielding currencies such as AUD and NZD may gain carry trade flows.
6. 🌏 Asia-Pacific markets nervous on US pressure and strong yen
Asian stocks mixed: Nikkei -2%, MSCI Asia +0.3%. Strong yen penalizes Japanese exports.
FOREX Impact:
JPY strengthens, USD/JPY may compress below 150.
AUD/JPY and NZD/JPY are sensitive to risk-on/off flows into the JPY.
7. Rising country risk, emerging markets under stress
Experts recommend currency and sovereign hedging due to US volatility, impacting international portfolios.
Strengthening CHF, JPY, and possible weakness in less liquid thermal currencies.
Interest remains high in the USD compared to high-risk emerging currencies.
8. Key events expected: Jackson Hole Symposium (August 21–23)
Powell and other regulators expected to deliver a speech. No Fed/ECB meeting soon, increasing the importance of Jackson Hole as a catalyst.
FOREX Impact:
Potential flash volatility in the USD, EUR, and GBP following forward guidance.
EURUSD trade ideas
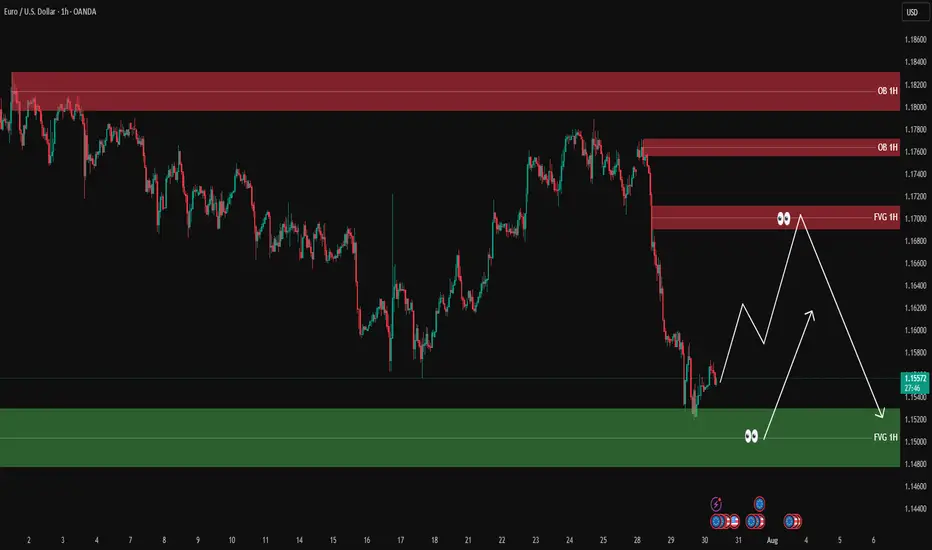
EURUSD analysis - 1H FVG and OB setupsOn the 1H timeframe, price has entered the green demand zone (1H FVG) around 1.1480 – 1.1520 after a strong bearish leg.
We're expecting a bullish retracement from this zone, aiming toward the upper red FVG/OB zone around 1.1690 – 1.1715.
📌 There are two key scenarios:
1️⃣ Scenario 1: Price starts moving up from the green FVG → reaches red FVG zone → short setup after lower timeframe confirmation
2️⃣ Scenario 2: Price makes an initial move to ~1.1620 → pulls back to the green zone → pushes back up into the red OB → short setup on confirmation
🎯 Final target for both scenarios: a break below the green FVG zone and continuation down
✅ Entry only after confirmation from lower timeframes (3M–15M)
❌ No trades without confirmation
Higher Timeframe Ice Zone - Lower Timeframe Double TopAfter a pretty rough end to the week the FX:EURUSD has rallied up into an Ice Zone - Which is a previous price level that has acted as both support and resistance in the recent past.
As we venture down to the lower timeframe we'll see that price action has also formed a double top level at that pattern which is a classic price pattern for a bearish reversal.
If you're looking for a more conservative entry then waiting for a 2618 opportunity could be something you do as well.
Please leave any questions or comments below & be sure to give me a follow if you want to be notified of my trading ideas.
Akil

EUR/USD manipulation continuesWe don't care about your boring 200-300 pip manipulation. All traders know that bankers manipulate the market with fake data. During a historic recession in Europe, the price of the euro rises. This has never happened before. Europe will fall apart and the euro will collapse.

Forex Market Structure and Factors Affecting ItForex Market Structure and Factors Affecting It
The forex market, a vast and dynamic financial arena, operates uniquely as a decentralised over-the-counter network. This article delves into its intricate structure, exploring the roles of various participants and the influence of technology. Understanding these elements is essential for anyone looking to navigate and succeed in the world of forex trading.
Understanding Market Structure in Forex
The structure of the foreign exchange market, commonly known as the forex market, is uniquely decentralised and operates over-the-counter (OTC). Unlike traditional markets with a central exchange, forex is a vast network of dealers, brokers, and financial institutions globally. This setup allows for 24-hour trading five days a week, accommodating various time zones and providing constant access to market participants.
Each participant plays a pivotal role in shaping the basic market structure of forex, with banks and financial institutions primarily acting as market makers, providing liquidity and setting prices for retail traders and brokers. This complex web of interactions and the decentralised nature of the market ensure constant movement in currency values, offering numerous opportunities for trading and speculation.
Participants in the Forex Market
In the diverse landscape of forex trading, the structure is made up of a range of participants. Each group influences the market's dynamics in unique ways:
- Central Banks and Governments: They regulate monetary policies and currency supply, impacting prices. For example, the US Federal Reserve significantly influences the value of the US dollar.
- Commercial Banks: As intermediaries, they facilitate transactions and engage in speculative trading, contributing to liquidity.
- Multinational Corporations: Involved in cross-border transactions, these entities engage in trading to manage currency risks.
- Retail Traders: Individual traders speculate on currency movements using online platforms, forming a significant market portion.
- Institutional Traders: Entities like hedge funds and asset management firms, which trade with sophisticated strategies and considerable resources.
Market Tiers and Interactions
The forex market's structure is defined by distinct tiers and interactions among its participants. Each tier plays a unique role:
- Tier 1: Major Players - This top tier includes large banks, financial institutions, and central banks. They have the most significant impact on market dynamics, often setting trends and liquidity standards.
- Tier 2: Intermediaries - Comprising smaller banks and financial firms, they serve as intermediaries, facilitating transactions and linking Tier 1 entities with smaller participants.
- Tier 3: Retail Market - At this level are individual investors, small businesses, and retail traders. They interact with the market primarily through brokers and online platforms, influenced heavily by the actions of the upper tiers.
These tiers illustrate the varied types of market structure in forex, reflecting the complexity and diversity of trading interactions.
Central Bank's Role in Market Structure
Central banks play a pivotal role in shaping the advanced market structure in forex. They influence the market through several key mechanisms:
- Monetary Policy: Central banks determine monetary policy, which directly influences interest rates. This, in turn, affects the attractiveness of a country's currency, thereby impacting forex rates and market dynamics.
- Market Stabilisation: In times of volatility, central banks can intervene in currency markets to stabilise currencies. Interventions involve buying or selling their own currency to influence exchange rates, directly affecting market structure.
- Regulatory Oversight: Central banks often have a regulatory role, overseeing banking and financial systems. Their regulations can influence accessibility, liquidity, and transparency, which are critical for a well-functioning forex market.
- Economic Signalling: Central banks release economic data and policy decisions that serve as key indicators for traders. This information can lead to anticipatory moves in the markets, shaping prices based on perceived economic strength or weakness.
- Foreign Exchange Reserves Management: Central banks manage significant foreign exchange reserves. Their strategies in managing these reserves, including decisions on when and how much to buy or sell, have a substantial impact on forex liquidity.
Technology’s Impact on Market Structure
Technological advancements have significantly reshaped the market structure in forex, introducing new dynamics and efficiencies. Electronic trading platforms, like electronic communication networks (ECNs), have revolutionised access to the forex market. Before these platforms, trades were often executed via traditional methods like phone calls.
Algorithmic trading uses computer programs for automatic trade execution, enabling fast, consistent transactions. High-frequency trading (HFT), a subset of algorithmic trading, executes thousands of trades per second, enhancing liquidity and reducing transaction costs but also raising concerns about market stability.
Furthermore, big data and analytics allow traders to analyse large datasets for price trends, refining their strategies. Mobile trading has democratised access, enabling trading from virtually anywhere, which has increased competition among brokers and accessibility for retail traders. These technological developments have increased efficiency and accessibility, contributing to a more interconnected and dynamic market.
The Bottom Line
Understanding the forex market structure is crucial for successful trading. This decentralised OTC network thrives on the interactions among various participants, influenced by central banks' policies and technological advancements. As traders navigate this dynamic environment, the right tools and knowledge are key.
This article represents the opinion of the Companies operating under the FXOpen brand only. It is not to be construed as an offer, solicitation, or recommendation with respect to products and services provided by the Companies operating under the FXOpen brand, nor is it to be considered financial advice.

EUR/USD Rises 2.3% Since the Beginning of AugustEUR/USD Rises 2.3% Since the Beginning of August
As the EUR/USD chart shows today, the euro has strengthened against the US dollar, climbing above the 1.1670 level, compared to the 1.1400 area at the beginning of the month.
Why Is EUR/USD Rising?
According to Reuters, the US dollar's weakness is being driven by:
→ Expectations of a Federal Reserve rate cut, which intensified following last week's disappointing US labour market data.
→ Anticipation of the upcoming US inflation report, scheduled for release on 12 August at 15:30 GMT+3.
On the other hand, the euro is being supported by growing optimism around a possible resolution of the military conflict in Ukraine, as well as the potential meeting between Donald Trump and Vladimir Putin.
Technical Analysis of the EUR/USD Chart
On 30 July, we noted that after hitting its July low, EUR/USD could stage a recovery — which indeed materialised. But does the chart now look bullish?
A definitive bullish outlook is hindered by the sequence of lower highs and lower lows (A-B-C-D), which continues to form a bearish market structure.
At the same time, the descending channel on the EUR/USD chart has become more pronounced. After a brief period of consolidation near the channel’s median line (marked with a circle), the price moved up towards the upper boundary of the channel. It is worth noting that a sharp decline occurred recently from these same levels (highlighted with an arrow), breaking through the blue support line.
Given these factors, it is reasonable to assume that bearish activity may intensify around current levels, potentially slowing further EUR/USD growth.
This article represents the opinion of the Companies operating under the FXOpen brand only. It is not to be construed as an offer, solicitation, or recommendation with respect to products and services provided by the Companies operating under the FXOpen brand, nor is it to be considered financial advice.

EURUSD SHIFTED TO INTRADAY BULLISH!Price has aligned with higher timeframe bias after breaking the major key level. From the intraday perspective, if I’d get a retrace to 1.16000 I’ll be looking forward to buying EURUSD

EURUSD - SERA - Market Structure EURUSD - SERA - Market Structure - use risk and trade managment for best result

EURUSD Elliott Wave Update Aiming for 1.191 in Wave 5 ExtensionThe EURUSD pair exhibits an incomplete bullish sequence originating from the September 2022 low, targeting 1.191. The rally from this low unfolds as an impulse Elliott Wave structure. Wave ((1)) concluded at 1.1275, followed by a pullback in wave ((2)) that ended at 1.0177. The pair has since resumed its upward trajectory in wave ((3)), reaching 1.183. Subsequent pullback in wave ((4)) completed at 1.139, as illustrated in the 1-hour chart. The internal structure of wave ((4)) formed a zigzag pattern. From the peak of wave ((3)), wave (A) declined to 1.1554. Wave (B) rallied to 1.1788, and wave (C) descended to 1.1388, finalizing wave ((4)).
The pair has now turned higher in wave ((5)), but it must break above the wave ((3)) high at 1.183 to eliminate the possibility of a double correction. From the wave ((4)) low, wave 1 peaked at 1.1588, and wave 2 retraced to 1.1514. The pair is expected to extend once more to complete wave ((v)) of 3, followed by a wave 4 pullback, before advancing in wave 5 to conclude wave (1) of a higher degree. Subsequently, a wave 2 correction from the August 1 low is anticipated in a 3, 7, or 11 swing pattern before the uptrend resumes. As long as the pivot low at 1.1388 holds, dips should attract buyers in 3, 7, or 11 swing sequences, supporting further upside potential.

Pennant — Trend Is Your Best Friend 🚩 Pennant — Trend Is Your Best Friend 📈
drive.google.com
🔍 Introduction
The Pennant is a trend continuation pattern, resembling a small triangle that forms after a strong initial move (known as the “flagpole”). It is similar to the Flag pattern, but with one key difference: the body of the Pennant is formed by two converging trendlines, rather than parallel ones.
📐 Pattern Description
The Pennant forms after a strong, impulsive price move, indicating that the trend is likely to continue after a short pause.
Like the Flag, the Pennant consists of two main components:
The flagpole — a sharp, directional move (either bullish or bearish)
The Pennant body — a brief consolidation shaped like a symmetrical triangle 🔺
🟢 A bullish pennant forms after a strong upward move
🔴 A bearish pennant follows a strong downward move
🧠 Market psychology behind the pattern:
After a big move, many traders expect a reversal and begin taking counter-trend positions. But when the breakout occurs in the direction of the original trend, it triggers a wave of new orders, pushing price even further. That’s why the Pennant is often used to enter trades in the direction of the dominant trend.
📉 Volume behavior is also key:
High volume during the initial move
Low volume during the Pennant’s consolidation
Rising volume on the breakout
This volume pattern reflects renewed trader interest and often leads to a more explosive breakout compared to a Flag, due to the tightening nature of the consolidation.
⚠️ A weak or sloppy move before the Pennant weakens the signal and increases the risk of false breakouts.
🎯 Entry & Stop-Loss Strategy
📥 Entry: After a confirmed breakout above the Pennant’s resistance (or below it for bearish setups)
🛑 Stop-loss: Placed just below the last local low before breakout
💰 Profit Target:
Partial take profit at the top of the flagpole
Full target = the height of the flagpole projected from the breakout point (aka the Measured Move)
Always account for key support/resistance levels to define the potential range
💡 The Pennant often offers great risk/reward due to its tight structure and explosive potential.
💡 My Pro Tips for Trading Pennants
✅ Pennant Pattern Criteria
Trend continuation pattern
A strong, nearly vertical move preceding the Pennant
Triangle-shaped consolidation (two converging lines)
The Pennant body must be shorter than the flagpole
The lowest point of the Pennant should not exceed half the length of the flagpole
Breakouts should happen in the direction of the initial trend
Tight range before breakout increases accuracy
📈 What Strengthens the Signal
Sharp, clean, directional initial move (strong flagpole) ⚡
High volume on the initial move, and volume surge on breakout 💥
⚠️ What Weakens the Signal
Choppy or weak price action before the Pennant 🫤
Lack of volume during the flagpole or breakout 💤
✅ Examples of My Winning Pennant Setups
🔗 EURUSD Bearish Pennant — Ready to Drop
❌ Examples of My Losing Setups
🔗 XAUUSD Bullish Pennant — Failed Follow-through
💬 Do You Trade Pennants?
They’re one of the most powerful continuation patterns when paired with clean price action and volume confirmation. What’s your experience with Pennants? Share your wins — and fails — below 👇👇

EUR/USD SELLERS WILL DOMINATE THE MARKET|SHORT
Hello, Friends!
Previous week’s green candle means that for us the EUR/USD pair is in the uptrend. And the current movement leg was also up but the resistance line will be hit soon and upper BB band proximity will signal an overbought condition so we will go for a counter-trend short trade with the target being at 1.152.
Disclosure: I am part of Trade Nation's Influencer program and receive a monthly fee for using their TradingView charts in my analysis.
✅LIKE AND COMMENT MY IDEAS✅

EURUSD- 6/8/25 - bullish pushAfter last week's high momentum bullish move, the last few days has resulted in a consolidation with a price ceiling that has been tested about 4 times - equal high liquidity zone.
Ideally i would like a pull back to trigger a bullish move.
+ve:
1. equal high liquidity that has been tested 4 times
2. continuing with bullish momentum
-ve:
1. Large imbalance below this zone which could draw price lower

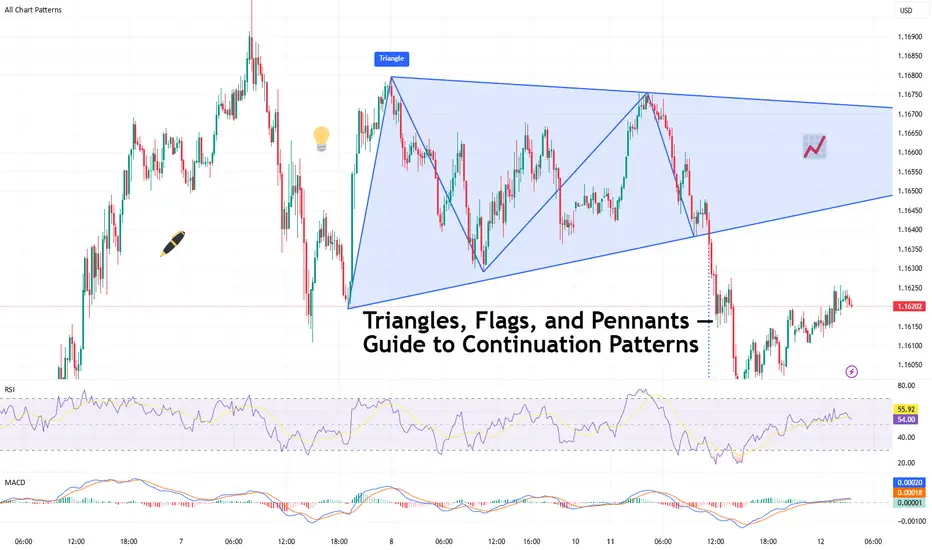
Triangles, Flags, and Pennants — Guide to Continuation PatternsChart patterns can be mysterious — until they’re not. Let’s break down the technical trio that tells you when a trend’s just taking a breather before it flexes again.
So your chart’s been pumping higher for weeks, and then… nothing. Price starts scribbling sideways. Cue panic? Maybe. But more likely, you’re staring at a continuation pattern.
Triangles, flags, and pennants are the subtle “hold my beer before I try to pull a move” signals of technical analysis. They show up when markets pause — not reverse. That pause could mean your trend is catching its breath, not dying in a ditch.
In other words: don’t close your longs just because things go quiet. Sometimes the market is just stretching before it sprints again.
⚠️ Symmetrical, Ascending, Descending
Let’s talk triangles, the Swiss Army knife of consolidation. These shapes come in three stylish varieties:
● Symmetrical triangle: Higher lows, lower highs. Traders call this the indecision pattern, but don’t get it twisted — it may just be winding up for a breakout. Wanna see how these look in practice? Dive into our community’s symmetrical triangle ideas .
● Ascending triangle: Flat top, rising bottom. Buyers are aggressive, their patience is running out. Resistance looks like it’s begging to be broken. Check the ascending triangle ideas for your viewing consideration.
● Descending triangle: Flat bottom, falling top. This one’s more bearish than your boomer uncle who knows zero about Bitcoin BITSTAMP:BTCUSD , and yes — it’s often a precursor to a breakdown. Follow the descending triangle ideas and make sure you DYOR.
Key tip : Wait for the breakout. Don’t front-run triangles unless you like volatility surprises and emotional damage.
🚩 Flags: Fast Moves, Tight Consolidations
Flags form after a sharp price move — the “flagpole” — followed by a tight, slightly sloping channel that moves against the prevailing trend. They’re short-term patterns that act like pit stops during a race.
● In a bull flag, price rallies sharply, then consolidates lower in a downward-sloping rectangle. If price breaks above the upper boundary, the uptrend is likely to resume. Jump straight into the bullish flag ideas .
● In a bear flag, price crashes, then drifts higher or sideways, forming an upward-sloping consolidation. A breakdown below the lower support hints at a continuation lower. What goes up must go down — bearish flag ideas for thought.
Flags are prized for their reliability and tight risk-to-reward setups. The breakout is typically swift, and traders often use the length of the flagpole as a projected target.
🎏 Meet the Pennant: The Flag’s Cousin
Pennants are like mini-triangles that form after a strong price move, usually in high-volume conditions. Unlike regular triangles, they’re smaller and more compressed — a tight consolidation in the shape of a tiny symmetrical triangle.
What makes a pennant different from a flag? The structure. While flags are rectangular, pennants are more pointed — a converging pattern rather than parallel lines.
Pennants are often seen in high-momentum environments, and when price breaks out of the consolidation zone, it often does so with force. Get some pennant ideas straight from our community.
🧐 How to Actually Trade These Patterns
Spotting a continuation pattern is one thing. Trading it with discipline is another.
Here’s a basic checklist:
● Identify the trend. Continuation patterns only work when there’s a clear preceding move. If the chart is a sideways mess, maybe skip it.
● Draw your levels. Use trendlines or horizontal support/resistance to outline the pattern. Keep it clean — if you’re forcing a pattern, it probably isn’t there.
● Wait for the breakout. Don’t jump in too early. Let the price confirm your bias. Breakouts are more credible with a volume spike.
● Set your stop wisely. Most traders place stops just outside the opposite side of the pattern — below the lower trendline in an uptrend, or above the upper trendline in a downtrend.
● Target projection. Many use the height of the pattern or the flagpole to estimate a target price, though market conditions should influence your approach.
🤔 So, What Could Go Wrong?
Glad you asked. Plenty.
● Fakeouts: Just because it looks like a breakout doesn’t mean it’s real. Wait for confirmation — volume, a close outside the pattern, or your favorite indicator giving the green light.
● Shaky patterns: Not every triangle-looking pattern is a triangle. Sometimes it’s just noise. Don’t make up patterns. The market doesn’t care about your geometry.
● Overleveraging: Continuation patterns look reliable, but no pattern is bulletproof. Position sizing still matters. Don’t bet the farm because a pennant gave you butterflies.
💡 Pro Tips from the Chart Trenches
● Set alerts on trendline breaks so you’re not glued to the screen like a caffeinated hawk.
● Use pattern recognition tools if you’re a newer trader — but verify manually. No software is a crystal ball.
● Trade continuation patterns in the direction of the trend. Countertrend flags are usually bear traps in disguise.
📌 One Last Thing: Pattern ≠ Prediction
Chart patterns don’t tell the future. They tell a story about buyer and seller behavior. Continuation patterns? They’re just the market saying, “Yeah, we’re still into this trend. Just grabbing some break first.”
Use them as one part of a system. Combine them with momentum indicators, volume, or good ol’ fashioned risk management.
Because in the end, it’s not about how many triangles you find — it’s about how many fakeouts you avoid.
Off to you : Spotted any textbook triangles or sneaky flags this week? Or caught a pennant fakeout that wrecked your stop loss?
Drop your best (or worst) continuation pattern story below. You never know who might learn something from your chart scars.
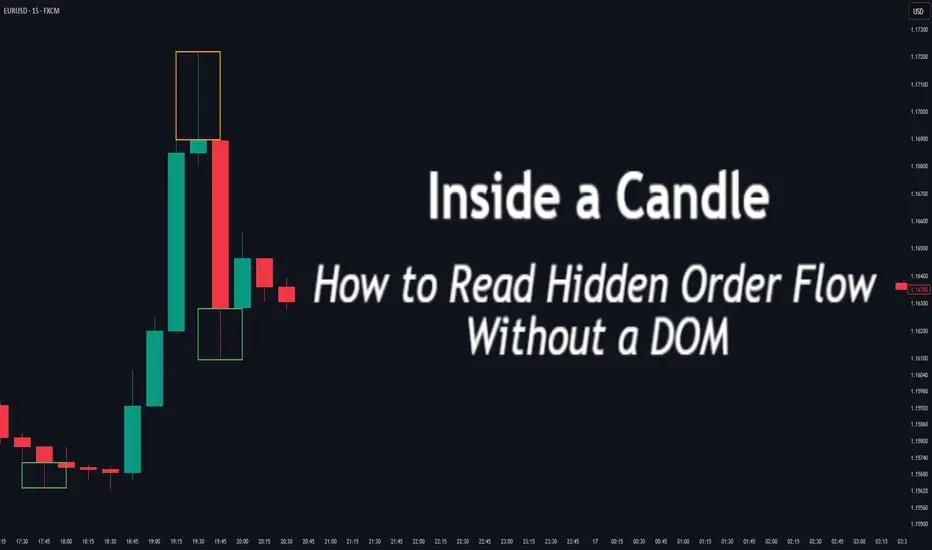
Inside a Candle: How to Read Hidden Order Flow Without a DOM
Difficulty: 🐳🐳🐳🐋🐋 (Intermediate+)
This article is for traders who want to understand the “story” behind a candle’s shape — and learn to spot aggressive buying/selling, absorption, and traps without needing footprint or order book tools.
🔵 INTRODUCTION
Most traders see candles as static shapes — green or red, big or small. But each candle is a battlefield of orders . Even without access to a DOM or volume footprint, you can still extract valuable information from just the candle's body, wick, and context .
🔵 ORIGINS: WHERE CANDLESTICKS COME FROM
Candlestick charts trace back to 18th-century Japan, where rice traders needed a way to visualize price movements over time. A legendary trader named Munehisa Homma , who traded rice futures in Osaka, is credited with developing the earliest form of candlestick analysis.
Homma discovered that price wasn’t just driven by supply and demand — but also by trader psychology . He created visual representations of market sentiment by tracking:
The opening and closing price of rice
The highest and lowest price reached during the session
This system became known as the “Sakata rules,” and it laid the foundation for many patterns still used today — such as Doji, Engulfing, and Marubozu.
Western traders only began using candlesticks widely in the 1990s, when analyst Steve Nison introduced them to the broader financial world through his book Japanese Candlestick Charting Techniques.
Today, candlesticks remain one of the most powerful and intuitive ways to visualize order flow, momentum, and market psychology — even without a Depth of Market (DOM) or depth of book.
In this article, you’ll learn how to read hidden order flow by analyzing:
Wick length and positioning
Body-to-range ratios
Candle clustering and sequences
🔵 HOW A CANDLE FORMS
Before you can read a candle, you need to understand how it comes to life . A single candle represents the full auction process during its time window.
Here’s how it builds, step by step:
Candle opens — this is the open price .
As price moves up during the session → the high] updates.
As price moves down → the low] updates.
The final traded price when the time closes → this becomes the close price .
The wick = price areas that were tested but rejected
The body = where the majority of aggressive trades occurred
If buyers push price up quickly but sellers slam it down before the close — the candle will have a long upper wick and close near the open, revealing seller absorption.
Understanding this flow helps you recognize traps, fakeouts, and reversals in real time.
🔵 CANDLE BODY: WHO'S IN CONTROL
The body of the candle reflects the result of the battle between buyers and sellers. A wide body with minimal wicks means dominance and commitment.
Big body, small wick → clear conviction
In an uptrend: buyer aggression
In a downtrend: panic or aggressive selling
Small body, long wicks → indecision, absorption, or trap
Often appears near tops/bottoms
Indicates both sides were active but neither won clearly
www.tradingview.com
🔵 WICKS: THE SHADOWS OF REJECTION
Wicks are not just “leftovers” — they show where price was rejected after being tested.
Long upper wick = seller presence or absorption at highs
Long lower wick = buyer defense or trap spring
Double wick = liquidity sweep / false breakout
Use wick direction to spot:
Failed breakouts
Smart money traps
Exhaustion candles
🔵 HIDDEN ORDER FLOW PATTERNS
1️⃣ Absorption Candle
A large wick with little movement afterward — shows that big orders absorbed market pressure.
2️⃣ Trap Candle
A candle that sweeps above/below a key high/low and closes opposite — classic smart money fakeout.
3️⃣ Imbalance Candle
Large-bodied candle that closes near the high/low with no wick on the other end — implies one-sided aggression (and often leaves an imbalance).
🔵 CLUSTERING & SEQUENCES MATTER
Never read a candle alone. The sequence of candles tells the full story:
3+ rejection wicks near resistance? Liquidity building before breakout or trap
Bearish engulfing after long upper wick = smart money selling into retail buying
Tight-range dojis + volume spike = compression before expansion
Context + volume + structure = hidden flow decoded.
🔵 PUTTING IT TOGETHER: A REAL EXAMPLE
Price breaks above previous high
Candle closes with long upper wick and smaller body
Next candle opens, dumps fast, leaving imbalance behind
Buyers trapped — move likely to continue down
This is how you read order flow from candle anatomy .
🔵 TIPS FOR MASTERY
Use a lower timeframe (1M–5M) to see microstructure
Watch how wicks behave near S/R or OBs
Confirm with volume spikes or delta-style indicators
Use replay mode to slow down the story and study cause/effect
🔵 CONCLUSION
Every candle is a message. You don’t need expensive tools to read order flow — just your eyes, context, and curiosity.
Learn to see candles not as symbols, but as evidence of behavior . Absorption, imbalance, and traps are all visible if you look closely.
EURUSD SELL SETUP SHOOOOOOOOORTWHAT'S YOUR OPINION ?
EURUSD formed ascending pattern on time frame Daily
and it break uptrend line and do retest on it
so we should research selling opportunities

EURUSD market structure analysis on M15, H1 timeframesH1 Timeframe – Main Trend: BULLISH
🟢 Current Situation:
The H1 structure is showing a clear sequence of Higher Highs (HH) and Higher Lows (HL) ⇒ indicating an uptrend.
The market is currently in a retracement phase following the last bullish impulse.
Price is approaching a demand zone from a previous structure, where buy orders may be stacked.
📉 M15 Timeframe – Main Trend: BEARISH (within H1 pullback)
🔍 Current Observations:
While H1 is in a retracement, M15 shows a clear bearish market structure (Lower Lows – Lower Highs).
However:
Price has tapped into the H1 demand zone.
A liquidity grab (sweep of highs/lows) just occurred on M15.
This was followed by a Break of Structure (BOS) to the upside ⇒ signaling potential absorption of sell-side liquidity and a reversal in alignment with the higher timeframe (H1).

EUR/USD – 1H | Bearish Setup Toward Rejection BlockPrice has broken structure (BOS) and confirmed a Market Structure Shift (MSS) after rejecting from the P1D High / Swing High zone.
Currently trading just above the P1D Low, and if the swing fails to hold, we could see a continuation toward the Equal Low / Strong Low area and ultimately into the Rejection Block for a potential reaction.
Bearish Roadmap:
1️⃣ BOS & MSS confirm downside bias.
2️⃣ Break of P1D Low → move toward Equal Low / Strong Low.
3️⃣ Final delivery into the Rejection Block.
Key Levels:
P1D High / Swing High: 1.16780
P1D Low: 1.16150
Equal Low / Strong Low: 1.15600
Rejection Block: 1.15350 – 1.15200
Order Block (OB) target: 1.14000 zone
🎯 Watching for short entries on pullbacks with targets at liquidity pools below.

Fiber Battle Plan: Bulls Prepare for EUR/USD Uprising🏴☠️💸 EUR/USD "Fiber Heist Plan" – Thief Trader's Bullish Raid! 💸🏴☠️
🔓 The Vault is CRACKED – Time to LOAD UP! 🚀📈💰
🎯 MASTER PLAN:
Asset: EUR/USD ("Fiber")
Direction: BULLISH HEIST 🐂💪
Entry Strategy: Layered Limit Orders (Sneaky thief-style accumulation)
Trigger: Hull MA CROSS confirmed + Price > 1.16300 🎯
Stop Loss: 1.15100 (Guarding the loot!) 🛡️
Target: 1.18000 (Bank it & bounce!) 💰🔥
🕵️ THIEF TRADER’S BREAKDOWN:
💡 "Weak hands shake, WE TAKE!" – This is a high-probability bullish raid with layered entries for MAXIMUM stealth.
✅ ENTRY TACTICS:
Buy Limit Orders stacked near swing lows (1.16300 zone)
Only trigger AFTER Hull MA confirms bullish flip (No early fomo!)
Scale in like a pro thief – don’t dump all bullets at once.
⚔️ RISK CONTROL (MANDATORY!):
SL at 1.15100 (Break this? ABORT MISSION.)
No revenge trading! Stick to the plan or get caught slippin’.
🎯 PROFIT SECURING:
First TP: 1.18000 (Lock in gains!)
Trailing SL option (If momentum stays strong, let it RUN!)
🚨 THIEF’S WARNING:
⚠️ News = Trap Zone! (Avoid fresh entries during high-impact news)
⚠️ No greed! Secure profits before the market reverses on you.
⚠️ Follow the Hull MA like a shadow – if it flips bearish, RE-EVALUATE!
🔥 SUPPORT THE HEIST!
💥 SMASH THAT LIKE & BOOST BUTTON if you're riding with the Thief Trading Crew!
💬 Comment "🚀 LOADED!" if you're in!
We steal smart, trade sharp, and stack profits like bandits. Stay lethal, traders! 🐱👤💸🔥

EURUSD Still waiting to see how price reacts at the levels outlined in the idea and should provide more information
EUR/USD - Weekly AMD Cycle! Coming to an end🔁 EUR/USD – Weekly AMD Cycle Repeating? 📉
Pair: EUR/USD
Timeframe: Weekly
Bias: Bearish (Mid-Cycle Distribution)
🧠 What Is the AMD Cycle?
The AMD Cycle is a 3-phase smart money model used to describe how price moves through:
Accumulation – Smart money loads up on positions in discount zones.
Manipulation – Stop hunts / false breakouts to mislead retail.
Distribution – Price delivers to target efficiently, often with trend continuation.
This cycle repeats over and over across all timeframes – and right now, EUR/USD is showing a textbook repeat of this pattern on the weekly chart.
📊 EUR/USD Weekly – AMD Breakdown
✅ Phase 1: Accumulation (Late 2022 – Mid 2023)
Price bottomed out in the 0.95 - 1.00 zone, creating multiple equal lows, acting as liquidity.
Smart money accumulated orders here, absorbing sell pressure.
✅ Phase 2: Manipulation (Q3 2023 – Early 2024)
Price created a massive bullish rally, sweeping highs around 1.10 – 1.12, triggering breakout buyers.
This was liquidity engineering, not genuine bullish continuation.
We saw divergent volume, overextended price, and imbalance being left behind.
✅ Phase 3: Distribution (Mid 2024 – Now)
After sweeping the highs, price has shifted structure.
Multiple weekly BOS (Breaks of Structure) confirm a bearish reversal.
Price is now returning to retest premium zones near 1.09 – 1.10, likely to distribute further before sell-off.

Sell Plan – EUR/USD (Bear Wakeup)Sell Plan – EUR/USD (Bear Wakeup)
Market Context: Price has retraced into a bearish zone after taking out previous buy-side liquidity.
Bearish Signal: Rejection from a key supply area (red zone) with potential shift back into bearish orderflow.
Entry Trigger: Wait for confirmation of lower timeframe breakdown after the retracement.
Targets: First SSL zone, followed by deeper liquidity levels as marked on the chart.
Rationale:
Multiple SSL levels below suggest liquidity draw to the downside.
Current structure favors continuation lower once retracement is complete.

EUR/USD Holds Steady Ahead of US DataHello everyone, what are your thoughts on FX:EURUSD ?
Today, the pair is trading in a narrow range around 1.1650 on Friday. While the US dollar is struggling to regain strength, a slight pullback in EUR/GBP following the Bank of England’s policy announcement has limited the upside for EUR/USD. The market now awaits upcoming US economic data.
From a technical perspective, EUR/USD remains anchored above newly established support levels. If these levels hold, this pullback could be an excellent accumulation phase before a breakout move.
What do you think? How will EUR/USD move by the end of the session and in the coming days?

"EURUSD: Wave C Completion Signals Uptrend Continuation"Buy stop: $1.16151
Set up: ABC correction
Sl: $1.15080
TP:$1.18221
RR: 2:1
