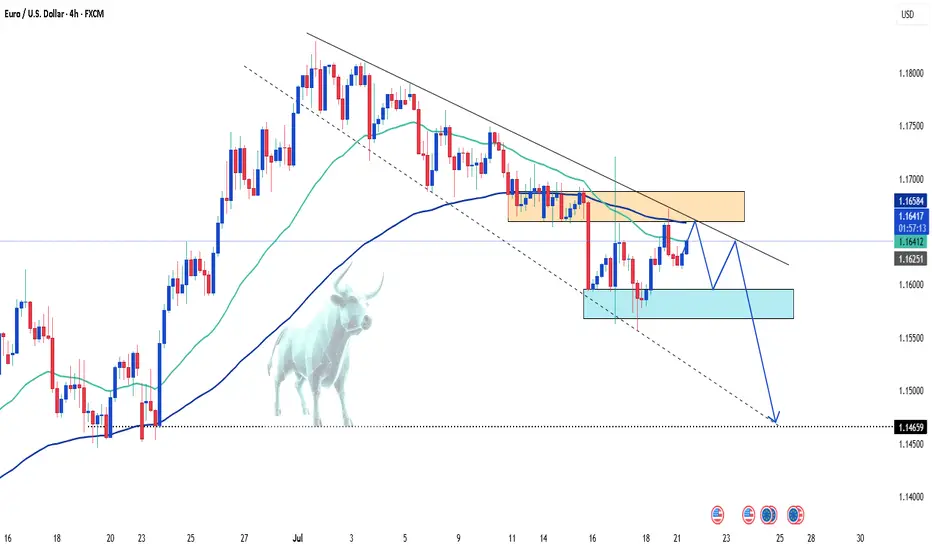
EURUSD Consolidating now, but soon may reveal a new trend!!!EURUSD is consolidating between the red box shown. Previously, it can be seen that, this whole area between 1.17050 and 1.16630 is very choppy, and not the best area to place any trades.
Look at the market structure latest HH. If price pushes above 1.17050, we will continue in an uptrend, and then we will look for BUYS.
Now, look at the red trendline drawn. It is interacting with the consolidation zone. We have a very small pullback at the red arrow drawn. It exactly sits at 1.16630.
The point is, if price goes below that level, we will know that price is respecting the trendline and would most likely continue moving down. Therefore, we look for SELLS.
Obviously, we dont want to get caught in any fakeouts. So we will further look at how the candles are being formed later and what story they tell.
Now we wait and watch.
EURUSD trade ideas

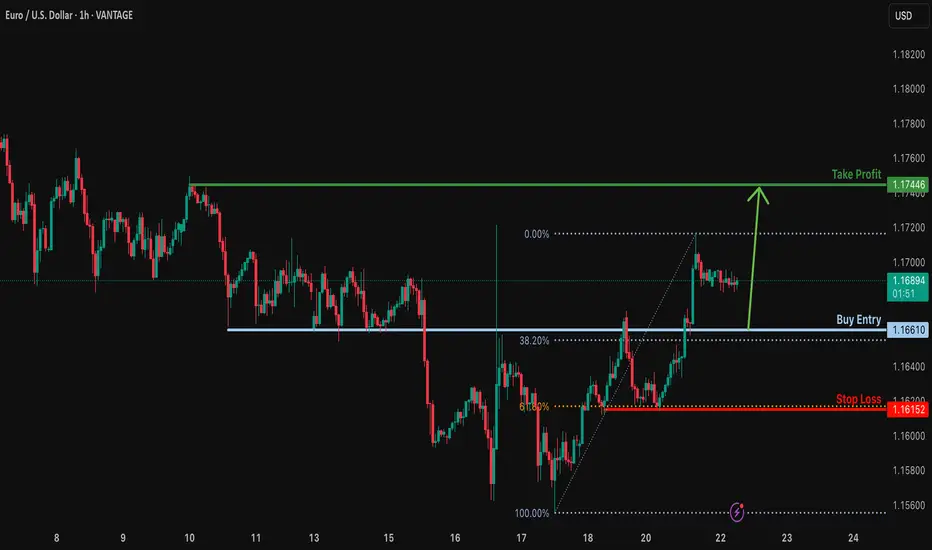
Bullish bounce off overlap support?EUR/USD is falling towards the support level which is an overlap support that aligns with the 38.2% Fibonacci retracement and could bounce from this level to our take profit.
Entry: 1.1661
Why we like it:
There is an overlap support that lines up with the 38.2% Fibonacci retracement.
Stop loss: 1.1615
Why we like it:
There is a pullback support that aligns with the 61.8% Fibonacci retracement.
Take profit: 1.1744
Why we like it:
There is a pullback resistance.
Enjoying your TradingView experience? Review us!
Please be advised that the information presented on TradingView is provided to Vantage (‘Vantage Global Limited’, ‘we’) by a third-party provider (‘Everest Fortune Group’). Please be reminded that you are solely responsible for the trading decisions on your account. There is a very high degree of risk involved in trading. Any information and/or content is intended entirely for research, educational and informational purposes only and does not constitute investment or consultation advice or investment strategy. The information is not tailored to the investment needs of any specific person and therefore does not involve a consideration of any of the investment objectives, financial situation or needs of any viewer that may receive it. Kindly also note that past performance is not a reliable indicator of future results. Actual results may differ materially from those anticipated in forward-looking or past performance statements. We assume no liability as to the accuracy or completeness of any of the information and/or content provided herein and the Company cannot be held responsible for any omission, mistake nor for any loss or damage including without limitation to any loss of profit which may arise from reliance on any information supplied by Everest Fortune Group.
Fundamental Market Analysis for July 22, 2025 EURUSDThe euro is trading near 1.1700, having retreated from an intraday high of 1.1720 after the release of the final June U.S. CPI figures, which confirmed a slowdown in inflation to 2.7% y/y and 0.1% m/m while keeping the core reading steady at 3.1%. The brief rise in risk appetite quickly gave way to stronger demand for the dollar as the probability of the Fed’s first rate cut in September fell from 65% to 55%.
Additional pressure on the euro comes from the yield differential: 10-year U.S. Treasuries hover around 4.45%, while German Bunds yield only 2.30%. The gap of more than 215 bp encourages capital to flow from the eurozone into dollar assets, supporting USD demand.
Fundamentally, risks for the euro remain tilted to the downside: after June’s rate cut the ECB said further moves depend on price dynamics, and the eurozone composite PMI dropped to 50.1 – the brink of stagnation. Against the backdrop of weak continental activity and moderate yet persistent U.S. inflation, the pair may test support at 1.1615 in the coming sessions, especially if U.S. durable-goods orders exceed forecasts.
Trading recommendation: SELL 1.1700, SL 1.1720, TP 1.1615

Bullish Setup Loading: Watching Structure & Confirmation ZonesHello Traders,
Price is currently in a counter-trend pullback phase, showing signs of temporary weakness within a larger bullish context. Patience is key as we wait for price to build structure and break the internal Lower High (LH), which would act as an early signal of bullish continuation.
The 4-hour internal structure remains strongly bullish, following a clean mitigation of the daily bullish continuation demand zone. A long setup from a 4H Point of Interest (POI), backed by Lower Timeframe (LTF) confirmation, offers a high-probability trade aligned with the higher timeframe trend. Confirmation through structural shifts will reduce risk and increase confidence in directional bias.

#012: LONG Investment Opportunity on EUR/USD
In this scenario, I placed a passive long order on EUR/USD at a key zone that has shown signs of accumulation and institutional defense in recent days.
The price showed bearish manipulation followed by a sharp rebound with a V-shaped pattern, often indicative of stop-loss hunting. In these phases, a direct entry is less effective than a passive strategy aimed at intercepting a possible technical pullback in the zone where abnormal volumes and algorithmic defenses have manifested.
The order was designed to be activated only if the market were to temporarily return to the previously absorbed zone, thus avoiding chasing the price after a directional candlestick.
The stop-loss placement was carefully chosen to avoid both typical retail hunting zones and areas visible to algorithms. It is positioned to ensure operational invisibility, but also consistency with the logic of institutional defense: if reached, the trade will be automatically invalidated.
The target is aligned with the superior technical structure and the normal range of movement that develops when this dynamic is respected.
This operation is designed to be left to operate completely autonomously, without the need for adjustments or active management. Either in or out. The sole objective is to align with institutional flows, with controlled risk and a favorable management structure.

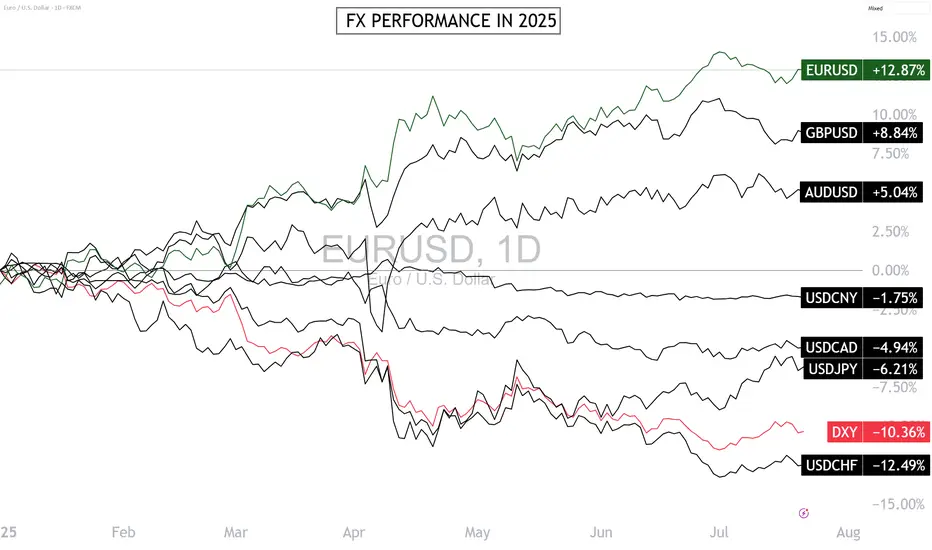
Can the Euro-Dollar Maintain Its Leadership in the FX Market?The Euro-Dollar is the best-performing major FX pair in 2025, and a short-term consolidation phase has begun below $1.18. This strength of the euro-dollar is surprising given the divergence in monetary policies. Can the euro-dollar go higher this year? How can this strength be explained fundamentally? In this week of ECB monetary policy decision (Thursday, July 24), let’s take a technical and fundamental look at the euro-dollar, which is stalling after reaching the technical resistance at $1.18.
1) Euro-Dollar’s Leadership in 2025 Defies the Logic of Monetary Policy Divergence
2025 is proving surprising in the FX market: the euro-dollar (EUR/USD) is the top-performing pair, with a gain of over 12% since the beginning of the year. This outperformance is puzzling if we rely on classic monetary fundamentals. The divergence between the Federal Reserve (Fed) and the European Central Bank (ECB) should favor the dollar.
The Fed maintains a prolonged monetary status quo with high rates due to persistent inflation and labor market tensions. In contrast, the ECB continued its rate-cutting cycle, reflecting a weaker European economy and better-contained inflation. Theoretically, this monetary asymmetry should have strengthened the dollar — yet the euro leads. This paradox is explained by a combination of fundamental factors.
2) Unexpected Fundamentals Are Driving the Euro-Dollar’s Strength in 2025
The euro-dollar’s bullish trend this year ignores the interest rate differential between the Fed and the ECB, both current and projected for the end of 2025.
Here’s a summary of the bullish fundamentals that allowed the euro-dollar to overlook monetary divergence:
• Trump administration’s fiscal policy raises concerns over U.S. debt sustainability (see long-term bond yields)
• Trade war initiated by the Trump administration creates economic slowdown risks for U.S. companies heavily reliant on international trade
• U.S. administration’s political will to improve currency competitiveness for exporters
• European stocks catching up to U.S. stocks in valuation
• Emerging markets’ will to diversify their public debt issuance
• Euro catching up as a global reserve currency as diversification away from the U.S. dollar
• Germany’s structural shift in fiscal and debt policy with massive investments in defense and industry
• EU stimulus spending and the ECB’s perceived monetary policy coherence
3) Is $1.18 the Final High for the Euro-Dollar in 2025? Probably Not.
The euro-dollar has been consolidating since early July after hitting $1.18. Is this the peak for the year? The answer is no — unless EUR/USD breaks below the $1.13/$1.15 support and unless institutional net positions reverse from their upward trend (see yellow line in CFTC COT data).
DISCLAIMER:
This content is intended for individuals who are familiar with financial markets and instruments and is for information purposes only. The presented idea (including market commentary, market data and observations) is not a work product of any research department of Swissquote or its affiliates. This material is intended to highlight market action and does not constitute investment, legal or tax advice. If you are a retail investor or lack experience in trading complex financial products, it is advisable to seek professional advice from licensed advisor before making any financial decisions.
This content is not intended to manipulate the market or encourage any specific financial behavior.
Swissquote makes no representation or warranty as to the quality, completeness, accuracy, comprehensiveness or non-infringement of such content. The views expressed are those of the consultant and are provided for educational purposes only. Any information provided relating to a product or market should not be construed as recommending an investment strategy or transaction. Past performance is not a guarantee of future results.
Swissquote and its employees and representatives shall in no event be held liable for any damages or losses arising directly or indirectly from decisions made on the basis of this content.
The use of any third-party brands or trademarks is for information only and does not imply endorsement by Swissquote, or that the trademark owner has authorised Swissquote to promote its products or services.
Swissquote is the marketing brand for the activities of Swissquote Bank Ltd (Switzerland) regulated by FINMA, Swissquote Capital Markets Limited regulated by CySEC (Cyprus), Swissquote Bank Europe SA (Luxembourg) regulated by the CSSF, Swissquote Ltd (UK) regulated by the FCA, Swissquote Financial Services (Malta) Ltd regulated by the Malta Financial Services Authority, Swissquote MEA Ltd. (UAE) regulated by the Dubai Financial Services Authority, Swissquote Pte Ltd (Singapore) regulated by the Monetary Authority of Singapore, Swissquote Asia Limited (Hong Kong) licensed by the Hong Kong Securities and Futures Commission (SFC) and Swissquote South Africa (Pty) Ltd supervised by the FSCA.
Products and services of Swissquote are only intended for those permitted to receive them under local law.
All investments carry a degree of risk. The risk of loss in trading or holding financial instruments can be substantial. The value of financial instruments, including but not limited to stocks, bonds, cryptocurrencies, and other assets, can fluctuate both upwards and downwards. There is a significant risk of financial loss when buying, selling, holding, staking, or investing in these instruments. SQBE makes no recommendations regarding any specific investment, transaction, or the use of any particular investment strategy.
CFDs are complex instruments and come with a high risk of losing money rapidly due to leverage. The vast majority of retail client accounts suffer capital losses when trading in CFDs. You should consider whether you understand how CFDs work and whether you can afford to take the high risk of losing your money.
Digital Assets are unregulated in most countries and consumer protection rules may not apply. As highly volatile speculative investments, Digital Assets are not suitable for investors without a high-risk tolerance. Make sure you understand each Digital Asset before you trade.
Cryptocurrencies are not considered legal tender in some jurisdictions and are subject to regulatory uncertainties.
The use of Internet-based systems can involve high risks, including, but not limited to, fraud, cyber-attacks, network and communication failures, as well as identity theft and phishing attacks related to crypto-assets.
EURUSD - Sell Setup in ProgressPair: EURUSD
Bias: Bearish
HTF Overview: Structure leaning bearish — price respecting recent lower highs with room to fall into deeper 4H demand.
Current Zone: Price just mitigated the 30M sell-side OB, showing early signs of reaction.
LTF Confirmation: Still in observation mode — waiting for 5M or 1M confirmation to trigger short entries with confidence.
Entry Zone: Focused on refined LTF shift beneath the 30M OB — ideal setup includes inducement or liquidity run before executing.
Targets: First target is intraday low — ultimate target is the strong 4H demand zone below.
Mindset Note: Let the market bring the entry to you — don’t jump ahead of confirmation. Smart patience wins.
Bless Trading!

Eurousd techinical analysis.Eurousd techinical analysis next move posibale at h1 time frame.not finchinal advice.

EUR USD longit can be a viable setup , as last week we got trumped the uncertainty about dollar can continue...
one thing about how i trade . the last method I'm using is using a secondary analyzer app that can detect the lines and patterns , in mass numbers . i would put my favorite asset beside then ill open trades with a proper risk to reward ratio ( 1/ 1.5 usually) , i have fixed hour for job its 5 hours of monitoring the market. after that i wont open trades as it enters new york session . in whole day i would close my trades as i reach my daily goal, then i go do my daily life ...
so you may think i copy these ideas . that's not the case, its true for my real account im using a fish catcher but i know some day i dont have this and i should be able to catch the fishes with my hand. so im sharing these ideas based on my experience and yet i have to work on them ...
Please note: This is for educational purposes only and not a trading signal. These ideas are shared purely for back testing and to exchange views. The goal is to inspire ideas and encourage discussion. If you notice anything wrong, feel free to share your thoughts. In the end, to learn is to share !

Key resistance for EURUSDYesterday, EURUSD moved higher and reached a key resistance level at 1,1720.
Watch closely to see if there’s enough momentum for a breakout and further upside.
If the price gets rejected, we could see a deeper correction.
Increased volatility is likely on Thursday following the ECB decision.
At the current levels, there’s no clear reason to enter a trade.

EURUSD H1 I Bullish Bounce Off Based on the H1 chart analysis, the price is falling toward our buy entry level at 1.1667 a pullback support that aligns with the 50% Fib retracement.
Our take profit is set at 1.1706, a swing high resistance.
The stop loss is placed at 1.1642, a pullback support.
High Risk Investment Warning
Trading Forex/CFDs on margin carries a high level of risk and may not be suitable for all investors. Leverage can work against you.
Stratos Markets Limited (tradu.com ):
CFDs are complex instruments and come with a high risk of losing money rapidly due to leverage. 66% of retail investor accounts lose money when trading CFDs with this provider. You should consider whether you understand how CFDs work and whether you can afford to take the high risk of losing your money.
Stratos Europe Ltd (tradu.com ):
CFDs are complex instruments and come with a high risk of losing money rapidly due to leverage. 66% of retail investor accounts lose money when trading CFDs with this provider. You should consider whether you understand how CFDs work and whether you can afford to take the high risk of losing your money.
Stratos Global LLC (tradu.com ):
Losses can exceed deposits.
Please be advised that the information presented on TradingView is provided to Tradu (‘Company’, ‘we’) by a third-party provider (‘TFA Global Pte Ltd’). Please be reminded that you are solely responsible for the trading decisions on your account. There is a very high degree of risk involved in trading. Any information and/or content is intended entirely for research, educational and informational purposes only and does not constitute investment or consultation advice or investment strategy. The information is not tailored to the investment needs of any specific person and therefore does not involve a consideration of any of the investment objectives, financial situation or needs of any viewer that may receive it. Kindly also note that past performance is not a reliable indicator of future results. Actual results may differ materially from those anticipated in forward-looking or past performance statements. We assume no liability as to the accuracy or completeness of any of the information and/or content provided herein and the Company cannot be held responsible for any omission, mistake nor for any loss or damage including without limitation to any loss of profit which may arise from reliance on any information supplied by TFA Global Pte Ltd.
The speaker(s) is neither an employee, agent nor representative of Tradu and is therefore acting independently. The opinions given are their own, constitute general market commentary, and do not constitute the opinion or advice of Tradu or any form of personal or investment advice. Tradu neither endorses nor guarantees offerings of third-party speakers, nor is Tradu responsible for the content, veracity or opinions of third-party speakers, presenters or participants.

EUR/USD Holds Firm Near 1.1700 Amid Trade TensionsFundamental analysis
The EUR/USD pair remains buoyant near 1.1700 in todays Asian session, extending monday’s gains as the US Dollar weakens sharply amid renewed US-EU trade tensions.
The US Dollar Index (DXY) is treading water around 97.88, down from its recent one month high of 99.00, as risk sentiment deteriorates following reports that President Trump is pushing for tariffs of 15%-20%, above the previously discussed 10%. Additionally, his unwillingness to ease the 25% auto levy has triggered a more aggressive EU stance, with Germany joining France in calling for retaliatory measures.
On the monetary policy front, markets are focused on the European Central Bank (ECB), which is widely expected to keep rates unchanged on Thursday. However, President Christine Lagarde’s guidance will be crucial for gauging the euro’s direction in the second half of the year.
Meanwhile, traders in the US remain confident that the Federal Reserve will leave its benchmark rate at 4.25%–4.50% in next week’s meeting, further limiting upside for the dollar.
Technical analysis
EUR/USD remains caught within a pivotal range, with directional conviction still lacking as momentum indicators remain subdued.
Upside Potential
The pair must vault above the 2025 high of 1.1830 (July 1) to open the path toward the June 2018 peak at 1.1852. A sustained break above this dual resistance zone would likely encourage a bullish continuation, targeting fresh multi-year highs.
Downside Risk
Conversely, a breach of July’s base at 1.1556 would weaken the current structure and potentially trigger a deeper pullback:
Initial support emerges at the 55-day moving average near 1.1485. Below that, the May 29 weekly low at 1.1210 offers the next significant floor. A failure to hold these levels could expose the psychologically critical 1.1000 handle, a key long-term support.
The forecasts provided herein are intended for informational purposes only and should not be construed as guarantees of future performance. This is an example only to enhance a consumer's understanding of the strategy being described above and is not to be taken as Blueberry Markets providing personal advice.

EURUSD – Is the rally over? Time for a collapse?The technical picture reveals that EURUSD is losing momentum after a brief rebound. The 1.1700 level stands as a key resistance – if bulls fail to break it, the bears will take the wheel! A clear scenario is forming: lower highs, FVGs filled, and a potential drop toward the 1.1580 support zone this week.
The bad news for the euro isn’t over: yesterday’s Eurozone PMI data disappointed heavily, signaling stagnating growth. Meanwhile, the USD is gaining traction from strong labor data and hawkish Fed remarks, putting EURUSD under double pressure.
If the ascending trendline breaks, EURUSD could plunge even further – get ready for a potential breakdown!
Suggested strategy: Prioritize SELL below 1.1700, with a short-term target at 1.1580.
Stop-loss: Above 1.1720 – a breakout here would invalidate the bearish setup.
EURUSD Breaks Bullish Structure – Here’s My Trade Plan📍 Watching EURUSD closely—it's recently broken bullish (market structure) on the daily timeframe 📈.
I’m now waiting for a retrace into a fair value gap, watching for the rebalance and a possible support zone touch before the next leg up 🔄🟢.
🎥 In this idea, I walk you through:
🔍 Price action
🧱 Market structure
📊 Trend direction
📋 And my personal trade plan for this setup
Not financial advice ❌💼


eurusd lopngBuying from fresh demand zone after bullish structure break.
Daily showing strong momentum, 1H confirms continuation with clean break and retest zone.
📍Entry: Demand zone
🎯 Target: 2R
🛑 SL: Below demand zone
Risk-Reward: Favorable setup aligning with higher timeframe bias.
EUR/USD: Bearish Trend in FocusHello everyone, what are your thoughts on EUR/USD?
From my personal analysis, it's clear that EUR/USD is extending its downtrend. The pair is trading around 1.164 and is under pressure from sellers after breaking below both the EMA 34 and EMA 89, with EMA 34 already turning downward — a classic bearish signal.
On the macro side, the European Central Bank is set to announce its monetary policy decision on Thursday. Meanwhile, U.S. President Donald Trump's ongoing trade tensions may add further uncertainty to the market. This corrective downtrend in EUR/USD could very well continue in the weeks ahead.
What do you think — will EUR/USD keep falling?
EUR/USD long: The Fed Chair debacle is getting spicyHello traders
My previous EUR/USD long did not pan out but I am swinging again. My entry order at 1.0563 was filled by the skinny skin of my teeth but so far so good. I'll use a trailing stop for this trade.
The pressure on Fed Chair Powell is being ramped up by Trump's attack dogs with allegations of mismanaging Federal funds(gasp :) ) during the FOMC headquarters.
We all saw the result of the rumor that Powell was fired/is considering resigning yesterday and as much as I am sure it pained DJT, he had to refute the rumor, no doubt on advice from Bessent.
In addition, FOMC board member Waller publicly dissented today and suggested a rate cut at the July meeting.
On the economic calendar we have the ECB rate decision, JOLTS, ADP and finally FOMC over the next two weeks.
This is purely a technical play but I am keeping a close eye on the bond markets, the
CME FedWatch tool and as for trade and tariffs, who cares...
I mentioned the Federal Court of Appeals case regarding the IEEPA court decision starting on 7/31/2025. For anyone interested in the court's decision,
www.cafc.uscourts.gov
More importantly, you can sign up for a notification at courtlistener.com which is a free service.
I have used it in the past and not only is it free but I also received the notification in a very timely manner.
www.courtlistener.com
Best of luck.

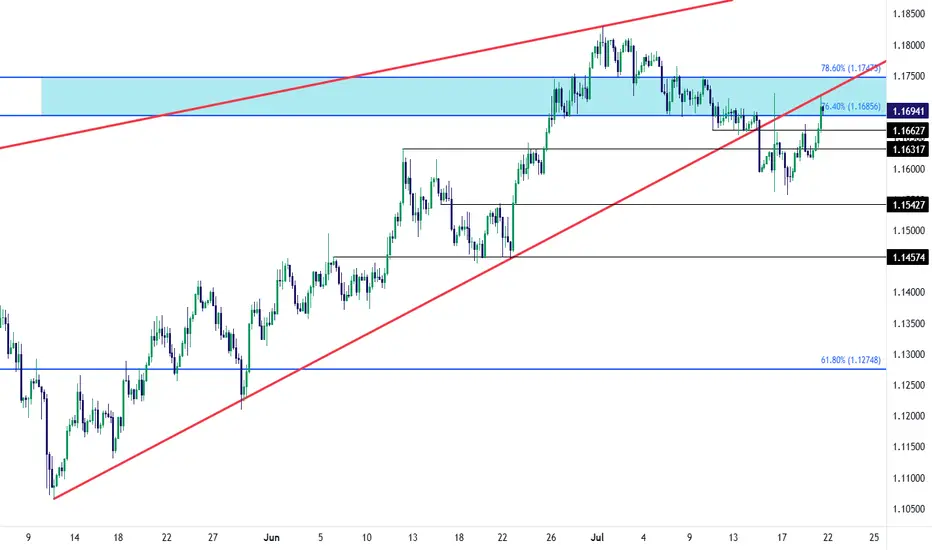
EUR/USD Recovery into Resistance TestEUR/USD bears had an open door to make a run last week and, so far, they've failed. The Wednesday turn around Trump's threat to fire Jerome Powell certainly made a mark, but the question now is whether the USD can respond to support at a longer-term trendline; and, in turn, EUR/USD is now testing in the zone between 76.4 and 78.6% Fibonacci retracements of the 2021-2022 major move.
There's also the underside of the falling wedge pattern that's now coming in as resistance as taken from prior support. The next resistance level overhead is the 1.1748 level, which is the 78.6% retracement that had offered both resistance and support with short-term price action in the pair. - js

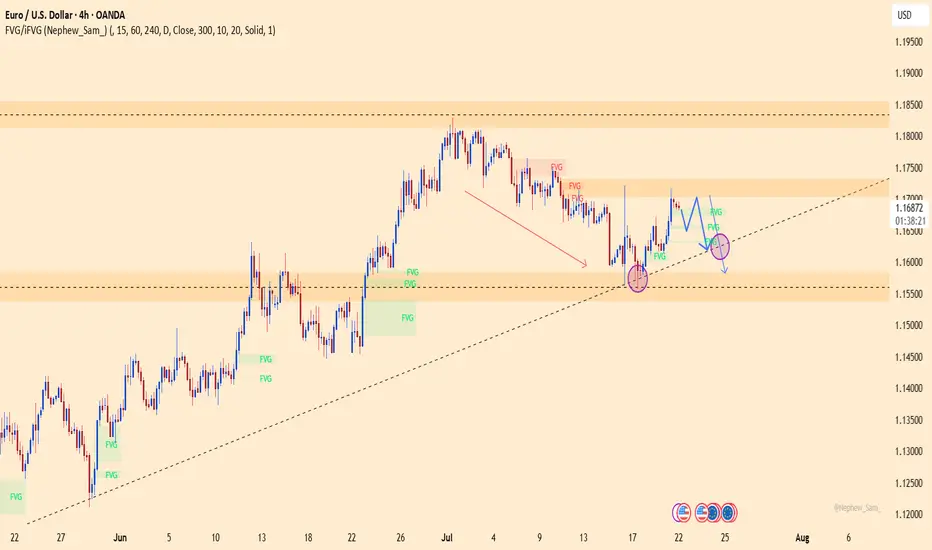
EURUSD - Parallel channel in play!The following chart offers a closer look at the current structure of the EUR/USD pair on the 4-hour timeframe. Price action has been respecting a well-defined bearish parallel channel, which has provided clear boundaries for both resistance and support. Based on the ongoing reaction to these levels, we outline both bullish and bearish scenarios that could unfold in the coming sessions.
Bearish Parallel Channel
Since June 30, EUR/USD has been consistently moving within a downward-sloping bearish parallel channel. Each attempt to break above the upper boundary of the channel has been rejected, while the lower boundary continues to act as dynamic support. This sustained rejection from the upper trendline confirms the strength of the bearish momentum currently at play. The pair remains structurally weak unless a clean breakout to the upside occurs, accompanied by strong bullish confirmation.
Bullish Scenario
A potential bullish reversal could materialize if EUR/USD manages to hold above the 4-hour Fair Value Gap (FVG) located between 1.1620 and 1.1600. This zone may provide the necessary support for the bulls to step in. If the price maintains strength within or just above this FVG and buyers begin to show dominance, a rebound toward the upper boundary of the channel could occur. A successful breakout above the channel could then trigger a stronger rally, possibly targeting the 1.1750–1.1800 region, marking a clear shift in short-term momentum.
Bearish Scenario
Conversely, if the pair fails to hold the 4-hour FVG between 1.1620 and 1.1600 and closes a strong bearish 4-hour candle below this zone, the market may be setting up for further downside. This would suggest a rejection of the FVG as resistance and open the path for a drop toward the lower end of the channel. Interestingly, this area also aligns with a previously established larger 4-hour FVG. A move into this deeper FVG could present a more favorable zone for a longer-term bullish reversal, as it offers a stronger liquidity pool and potential demand area.
Final Thoughts
The EUR/USD pair is at a critical juncture. Price is hovering near a key support zone within a bearish channel that has defined its movement for several weeks. Whether bulls can hold this support and break above the channel, or bears take control and push it lower toward the broader 4-hour FVG, will determine the next major directional move. Traders should closely monitor price action around the 1.1620–1.1600 level for clues on the likely breakout direction.
--------------------------
Disclosure: I am part of Trade Nation's Influencer program and receive a monthly fee for using their TradingView charts in my analysis.
Thanks for your support. If you enjoyed this analysis, make sure to follow me so you don't miss the next one. And if you found it helpful, feel free to drop a like and leave a comment, I’d love to hear your thoughts!

EUR/USD AccumulationOn the 5-minute timeframe, buying activity initiates, signaling the potential end of the downtrend. The first indication of upward momentum appears following the formation of a range and a subsequent liquidity sweep. Price then retests the prior low with diminished volume but fails to break below it, suggesting that selling pressure is being absorbed by buyers. This behavior reflects accumulation by informed participants positioning for a move higher. As demand begins to outweigh supply, clear signs of strength emerge
Entry: 1.15765
Take Profit: 1.16279
Stop Loss: 1.15621

EURUSD Will the 1D MA50 hold?The EURUSD pair seems to be rebounding just before a 1D MA50 (blue trend-line) test, which is its short-term Support. At the same time it bounced off the 0.382 Fibonacci retracement level, which after a +6.92% rise, it resembles the March 27 rebound.
The 1D RSI is printing a standard bullish reversal setup, seen already 4 times since February, and a break above its MA will confirm it.
As long as the 1D MA50 holds, it may extend the uptrend to a new Channel Up (dashed), outside the blue one that may look for a new +6.92% rise. In that case our Target will be 1.21000.
If the 1D MA50 breaks, we will add one last buy at 1.14000, near the 1D MA100 (green trend-line).
-------------------------------------------------------------------------------
** Please LIKE 👍, FOLLOW ✅, SHARE 🙌 and COMMENT ✍ if you enjoy this idea! Also share your ideas and charts in the comments section below! This is best way to keep it relevant, support us, keep the content here free and allow the idea to reach as many people as possible. **
-------------------------------------------------------------------------------
Disclosure: I am part of Trade Nation's Influencer program and receive a monthly fee for using their TradingView charts in my analysis.
💸💸💸💸💸💸
👇 👇 👇 👇 👇 👇
