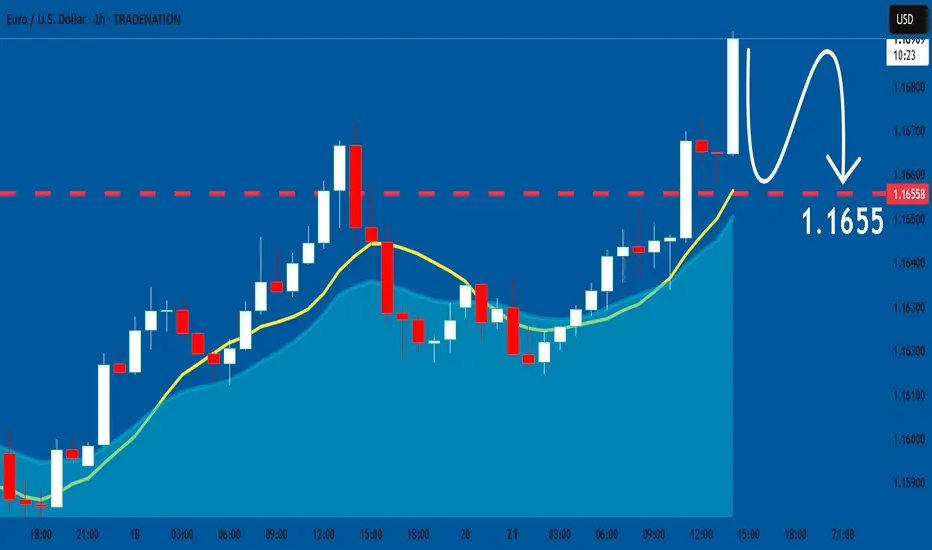
Analysis The market has gotten to the H1 FVG and idn it. Now we need to look for short opportunity. The lq has been taken.
EURUSD trade ideas

Eurusd is bullishSince there is a clear retest at the daily support which was previously resistance now we will look for buys only on EU up to the next round number level
Sell then Buy!Hello all. if market return right from here (IF IF IF IF), the response is the zone I have shown on the chart. I had no time to Optimize it. but enter with your confirmation method. I try to optimize it tonight (wink)

Long EURUSDI want to long EURUSD here, kinda looks nice.
Good risk reward, expecting a rejection in this area.
EURUSD at Channel resistance possible scenariosERUUSD is trading in a channel pattern and now the price has reached the Upper Resistance trendline. Will it break the resistance or follows the channel pattern again ? let us see. Buy at breakout or sella at breakdown.
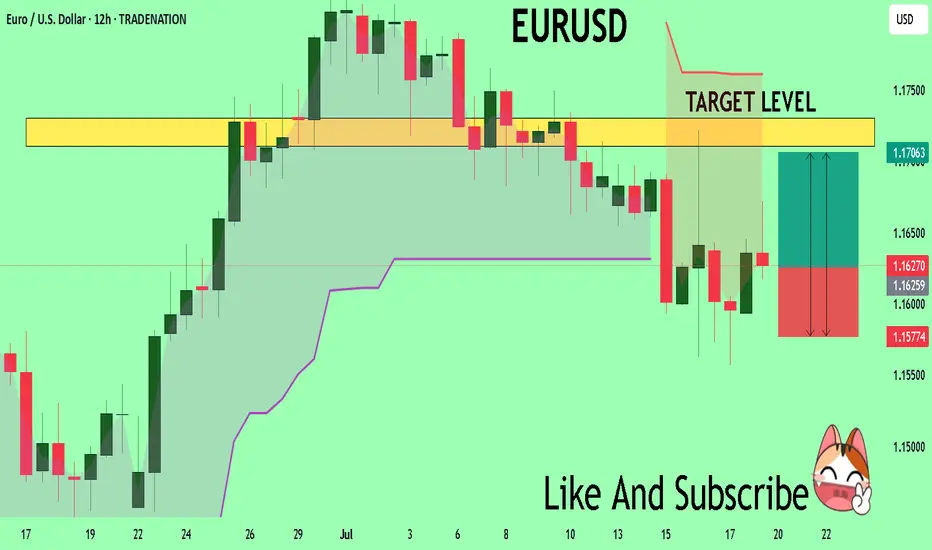
EURUSD Massive Long! BUY!
My dear friends,
Please, find my technical outlook for EURUSD below:
The price is coiling around a solid key level - 1.1627
Bias - Bullish
Technical Indicators: Pivot Points Low anticipates a potential price reversal.
Super trend shows a clear buy, giving a perfect indicators' convergence.
Goal - 1.1710
Safe Stop Loss - 1.1577
About Used Indicators:
The pivot point itself is simply the average of the high, low and closing prices from the previous trading day.
Disclosure: I am part of Trade Nation's Influencer program and receive a monthly fee for using their TradingView charts in my analysis.
———————————
WISH YOU ALL LUCK
EURUSD TRADE IDEA EURUSD pulled back for a trade to the upside.
We got involved on the trade at our Fibonacci level and we seem to be powering to the upside.
Let's see how the market does it's thing.

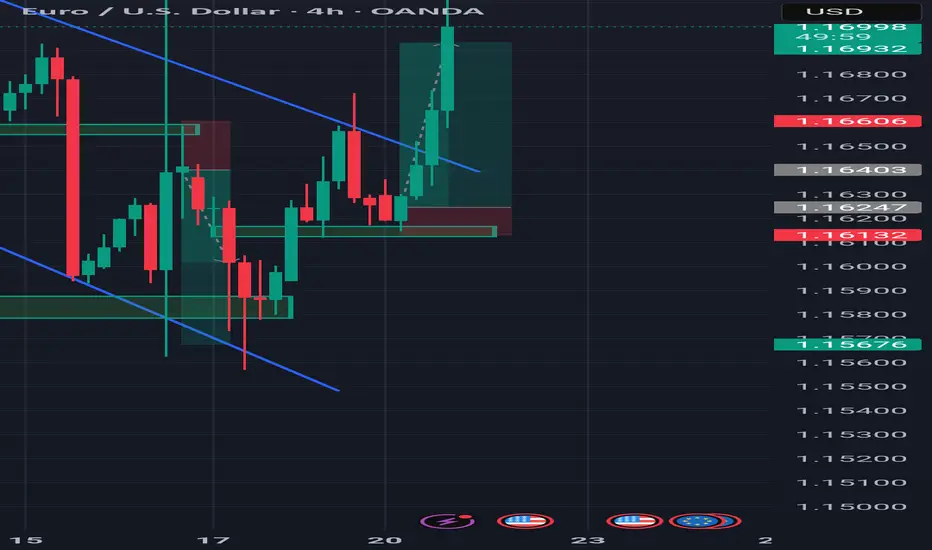
EURUSD Bullish ProjectionIt’s been a while since my last update here.
Here’s my projection and actual entry/entries on EURUSD, based on a sweep of the previous 1H swing low and mitigation of a Daily imbalance (Fair Value Gap).
We're anticipating a full Change of Character to mark the end of the ongoing Daily pullback.

EURUSD Forecast – Smart Money Setup 21st July 2025Here’s the detailed breakdown of my current EURUSD setup based on internal/external liquidity and order block reaction:
🔹 Bias: Bullish (after deeper retracement)
🧠 Breakdown:
Liquidity Sweep ✅
A clear liquidity sweep took place below recent equal lows.
This sweep triggered a bullish displacement, confirming demand.
Market Structure Shift (MSS) 🔁
A valid MSS followed the sweep, confirming short-term reversal in structure.
4H Internal Liquidity 🫧
Price tapped into internal liquidity, setting the stage for a deeper retracement before continuation.
15 Min Order Block (OB) 🧱
Price is currently trading within a 15-minute OB zone, which aligns with minor resistance before a deeper retrace.
🔻 Anticipated Retracement:
Expecting a short-term rejection from the current OB zone.
Price may retrace into the 4H OB zone near 1.1590–1.1610, aligning with an upcoming 4H liquidity pool.
This zone also aligns with previous mitigation and accumulation areas.
🟢 Final Target:
If the 4H OB holds, I'm anticipating a bullish continuation targeting the external 4H liquidity near 1.1730+.
📌 Summary:
Waiting for retracement into demand zone → looking to long from 1.1590–1.1610 area → targeting 1.1730+.
✍️ Execution Plan:
Set alerts near 1.1610
Look for LTF CHoCH or BOS confirmation in demand
Enter with tight stop loss below 4H OB
Target external liquidity

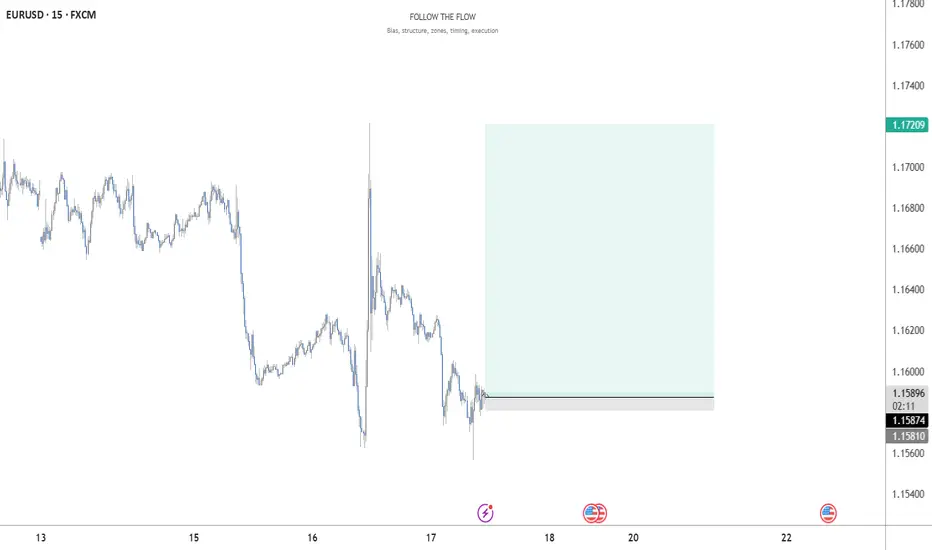
EUR/USD LIVE TRADE UPDATE📍Trade in Progress – Key S/R Retest
Price is currently pulling back into the same S/R zone we sold from.
If price breaks and closes above this zone, the setup could be invalidated.
However, this level has shown strong historical structure, and we may see a rejection here.
We’re watching closely for:
A sign of momentum turning
A potential engulfing candle confirming rejection
📌 A strong zone can hold—but we don’t guess. We observe and react with discipline.

EURUSD: Expecting Bearish Movement! Here is Why:
Balance of buyers and sellers on the EURUSD pair, that is best felt when all the timeframes are analyzed properly is shifting in favor of the sellers, therefore is it only natural that we go short on the pair.
Disclosure: I am part of Trade Nation's Influencer program and receive a monthly fee for using their TradingView charts in my analysis.
❤️ Please, support our work with like & comment! ❤️
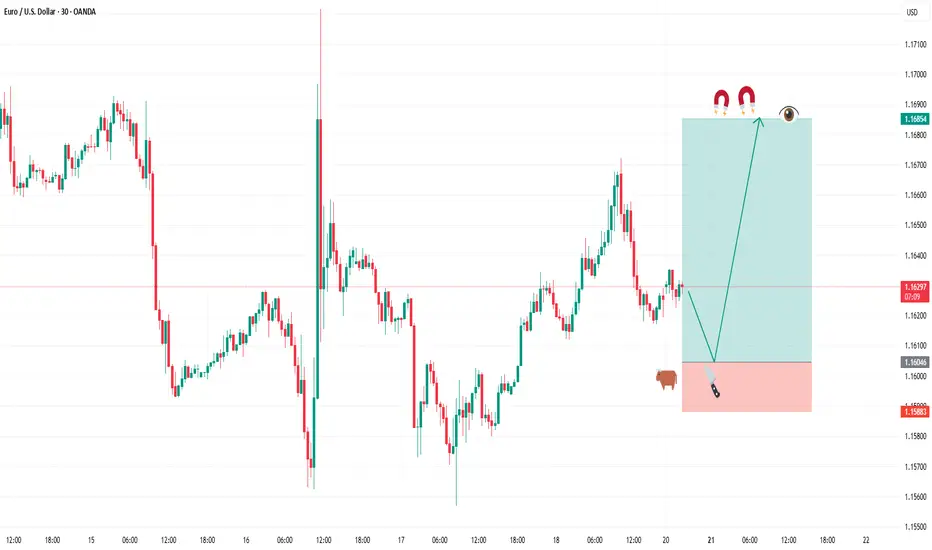
BUY FIBERGreetings traders, today we are looking for buys on EURUSD. Our first entry is at 1.16288 and second entry will be lower at 1.16046 our target is 1.16854 and stops are below 1.15883. use proper risk management and best of luck.
This trade is based on a fine tuned DAILY approach to the algo. Be careful and risk wisely.
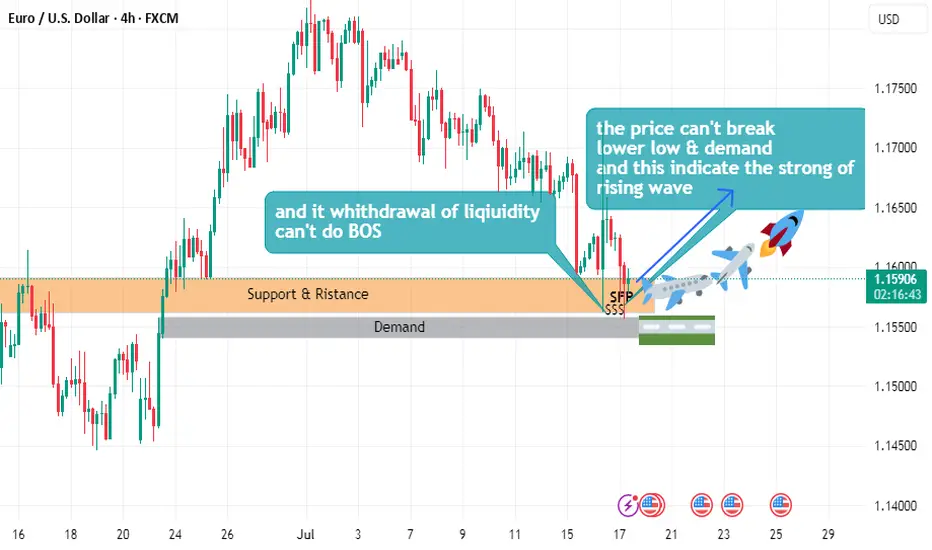
EURUSD buy plane Setuphello
the price can't break lower low
and can't demand
and this indicate the strong of uptrend wave
and it withdrawal of liquidity
and can't do beak of structure
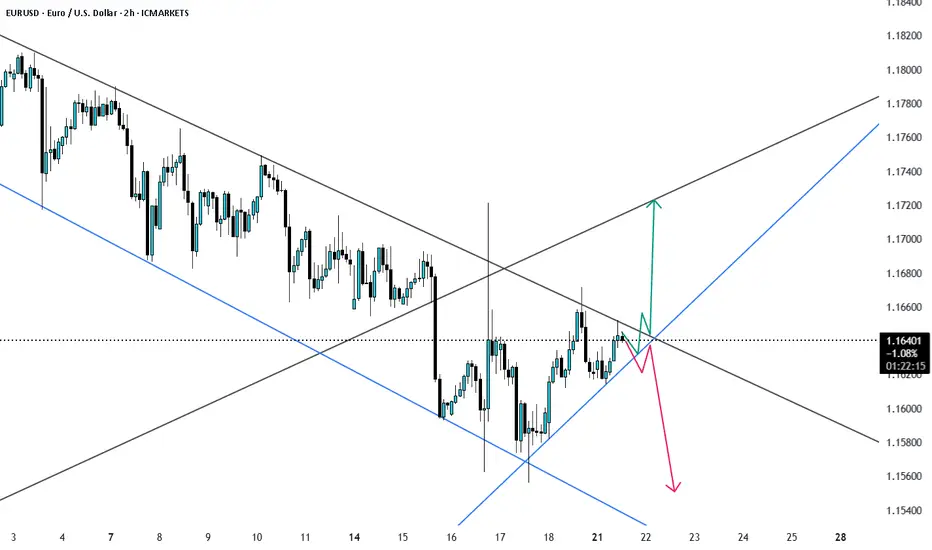
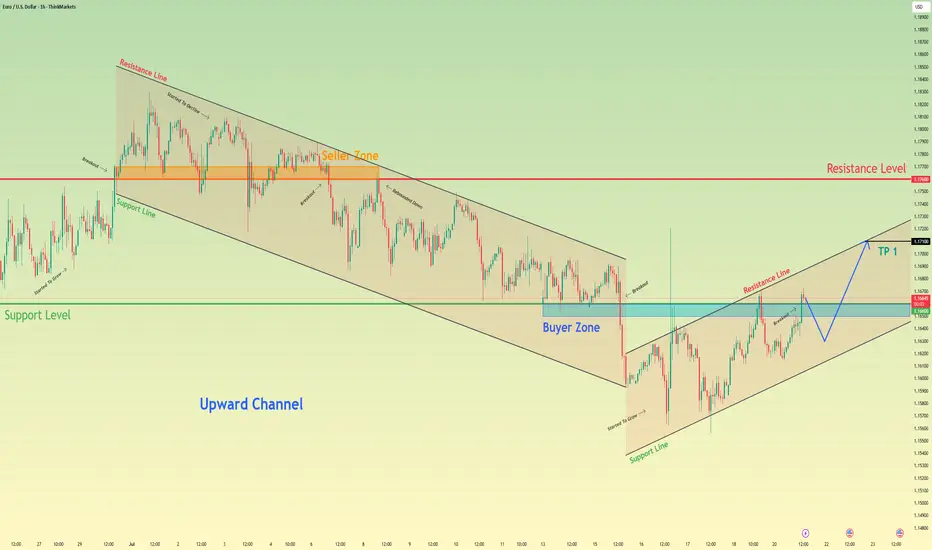
Euro may correct a little and then continue to rise in channelHello traders, I want share with you my opinion about Euro. Observing the recent price action, we can map out a clear transition in market structure. Previously, the pair was contained within a well-defined downward channel, where the seller zone around the 1.1760 resistance level consistently capped rallies, leading to multiple breakdowns and correctional movements. However, after a final push lower, the dynamic shifted, with the price action showing a clear downtrend-to-uptrend reversal. Currently, the euro has established a new upward channel, finding solid ground in the buyer zone around the 1.1660 support level. The price is now engaged in a constructive upward movement within the boundaries of this new channel. The prevailing hypothesis is that after a potential minor correction towards the channel's support line, the pair will resume its ascent. Therefore, the take-profit target for this scenario, tp 1, is strategically placed at 1.1710, as this level directly corresponds with the resistance line of the current upward channel, representing a logical point for price to react. Please share this idea with your friends and click Boost 🚀
Disclaimer: As part of ThinkMarkets’ Influencer Program, I am sponsored to share and publish their charts in my analysis.

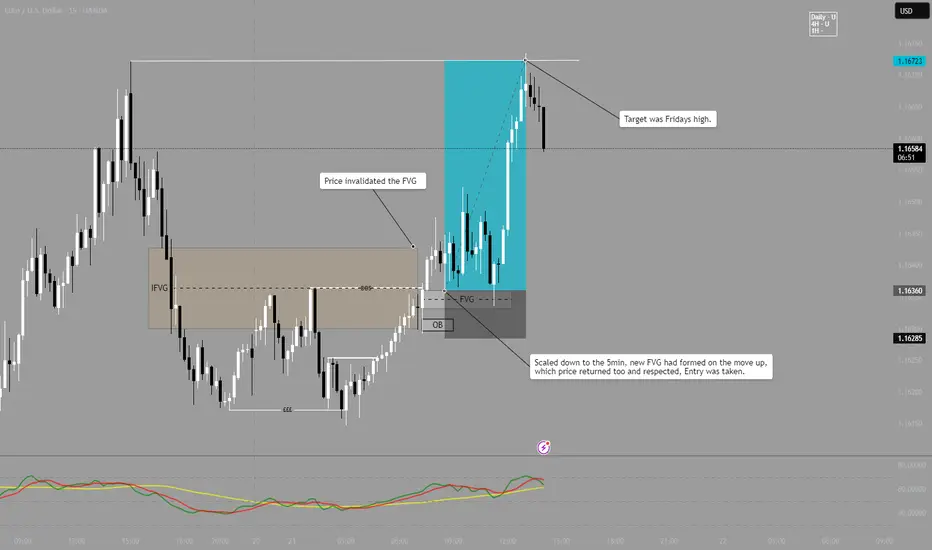
EUR/USD LONG - Follow upAs can be seen, Price invalidated the FVG, indicating a bullish momentum.
After price broke, I then look at the 5 minute for a precise entry.
On the 5m an FVG had been created on the initial move up, price then returned to this area and an entry long was taken.
Target was Fridays Highs.
Note - This is published on the 15m as it wont allow to post with 5m timeframe.