EUR/USD Analysis – Hunting a Buy Opportunity from a Key Zone💹 EUR/USD Analysis – Hunting a Buy Opportunity from a Key Zone 🇪🇺💵
After a correction and drop from the recent high, the Euro is approaching a major support area and the Buy Zone.
My scenario: If price reaches this area and confirms with price action, I expect a strong rebound towards higher targets.
📌 Key points:
Short-term bearish structure, but correction nearing completion
Support zone overlapping with Fibonacci confluence
Potential target above the previous high
⚠️ This is a personal view, not financial advice. Always apply risk management.
❓ What do you think? Could this correction be the start of a bullish rally, or will the drop continue?
------------------------------------------------------------------------------------------------------
🚀 Who am I?
I'm Mahdi, a prop firm trader with 7+ years of experience in technical analysis, mainly focusing on Smart Money Concepts and Elliott Wave theory.
I specialize in delivering high-quality trading signals, market insights, and educational content tailored for serious traders and investors.
📊 My Tools: SMC, Elliott Wave, Fibonacci, Liquidity Grabs, Order Blocks
💼 Prop Challenge Passed: Yes | Funded Account: In Progress
🔗 Follow for consistent updates and trading insights.
EURUSD trade ideas

EURUSD Trade Plan 11/08/2023(+500 Pips!!!)Dear Trader,
Dear Trader ,
Price Almost Hit Top of Descending channel , and I expect the price to enter a corrective phase from the range of 1.16600-1.17200 towards targets of 1.14500, 1.13500, and 1.12000. A good selling opportunity will arise.
Sell Area : 1.16600-1.17200
TP : 1.1.14500
TP : 1.13500
TP : 1.1200
SL : Above 1.17500
regards,
Alireza!

EURUSDPreferably suitable for scalping and accurate as long as you watch carefully the price action with the drawn areas.
With your likes and comments, you give me enough energy to provide the best analysis on an ongoing basis.
And if you needed any analysis that was not on the page, you can ask me with a comment or a personal message.
Enjoy Trading ;)

EURUSD: SELL OPPORTUNITYEUR/USD trading below a major resistance level and after pulling back to the broken trendline, we're seeing a scenario for short-term chop consolidation before potentially resuming the bearish move toward lower lows .
As long as price stays beneath the 1.1700 resistance level, the bearish bias remains intact.

Sell eurusd Strong selling wave coming
And we expecting the euro weakening among all cross pairs
Bearish correction just started now
Daily buy trend already breaks and changed the trend now

EVENING FORECASTINGHey traders I have just shared the processess I normally do when it comes to wesday so that you can look the process behind when doing all of these work and if you have any questions please do let me know I am more than happy to help and give some clear details just comment and will get back to you!

EURUSD- BUY NowEURUSD Buying Setup Continues . It is expected that it will complete the Weekly candle Range and then reversal is expected. 50% target can be acheived following this trading signal. :) what are your thoughts?

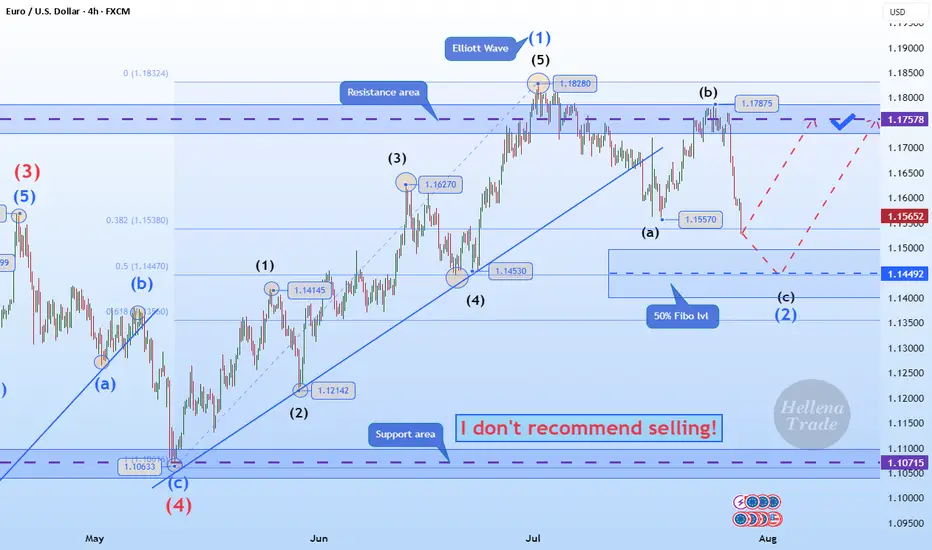
Hellena | EUR/USD (4H): LONG to the resistance area 1.17578.Colleagues, the price has made a strong downward movement, which can only mean one thing: the correction is not complete.
This means that the latest upward movement is wave “1” of medium order.
Therefore, I now expect the correction to end in wave “2” at the 50% Fibonacci level and thean upward movement to continue to at least the resistance level of 1.17578.
It is quite possible that after updating the level of 1.15570, the price will immediately begin an upward movement — this is a more risky option for entering a position.
Manage your capital correctly and competently! Only enter trades based on reliable patterns!
10-08-2025 _ Short Term Bullish Idea _ EURUSD H41- Bullish Divergence on H4.
2- Followed by series of HHs and HLs.
3- We are looking for correction followed by a move to the upside.

EURUSD continues its uptrendYesterday, EURUSD extended its climb, reaching 1,1699.
The trend remains firmly bullish, with buying opportunities being the only viable option.
Watch for a pullback and a continuation towards the next target.
Look for a favorable risk-to-reward ratio and manage your risk carefully.

EUR USD Trade Setup 1 hour timeframe EUR USD has formed a Double Top Break and Retest on the 1 hour timeframe.
additionally, the retest level also align with the 0.618-0.50 Fib Retracement level.
Ensure to wait for entry confirmation on the retest level before selling....

EUR/USD H8 AnalysisWe have seen a change in sentiment for EUR/USD which was printing higher highs and lows throughout May and June this year.
Now we are seeing lower highs and lows as sellers take control.
Wait for price to make the next lower high and look a trade that meets your strategy rules.

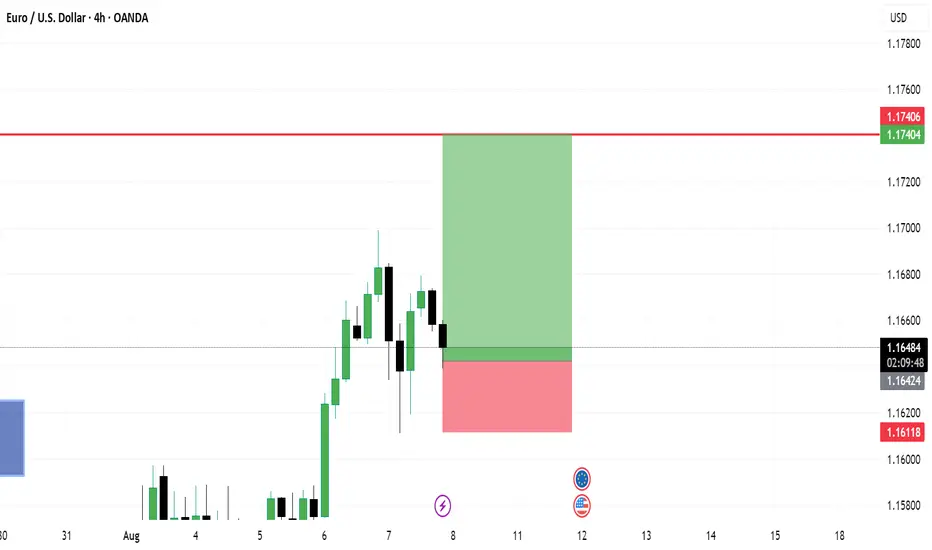
Eurusd📊 EUR/USD – H4 Detailed Analysis
On the H4 timeframe, EUR/USD has formed a clear Change of Character (CRT), indicating a possible shift in market structure.
Right next to this CRT, we identified a Fair Value Gap (FVG) – a strong imbalance zone that often acts as a high-probability reaction point.
Today, as soon as price came back to retest the H4 FVG, we executed a sell entry from our pre-marked zone.
This trade was planned in advance based on market structure and smart money concepts.
Why this setup is important:
• CRT shows a break in previous bullish structure.
• FVG retest often provides a precise entry with tight risk.
• Alignment on H4 increases trade reliability.
Now, we will manage the trade according to our plan — letting the market play out without emotional interference.
📌 Key Takeaway: Patience to wait for the retest, and discipline to execute only when the setup is complete, is what separates consistent traders from the rest.


Tecnical analysis EURUSD 4HIt is expected that the price will start to move downwards to the support area of 1.1300 upon reaching the resistance range between 1.17100 and 1.17500 and forming a suitable setup.

EUR/USD Analysis:The pair is moving sideways between the 1.169 resistance zone and the 1.162 support zone.
A break and hold above 1.169 could push the price to test 1.177.
A break below 1.161 and stability beneath it may lead to a retest of 1.157, followed by 1.153, which is a potential bounce area.
⚠️ Disclaimer:
This analysis is not financial advice. It is recommended to monitor the markets and analyze the data carefully before making any investment decisions.

EURUSD possible bearish for 1.1200#eurusd forming lower high and lower low in daily time frame. Price broke 1.1557 & 1.1447 support level. 1.1738-1788 daily supply zone for sell. there are many different support levels before 1.1200 level i.e. 1.1550, 1.1420, 1.1255 & 1.1200. 1.1430-20 is secure level to book profit in sell trade.

EURUSD: Market of Sellers
The price of EURUSD will most likely collapse soon enough, due to the supply beginning to exceed demand which we can see by looking at the chart of the pair.
Disclosure: I am part of Trade Nation's Influencer program and receive a monthly fee for using their TradingView charts in my analysis.
❤️ Please, support our work with like & comment! ❤️

ELLIOTT WAVE EURUSD Daily update
EW Trade Set Up daily
minute ((i)) seems finished
H4 scenario 210725:
the price upward movement from 1.1557 area on 17/07/25 has broken decisively 1.1684-1.1705 area but it had not the
strenght to go further so that the lagging span (green line) could break upward the leading span B (red line).
A decrescent high has been registered at 1.1800 area on 24/07/25.
In this new scenario it looks like that the impulsive movement that started from 1.0180 on 13/01/25
finisced at 1.1834 on 010725 in the minute wave (i). (EWO divergence, break down of the upward (ii)/(iv) channel).
So i have to register that a correction to minute wave ((ii) has started
key levels VP area
1.1800
1.1370 POC
1.0850
note :
monitor the price reaction at any supports level: VP area and LVN

2HR ORDERBLOCK BULLISH ORDERFLOW EURUSD WEEK OF 8/4/25note: previously in the week of 7/28 we wanted to snipe the 4hr orderblock reversal candle...
not waiting for price action to truly consolidate/mitigate in that zone.
FOMC dropped price further than expected.... this is why to stay with trend/orderflow until it is confirmed the ORDERFLOW as switched. BIG BANK ENTRIES AND BIG TIMEFRAME ORDERFLOWS.. ..;
once price breaks out there is no rush to get in... knowing it has to continue to the next KEY higher timeframe orderflow/liquidity, you can easily wait for price to RANGE and consolidate on lowertimeframe forming and ORDERBLOCK for an entry.
if you have a normal broker account or a swing prop firm account you are able to CATCH A SNIPER ENTRY OFF ORDERBLCK AND HOLD TO HIGHER TIMEFRAME TARGET ZONE.

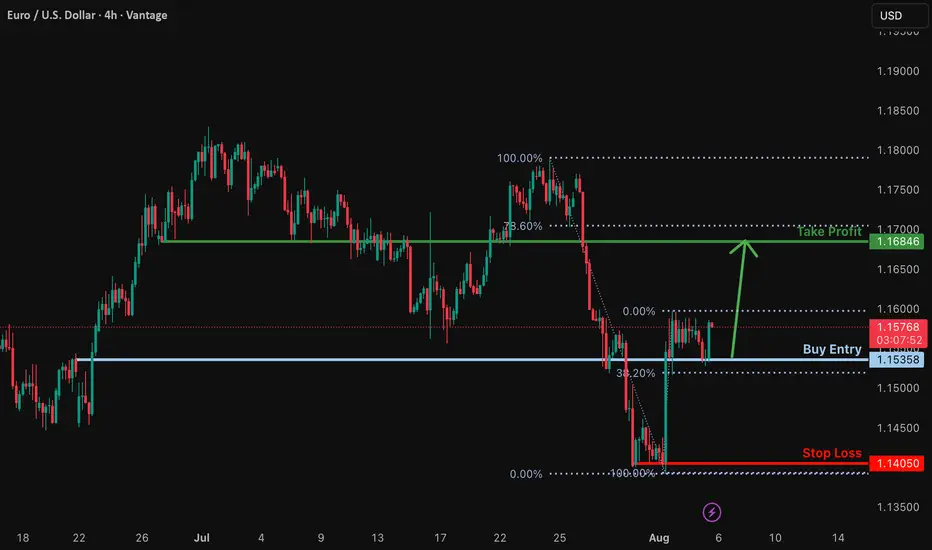
Bullish rise?EUR/USD has bounced off the support level, which is a pullback support that is slightly above the 38.2% Fibonacci retracement, and could rise from this level to our take profit.
Entry: 1.1535
Why we like it:
There is a pullback support that is slightly above the 38.2% Fibonacci retracement.
Stop loss: 1.1405
Why we like it:
There is a swing low support.
Take profit: 1.1684
Why we like it:
There is a pullback resistance that is slightly below the 78.6% Fibonacci retracement.
Enjoying your TradingView experience? Review us!
Please be advised that the information presented on TradingView is provided to Vantage (‘Vantage Global Limited’, ‘we’) by a third-party provider (‘Everest Fortune Group’). Please be reminded that you are solely responsible for the trading decisions on your account. There is a very high degree of risk involved in trading. Any information and/or content is intended entirely for research, educational and informational purposes only and does not constitute investment or consultation advice or investment strategy. The information is not tailored to the investment needs of any specific person and therefore does not involve a consideration of any of the investment objectives, financial situation or needs of any viewer that may receive it. Kindly also note that past performance is not a reliable indicator of future results. Actual results may differ materially from those anticipated in forward-looking or past performance statements. We assume no liability as to the accuracy or completeness of any of the information and/or content provided herein and the Company cannot be held responsible for any omission, mistake nor for any loss or damage including without limitation to any loss of profit which may arise from reliance on any information supplied by Everest Fortune Group.
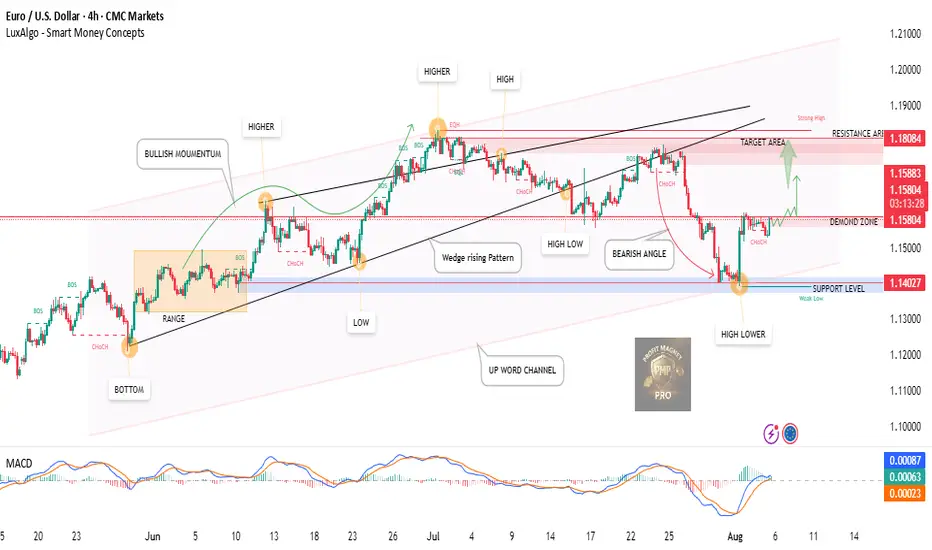
EUR/USD Bullish Breakout 4H 5Aug2025 | Targeting 1.18084EUR/USD has shown clear bullish momentum after bouncing off the support level at 1.14027, marking a higher low within a confirmed demand zone.
Key confirmations:
✅ CHoCH (Change of Character) confirms reversal.
✅ MACD crossover indicating bullish pressure.
✅ Breakout expected towards the target area (1.18084).
✅ Support from wedge breakout & upward channel.
📈 Eyeing a push to retest strong resistance near the previous high.
Plan:
Watch for consolidation or retest near 1.1580–1.1600 before entry. Bullish continuation likely if price holds above the demand zone.
📌 Target: 1.18084
🛑 Invalidation below: 1.14027
🕵️♂️ Monitor price action near demand zone and wait for bullish confirmation candle for optimal entry