EURUSD--SHORT--Dollar index is rising so it is time to short EURUSD
--my favorite set-up as shown on chart
EURUSD trade ideas


EURUSD SWING SETUP EURUSD has Pulled back into critical level thats a Fib zone and also a daily FVG With a charts pattern price action thats a rising wedge. Any breakout we see from the wedge could led to a deep fall on the EURUSD

EURUSD: Will Go Up! Long!
My dear friends,
Today we will analyse EURUSD together☺️
The market is at an inflection zone and price has now reached an area around 1.16337 where previous reversals or breakouts have occurred.And a price reaction that we are seeing on multiple timeframes here could signal the next move up so we can enter on confirmation, and target the next key level of 1.16551.Stop-loss is recommended beyond the inflection zone.
❤️Sending you lots of Love and Hugs❤️

EUR/USD: Volume Accumulation Setup at Support LevelOn EUR/USD, it's nice to see a strong support at the price of 1.1581.
This level marks the weekly Point of Control, where the heaviest volumes from last week were traded, showing strong buyer accumulation. Buyers who entered here later pushed the price up aggressively, and if the price returns to this area, they will likely defend it and push the market up again.

Bullish rise?The Fiber (EUR/USD) is falling towards the pivot and could bounce to the 1st resistance.
Pivot: 1.1591
1st Support: 1.1391
1st Resistance: 1.1811
Risk Warning:
Trading Forex and CFDs carries a high level of risk to your capital and you should only trade with money you can afford to lose. Trading Forex and CFDs may not be suitable for all investors, so please ensure that you fully understand the risks involved and seek independent advice if necessary.
Disclaimer:
The above opinions given constitute general market commentary, and do not constitute the opinion or advice of IC Markets or any form of personal or investment advice.
Any opinions, news, research, analyses, prices, other information, or links to third-party sites contained on this website are provided on an "as-is" basis, are intended only to be informative, is not an advice nor a recommendation, nor research, or a record of our trading prices, or an offer of, or solicitation for a transaction in any financial instrument and thus should not be treated as such. The information provided does not involve any specific investment objectives, financial situation and needs of any specific person who may receive it. Please be aware, that past performance is not a reliable indicator of future performance and/or results. Past Performance or Forward-looking scenarios based upon the reasonable beliefs of the third-party provider are not a guarantee of future performance. Actual results may differ materially from those anticipated in forward-looking or past performance statements. IC Markets makes no representation or warranty and assumes no liability as to the accuracy or completeness of the information provided, nor any loss arising from any investment based on a recommendation, forecast or any information supplied by any third-party.

EUR/USD Chart Breakdown – Explained Like You're 5!📉 Big money doesn't move randomly – it follows patterns. In this short, I break down a real EUR/USD trade setup like a pro trader would explain it to a curious kid.
✅ Watch how institutional players trap retail traders
✅ Learn the psychology behind accumulation & distribution
✅ Find out why the market may drop toward 1.15030
✅ Explained in the simplest, most relatable way!
If you're tired of complicated chart talk — this one’s for YOU.
📍EUR/USD Forex Setup | Day 9 | Smart Money Concept | Price Action
🔔 Follow for daily breakdowns and market psychology

EurUsd Shorts... 'ICT Fair value gap Trade'After a steady gain in prices on EURUSD market this week volume seems to subside signaling a possible end of the retracement and the continuation down looking imminent. A 200 pip drop looking possible in the following days. Stay Sharp.

eurusd sell setupnot financial advice . follow at own risk.
possible 8rr at nearest daily swing low...16rr at target line

pretty cut and dry set upNot much explanation needed here, looking for a bearish move, 2:1 risk. Price failed to make a new high, impulsed down and is in a classic correction pattern, enter on break or wherever you feel comfortable. Good luck!


EURUSD, Will we be stopped again?Check out our previous analysis to get more info on the explanations.

EUR USD LONGHi guys, this pullback its a perfect time to entry and get the last operation for this week, good luck everyone.

EURUSD DAILY TIMEFRAME ANALYSIS 📊 Key Observations:
1. Uptrend and Trendline Support:
The pair was following a strong ascending trendline.
Price respected this trendline until it broke downwards, indicating a break of bullish market structure.
2. Break of Structure (BoS):
The chart marks a clear Break of Structure (BoS) below the trendline, signifying that buyers lost control and sellers stepped in.
This often suggests a potential trend reversal or at least a deeper correction.
3. Fair Value Gap (FVG):
A Fair Value Gap (imbalance) is highlighted between ~1.1680–1.1830.
This area represents a liquidity void where price moved too quickly in one direction and may return to "fill the gap".
Price is likely to retrace into this FVG, possibly touching the underside of the broken trendline (now resistance).
4. Bearish Retest Zone:
The FVG and trendline intersection make this a strong bearish retest zone.
If price reaches this level, it could act as a supply zone or area of resistance for further downside continuation.
---
🔁 What Could Happen Next:
✔️ Bullish Scenario (less likely without fundamentals):
Price breaks above the FVG and reclaims the trendline.
If that happens, bullish momentum could resume with 1.20+ as the target.
❌ Bearish Scenario (currently more probable):
Price retraces into the FVG zone and rejects.
This retest confirms the trendline as resistance.
Bearish continuation toward 1.1400, 1.1300, or even 1.1100 is likely.
---
🔑 Key Technical Levels:
Level Type Price Level (Approx)
FVG Upper Bound 1.1830
FVG Lower Bound 1.1680
Support 1 1.1400
Support 2 1.1300
Support 3 1.1065
---
🧠 Conclusion:
This chart shows a classic Smart Money Concept (SMC) setup:
Break of structure ➝ Retrace to FVG ➝ Potential bearish continuation. Watch how price reacts around 1.1680–1.1830. That zone will reveal if sellers are still in control.

EURUSD Possible Scénario EUR/USD is currently in a downtrend and trading within a developing channel pattern.
The structure isn’t fully formed yet, but a minor upward move is likely in the short term, toward a key resistance area where two resistance levels intersect.
This confluence increases the probability of a downward reversal from that zone.
However, in the event of NFP news triggering a bullish breakout above resistance, the pair could shift to the upside.
We’ll wait and see how price reacts at this critical level.

EURUSDPrice recently plunged into the deep and has now returned for fair value. We are already in a significant area, on a higher time-frame(1D), so any moment from now they can collapse it, much like last week! Be on the look-out like a meerkat!
1.1680 and 1.1720 are institutional price levels and price tends to have strong reactions in these areas. I expect to see that play out tomorrow.
The following reports will be used to trigger this move:
BoE Monetary Policy Report.
Continuing Jobless Claims 4-Week Average.
Initial Jobless Claims.
Unit Labour Costs.
Nonfarm Productivity.
Stay safe!

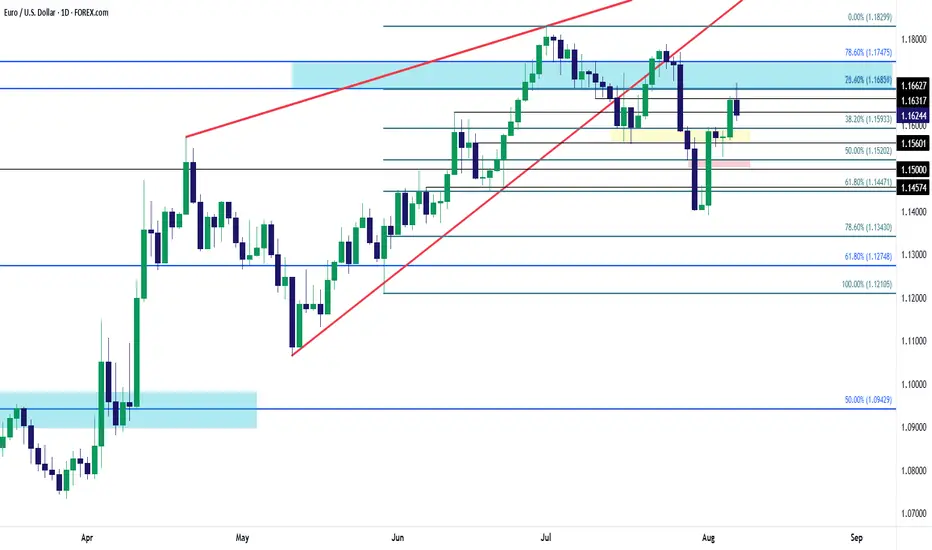
EUR/USD Fibonacci Resistance TestEUR/USD has put in a fast reversal over the past week following the 1.1400 test ahead of the NFP report on Friday. But the true test of trend is what happens in the counter-trend backdrops, so the question now is whether EUR/USD bulls can push through a key area of resistance that's come back into play.
At 1.1686 is the 76.4% retracement of the 2021-2022 major move. I've looked at that setup a few times in these pieces, and notably that Fibonacci sequence has shown a number of inflections and turns. Back in 2023, the 61.8% marker caught the highs. Last year, for a large portion of the year, the 38.2 and 50% levels marked a range. And then earlier this year, as parity calls were aplenty around EUR/USD, it was the 23.6% retracement that came into play in January to hold the low, with a higher-low and February which led to a strong reversal in March. So much for parity, eh?
Well since then the Fibonacci retracement has continued to illustrate interest and most recently it's been the 78.6% and 76.4% retracements. The high for today so far is right at that 76.4% marker and while bears haven't exactly taken control yet, given the support test in the US Dollar, there appears to be open framework for at least a pullback, and if that can show, perhaps there could be more.
For USD-weakness I still think Cable (GBP/USD) is a more attractive vehicle but for EUR/USD, bears need to drive through 1.1560-1.1593 to illustrate greater control. Along the way there's shorter-term supports at 1.1663 and 1.1632. - js
EUR/USD Update - Potential TargetsDear Friends in Trading,
How I see it,
** CPI Release tomorrow - BE SAFE!
Keynote:
Price currently at a key support: Previous break-out area!
If support holds potential for more upside is high.
I sincerely hope my point of view offers a valued insight
Thank you for taking the time study my analysis.

SELL EURUSDThis pair has just completed the 2618 trade setup which is based upon Fibs, so we anticipate a downward liquidity as depicted.

EUR/USD Market Analysis (4H Timeframe)In this analysis of the EUR/USD currency pair, I have meticulously identified key market zones and potential price movements:
Resistance Zone (1.1800 - 1.1850):
A critical level where previous upward momentum faced rejection, indicating strong selling pressure.
Support Zone (1.1400 - 1.1450):
A solid base where buyers have historically stepped in, preventing further decline.
Fair Value Gaps (FVG):
Lower FVG (1.1450 - 1.1500): The market is expected to fill this imbalance first as part of its natural price action.
Upper FVG (1.1650 - 1.1700): Once the lower gap is filled, the price is likely to push upward to fill this imbalance.
Projected Movement:
The price is currently consolidating, suggesting a potential downward move to fill the lower FVG. Following that, a bullish surge toward the upper FVG is anticipated.
By leveraging these insights, traders can strategically position themselves for optimal entry and exit points.


EURUSD 1H Supply Zone Rejection – Bearish Setup Loading!Price tapped into a clearly defined 1H supply zone, showing signs of rejection with multiple failed bullish attempts. Multiple rejections and liquidity sweeps have occurred at this level.
📉 Bearish Reaction Expected:
Price is currently forming lower highs inside the supply zone
Anticipated a final short-term push up (liquidity grab), followed by a sharp selloff
Bearish scenario confirmed if we break 1.16062 cleanly
🔻 Targets:
TP1: 1.16062 (near-term support)
TP2: 1.15401 (major demand zone)
🚨 Trade Idea:
text
Copy
Edit
Sell after final push into supply
SL: Above 1.17000
TP1: 1.16062
TP2: 1.15401
RR: ~2.5:1
🧠 Market Notes:
This setup is based on institutional supply/demand theory and visible range volume. Ideal for traders using Smart Money Concepts (SMC) or Order Flow approaches.
📌 Disclaimer:
This is not financial advice. Always do your own analysis before trading. Trade safe and manage risk.

Pennant Breakout, EUR vs USD, Late July Highs Next?Price on FX:EURUSD has made a Pennant Breakout to the upside!
Next we will want to see a Retest to the Breakout of the Pattern and if successful, should be the Support Bulls need to take Price Higher!
The Late July Highs, last visited on July 27th @ 1.1770, will be the Price Target if the Breakout is Validated and Retest is Successful.
This week there is some heavy hitting news for the USD with CPI on Tuesday, PPI on Thursday and Retail Sales and Empire State Manufacturing (being forecast more bearish of all news) on Friday.
