Potential Bullish Pennant on [EURUSD]I spotted a bullish pennant forming after a strong impulsive move upward. Price is currently consolidating in a tight range with lower highs and higher lows, forming the pennant shape.
I’m watching for a second breakout above the upper trendline with volume confirmation. My entry would be slightly above the breakout candle, with a stop loss below the pennant and TP based on the measured move from the previous impulse.
EURUSD trade ideas

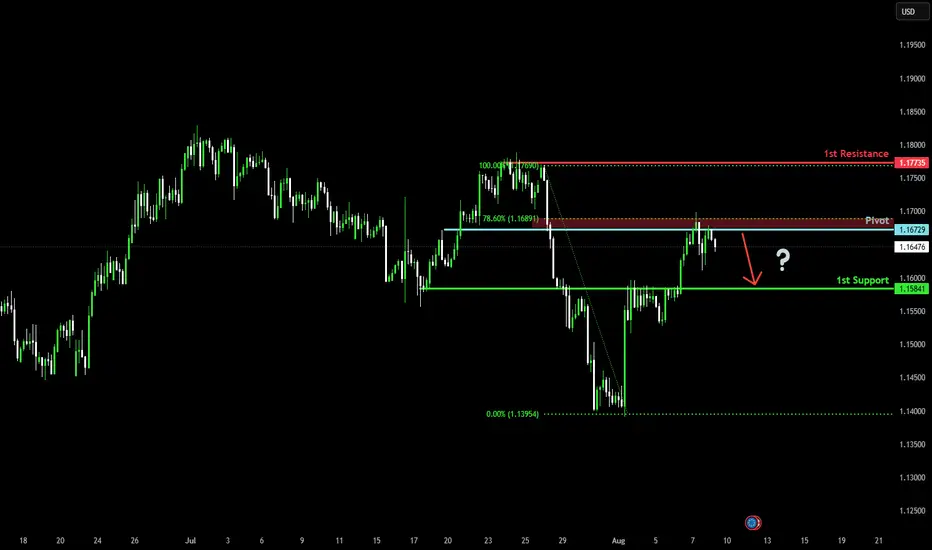
Potential bearish drop?The Fiber (EUR/USD) has rejected off the pivot which acts as a pullback resistance that is slightly below the 78.6% Fibonacci retracement and could drop to the 1st support.
Pivot: 1.1672
1st Support: 1.1584
1st Resistance: 1.1773
Risk Warning:
Trading Forex and CFDs carries a high level of risk to your capital and you should only trade with money you can afford to lose. Trading Forex and CFDs may not be suitable for all investors, so please ensure that you fully understand the risks involved and seek independent advice if necessary.
Disclaimer:
The above opinions given constitute general market commentary, and do not constitute the opinion or advice of IC Markets or any form of personal or investment advice.
Any opinions, news, research, analyses, prices, other information, or links to third-party sites contained on this website are provided on an "as-is" basis, are intended only to be informative, is not an advice nor a recommendation, nor research, or a record of our trading prices, or an offer of, or solicitation for a transaction in any financial instrument and thus should not be treated as such. The information provided does not involve any specific investment objectives, financial situation and needs of any specific person who may receive it. Please be aware, that past performance is not a reliable indicator of future performance and/or results. Past Performance or Forward-looking scenarios based upon the reasonable beliefs of the third-party provider are not a guarantee of future performance. Actual results may differ materially from those anticipated in forward-looking or past performance statements. IC Markets makes no representation or warranty and assumes no liability as to the accuracy or completeness of the information provided, nor any loss arising from any investment based on a recommendation, forecast or any information supplied by any third-party.
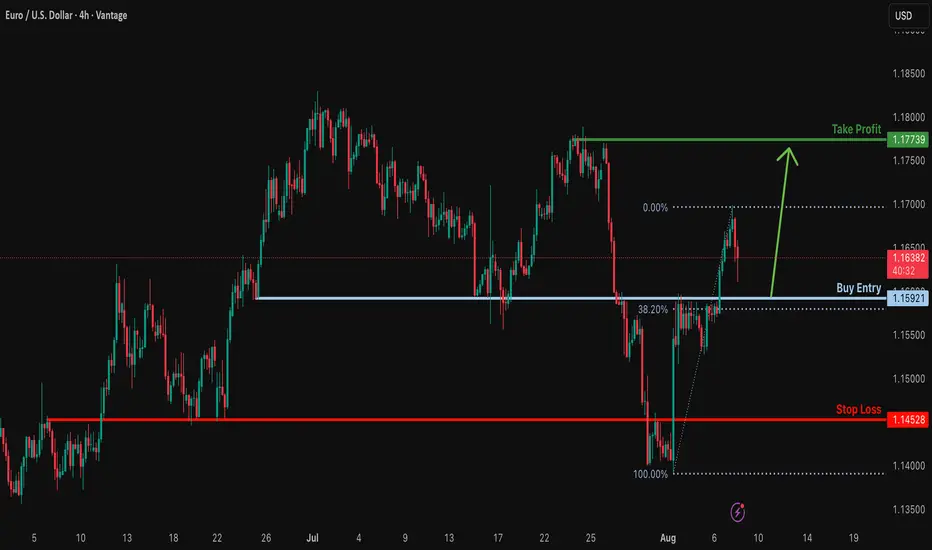
Bullish bounce off overlap support?EUR/USD is falling towards the support level which is an overlap support that aligns with the 38.2% Fibonacci retracement and could bounce from this level to our take profit.
Entry: 1.1592
Why we like it:
There is an overlap support level that lines up with the 38.2% Fibonacci retracement.
Stop loss: 1.1452
Why we like it:
There is a pullback support level that aligns with the 50% Fibonacci retracement.
Take profit: 1.1773
Why we llike it:
There is a swing high resistance.
Enjoying your TradingView experience? Review us!
Please be advised that the information presented on TradingView is provided to Vantage (‘Vantage Global Limited’, ‘we’) by a third-party provider (‘Everest Fortune Group’). Please be reminded that you are solely responsible for the trading decisions on your account. There is a very high degree of risk involved in trading. Any information and/or content is intended entirely for research, educational and informational purposes only and does not constitute investment or consultation advice or investment strategy. The information is not tailored to the investment needs of any specific person and therefore does not involve a consideration of any of the investment objectives, financial situation or needs of any viewer that may receive it. Kindly also note that past performance is not a reliable indicator of future results. Actual results may differ materially from those anticipated in forward-looking or past performance statements. We assume no liability as to the accuracy or completeness of any of the information and/or content provided herein and the Company cannot be held responsible for any omission, mistake nor for any loss or damage including without limitation to any loss of profit which may arise from reliance on any information supplied by Everest Fortune Group.
EURUSD 60/15 Pullback ShortYesterday session closing below TPO POC. Overall downtrend in 1H and 4H, expecting pullback and short.
I dont see much previous buyers at the 1st internal, so price might correct up to 2nd internal, then drop. Alarm at 1st internal.
Plan:
If price start dropp form 1st internal, wait for confirmation then short. Else set aalarm at 2nd internal and short after confirm of bear.

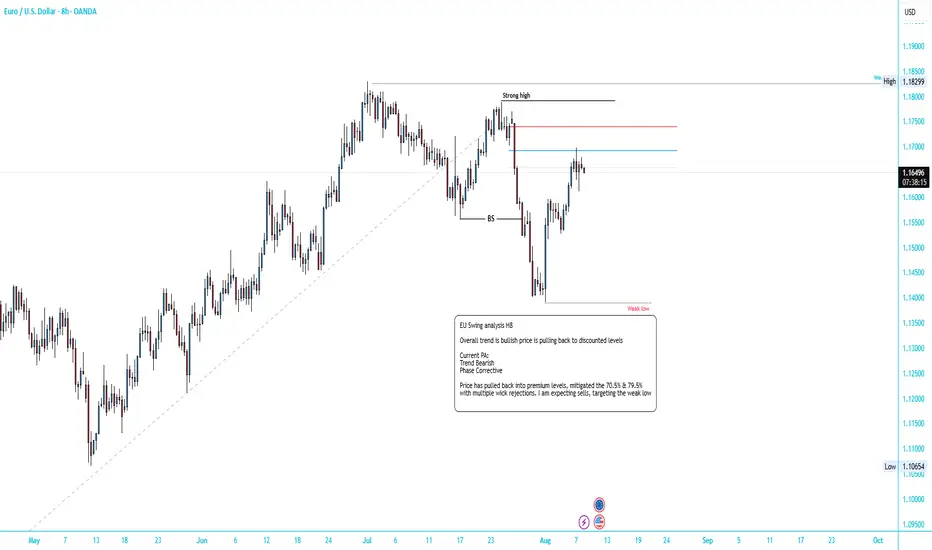
EURUSD Swing outlook! Do you Think EU will sell today? EU Swing analysis H8 Timeframe.
Overall trend is bullish price is pulling back to discounted levels
Current PA:
Trend Bearish
Phase Corrective
Price has pulled back into premium levels, mitigated the 70.5% & 79.5%
with multiple wick rejections. I am expecting sells, targeting the weak low
EURUSDEURUSD Buy Call
Partial booking is must, Manage risk and reward!
USD Still in bearish cotinuation as well as DXY

EURUSD: Strong Bullish Sentiment! Long!
My dear friends,
Today we will analyse EURUSD together☺️
The in-trend continuation seems likely as the current long-term trend appears to be strong, and price is holding above a key level of 1.15455 So a bullish continuation seems plausible, targeting the next high. We should enter on confirmation, and place a stop-loss beyond the recent swing level.
❤️Sending you lots of Love and Hugs❤️
EUR/USD Analysis:The price is moving sideways between the $1.162 support area and the $1.168 resistance area.
A break and close above $1.168 could push the price toward testing $1.177.
A break below the $1.161 support and close under it may lead to a retest of $1.157, followed by $1.153, which is a potential reversal zone.
⚠️ Disclaimer:
This analysis is not financial advice. It is recommended to monitor the markets and carefully analyze the data before making any investment decisions.

EUR/USD MA Breakout Short Setup
Price has broken below the moving average, signaling potential bearish momentum. A short entry is placed at 1.16472 with a stop-loss at 1.16714 to protect against upside reversals. The take-profit target is set at 1.16105.
Risk-to-Reward Ratio: ~1.29

EURUSD - General dynamics and rangesCurrent technical status (Daily/Weekly)
After breaking through the key support at ~1.1445 and then rebounding, EUR/USD is moving up within a steady daily trend, confirmed by the formation of the morning star candlestick pattern, with the short-term target at 1.1800.
The monthly chart shows the development of an upward trend from the October 2025 closing level, with the target of raising prices to 1.1710, but a correction to 1.1588 — the 14.6% Fibonacci retracement level — is possible.
Short-term levels (H1–H4)
Support:
1.1500–1.1480 — the buy zone, from where a reversal has already occurred; the stop level should logically be placed below 1.1440.
Resistance:
1.1600–1.1680 — the near zone, then — 1.1700 and 1.1800 if growth continues.
General dynamics and ranges
The week from August 4 to 8 was characterized by a slowdown in growth, fluctuations in the range of 1.1390–1.1500. The MACD and Stochastic indicators reflect the sellers' momentum, but the oversold situation can provoke a local rebound — growth is possible only with a breakout of 1.1550.
The 1.1650 level is a historically significant barrier. It coincides with the 50% Fibonacci correction and a number of moving averages. Its breakout will open the way to the 1.1700–1.1750 zones. Otherwise, a rollback to 1.1580–1.1530–1.1500 is likely.

EURUSD Analysis week 33🌐Fundamental Analysis
The US Dollar (USD) struggled to find buying momentum on Thursday, but the EUR/USD pair struggled to build upside momentum. The US economic calendar will not release any macroeconomic data that could boost USD valuations over the weekend. Therefore, investors may pay attention to comments from Federal Reserve officials and risk sentiment.
A bullish move on Wall Street after the opening bell could limit the USD’s upside momentum and help the EUR/USD pair find support. Conversely, the pair could continue to decline if the market turns cautious in the second half of the day.
🕯Technical Analysis
EURUSD is still trading in an uptrend and is facing resistance at 1.170. A break above 1.160 forms a lower boundary support zone that should prevent further downside. Pay attention to the resistance and support zones noted on the chart to have a strategy when there is a price reaction in that area.
📈📉KEY LEVEL
Support: 1.160-1.145
Resistance: 1.170-1.181

EURUSD – DAILY FORECAST Q3 | W32 | D8 | Y25📊 EURUSD – DAILY FORECAST
Q3 | W32 | D8 | Y25
Daily Forecast 🔍📅
Here’s a short diagnosis of the current chart setup 🧠📈
Higher time frame order blocks have been identified — these are our patient points of interest 🎯🧭.
It’s crucial to wait for a confirmed break of structure 🧱✅ before forming a directional bias.
This keeps us disciplined and aligned with what price action is truly telling us.
📈 Risk Management Protocols
🔑 Core principles:
Max 1% risk per trade
Only execute at pre-identified levels
Use alerts, not emotion
Stick to your RR plan — minimum 1:2
🧠 You’re not paid for how many trades you take, you’re paid for how well you manage risk.
🧠 Weekly FRGNT Insight
"Trade what the market gives, not what your ego wants."
Stay mechanical. Stay focused. Let the probabilities work.
FX:EURUSD

MORNING FORECAST LESSONHarnessing the Power of Morning Rituals to Enhance Your Forecasting Skills
The Art of Intuition: How to Read the Signs in Your Morning Forecasting
Creating a Forecasting Vision Board: Stacking Confluences for a Bright Day
The Hidden Connections: How Nature's Patterns Can Influence Your Morning Forecasts
Awakening Creativity Through Morning Confluence Practices for Forecasting Success

SELL AFTER THE BULLISH RETRACEMENT ⚙️ Chart Context Overview
Pair: EUR/USD
Timeframe: 4-Hour
Current Price: ~1.1541
Fib Retracement Drawn: From ~1.15981 (swing high) to ~1.13909 (swing low)
---
🔍 Technical Analysis Breakdown
🔴 1. Strong Resistance / Supply Zone (1.17400 – 1.17888)
Price previously rejected from this area, forming a clear swing high.
This zone is tagged as "4Hr Fair Value Gap + Structure Break", indicating institutional selling and market structure shift.
The structure break confirms a bearish order flow.
---
🟧 2. Upper 4H Fair Value Gap (1.16500 – 1.17200 approx.)
Price created imbalance during the drop.
This unfilled FVG suggests a potential retrace to mitigate orders, but currently remains unfilled.
Acts as a supply zone and is unlikely to be revisited soon unless market structure flips bullish.
---
🟨 3. Mid 4H Fair Value Gap (around 1.15497)
Price is currently hovering around this zone.
Aligns with Fib 23.6%, showing weak retracement from the swing low.
Rejection here suggests continuation downward.
---
🟩 4. 1H Fair Value Gap + Fib Cluster Zone (1.15194 – 1.14948)
Aligns with Fib 38.2% & 50% retracement levels.
This confluence of FVG + support is significant:
If price reclaims and holds this zone: potential short-term bounce.
If price breaks this zone: confirms sellers' strength → next leg down.
---
🟦 5. Support Zone (Fib 0.618 – 0.786: 1.14703 – 1.14354)
A strong liquidity pool area.
If price taps into this zone:
Watch for possible bullish reaction (internal liquidity sweep).
If no bounce, expect continuation toward 1.13900 and lower targets.
---
📉 Bearish Bias Justified By:
Break of Market Structure (BOS) from previous highs.
Multiple Fair Value Gaps left unmitigated above – suggests smart money selling on strength.
Current price unable to close above 0.236 Fib retracement, showing weak buyers.
Bearish Fib extension targets:
1.13900 (Fib 1.0) – Likely target.
1.12624 (Fib 1.618) – Bearish extension, possible long-term target.
---
🔑 Key Levels Summary
Level Type Price Zone
🔴 Resistance (Strong Supply) 1.17400 – 1.17888
🟧 4H FVG ~1.16500 – 1.17200
🟨 1H FVG + Support 1.15194 – 1.14948
🟦 Key Support Zone 1.14703 – 1.14354
🔵 Fib Targets 1.13900 / 1.12624
---
📌 Final Outlook
Unless price breaks above 1.1550–1.1600 with strong momentum and volume, EUR/USD is more likely to:
Reject the 1H FVG zone,
Revisit deeper support (1.14300 – 1.13900),
Potentially reach the Fib extension target of 1.12624.

EURUSD: Uptrend Continues, Targeting New Resistance!Market Overview:
The CPI m/m was reported at 0.3%, higher than the expected 0.2%, boosting expectations that the Fed will continue to raise interest rates. Despite the strengthening USD, EURUSD continues its uptrend due to strong price structure and technical support in the short term.
Technical Analysis:
EURUSD is currently trading in an upward price channel, with strong support at 1.15800 USD. If the price maintains above this level, there is a high chance it will test the resistance at 1.16863 USD. If this resistance is broken, the price could continue to rise towards 1.17500 USD.
The chart shows that the upward price structure is supporting the trend, forming higher highs and higher lows, signaling the continuation of the bullish trend.

EUR/USD Robbery Blueprint Bear Strike Activated!💣🎯Operation Fiber Down: EUR/USD Robbery Blueprint (Day Trade Edition) 💰🔫
🚨 Thieves, Hustlers & Chart Bandits Assemble! 🚨
🌍 Hi! Hola! Ola! Bonjour! Hallo! Marhaba! 🌍
Welcome back to another Thief Trading Operation, where the money never sleeps—and neither do we. Let’s break into the vault of EUR/USD “The Fiber” with surgical precision. 🧠💼🕶️
🧨 THE MASTER ROBBERY PLAN: EUR/USD SHORT STRIKE 🔍💸
💀 Market Bias: Bearish – Trend Reversal + Supply Trap Setup
🎯 Target: 1.14600
🛑 Stop-Loss: Near Swing High (around 1.16700 – 4H chart view)
🕓 Timeframe Focus: 15m / 30m / 3H
🧭 ENTRY ZONE:
👣 Plan your entry from recent high retests—that’s where the big money bulls get trapped.
🎯 Use Sell Limit Orders (DCA style / Layered Limit Orders) like a true thief setting up tripwires.
💼 RISK STRATEGY:
💡 SL should match your lot size and order count—not one-size-fits-all!
📌 Place above key structure or swing level (e.g. 1.16700) based on timeframe.
🔍 BEHIND THE SCENES – THE WHY:
The EUR/USD "Fiber" pair is showing all the classic signs of a trend shift and bear raid setup, including:
📰 Fundamentals weakening the Euro
💣 COT Report reveals institutional exits
🍂 Seasonal Bias points to downward trend
📉 Intermarket Pressure from bond yields & USD strength
📊 Sentiment turning overly bullish = trap zone
⛽ Storage & Inventory imbalances adding fuel
📌 Reminder: Before any robbery, study the layout—Macro, Fundamentals, Sentiment, and Intermarket are your blueprint.
🚨 HEIST ALERT – PROTECT THE LOOT:
🕰️ High-Impact News Events? Tighten up!
💼 Don’t take fresh entries during releases.
🔐 Use Trailing SLs to lock in profits.
🎯 Exit with grace before the sirens start.
⚡🔥JOIN THE CREW, BOOST THE LOOT🔥⚡
💥 Smash the Boost Button 💥 if you're vibing with the Thief Trading Movement.
We ain’t just trading—we’re executing strategic robberies on the market’s weaknesses.
🧠💪 Every like = more power to the crew. Every comment = a new map to a vault.
We rob, retreat, and repeat. Let’s make money with skill, not luck. 🕶️💰🚁
⚠️ LEGAL COVER (For the Lawyers 😏):
This plan is not investment advice, just an organized heist blueprint by chart robbers.
Always manage your own risk and update your plan as the market evolves.
🕶️ Stay ready for the next master plan... Until then, keep your charts clean and your stops tight. 🕶️💣📉
– Thief Trader Out 🐱👤🚀

EURUSD stops at the SMA200, ready to pullback.EURUSD stops at the SMA200, ready to pullback.
The pair has been forming the bearish wedge since the April 2025 till July 2025. At the end of July the lower border of the pattern got broken and the price has rapidly reached the 1.14000 support level. Then the rebound from this level occurred and currently the price is retesting the lower border of the wedge from below. Additionally, the SMA200 is situated just above the current price, which is a fair argument for the price to pullback in the nearest future. The price is expected to decline with a first target of 1.14000.

EURUSD – Target: 1,1731EURUSD reached 1,1668, confirming the uptrend on the 1-hour chart.
The next target is a breakout above 1,1731.
At the current levels, the risk-to-reward ratio is not favorable.
Wait for a pullback to look for new entry opportunities.

EURUSD Sell PositionHello traders!
As we discussed in the last daily analysis, our overall view is bearish.
You can see the full analysis in the related article.
We are aiming for a short-term sell here.
Targeted price is 1.14432
Manage your risk and trade safe!

EURUSD – DAILY FORECAST Q3 | W32 | D6 | Y25📊 EURUSD – DAILY FORECAST
Q3 | W32 | D6 | Y25
Daily Forecast 🔍📅
Here’s a short diagnosis of the current chart setup 🧠📈
Higher time frame order blocks have been identified — these are our patient points of interest 🎯🧭.
It’s crucial to wait for a confirmed break of structure 🧱✅ before forming a directional bias.
This keeps us disciplined and aligned with what price action is truly telling us.
📈 Risk Management Protocols
🔑 Core principles:
Max 1% risk per trade
Only execute at pre-identified levels
Use alerts, not emotion
Stick to your RR plan — minimum 1:2
🧠 You’re not paid for how many trades you take, you’re paid for how well you manage risk.
🧠 Weekly FRGNT Insight
"Trade what the market gives, not what your ego wants."
Stay mechanical. Stay focused. Let the probabilities work.
FX:EURUSD

EURUSD DAILY TIMEFRAME ANALYSIS 📊 Key Observations:
1. Uptrend and Trendline Support:
The pair was following a strong ascending trendline.
Price respected this trendline until it broke downwards, indicating a break of bullish market structure.
2. Break of Structure (BoS):
The chart marks a clear Break of Structure (BoS) below the trendline, signifying that buyers lost control and sellers stepped in.
This often suggests a potential trend reversal or at least a deeper correction.
3. Fair Value Gap (FVG):
A Fair Value Gap (imbalance) is highlighted between ~1.1680–1.1830.
This area represents a liquidity void where price moved too quickly in one direction and may return to "fill the gap".
Price is likely to retrace into this FVG, possibly touching the underside of the broken trendline (now resistance).
4. Bearish Retest Zone:
The FVG and trendline intersection make this a strong bearish retest zone.
If price reaches this level, it could act as a supply zone or area of resistance for further downside continuation.
---
🔁 What Could Happen Next:
✔️ Bullish Scenario (less likely without fundamentals):
Price breaks above the FVG and reclaims the trendline.
If that happens, bullish momentum could resume with 1.20+ as the target.
❌ Bearish Scenario (currently more probable):
Price retraces into the FVG zone and rejects.
This retest confirms the trendline as resistance.
Bearish continuation toward 1.1400, 1.1300, or even 1.1100 is likely.
---
🔑 Key Technical Levels:
Level Type Price Level (Approx)
FVG Upper Bound 1.1830
FVG Lower Bound 1.1680
Support 1 1.1400
Support 2 1.1300
Support 3 1.1065
---
🧠 Conclusion:
This chart shows a classic Smart Money Concept (SMC) setup:
Break of structure ➝ Retrace to FVG ➝ Potential bearish continuation. Watch how price reacts around 1.1680–1.1830. That zone will reveal if sellers are still in control.

Buying opportunities on EURUSDEURUSD is currently in an uptrend.
Following Friday’s news, we saw a bounce and a higher low.
The target is a retest and breakout above the previous highs around 1,1800.
The exact entry point can be identified on the lower timeframes after a reaction.
This idea becomes invalid if the price drops below 1.1388!

EURUSD retested bearish wedge. Ready to decline?EURUSD retested bearish wedge. Ready to decline?
EURUSD has been trading bullish since the beginning of August after disappointing NFP report data came out. By the end of last week price has come to a lower border of the wedge and SMA200 on 4-h chart, but failed to develop bullish momentum and pulled back from it. The asset shows weakness and further decline towards 1.14000 as a first target is expected. MACD is in the red zone.
