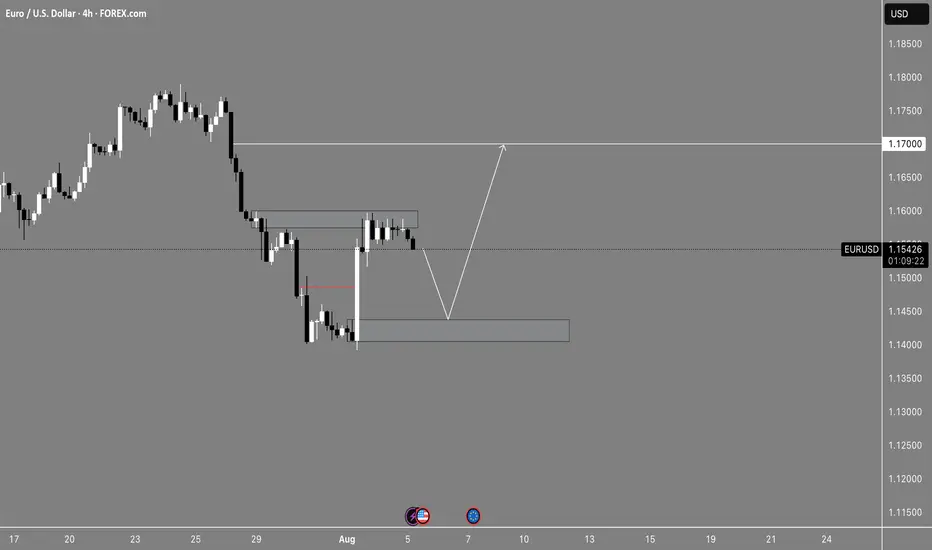
Change the trend Given the price behavior within the current resistance range, a continuation of the downtrend is expected. Upon breaking the resistance range, the continuation of the uptrend will take place in a volatile manner.
EURUSD trade ideas

EURUSD BUYA nice break to the upside after Friday's data release, so now I'm just waiting for a pullback to go long.
EUR/USD - Potential Targets Dear Friends in Trading,
How I see it: (A different perspective)
** POC = Institutional Point of Control
KEYNOTE:
Via the grape vine: 95% chance of FED $ rate cut in September.
We are already seeing the institutional adjustments in this regard.
I will wait for price to correct/retrace back to break-out support area.
Only then will I go through my process of confirmations to look for a "LONG" entry.
I sincerely hope my point of view offers a valued insight
Thank you for taking the time study my analysis.

EURUSD: Eu Looking to Make Gains Vs Weakened USDWelcome back to the Weekly Forex Forecast for the week of Aug 4 - 8th.
In this video, we will analyze the following FX market:
EURUSD
The USD pushed higher on keeping it's interest rate unchanged, but gave back those gains on weak job numbers. This allowed the EU to recover some of the previous weeks losses and show some resiliency.
Now analyst are betting there is a 66% chance for rate cuts in Sept by the Fed. This is negative for the USD, allowing the EURO to move higher.
It is worth mentioning, the EU inked a highly criticized tariff deal with the US, which was not at all positive for the currency.
The market is at a pivotal area that could go either way. Wait for a definitive break of structure before committing to a bias.
Enjoy!
May profits be upon you.
Leave any questions or comments in the comment section.
I appreciate any feedback from my viewers!
Like and/or subscribe if you want more accurate analysis.
Thank you so much!
Disclaimer:
I do not provide personal investment advice and I am not a qualified licensed investment advisor.
All information found here, including any ideas, opinions, views, predictions, forecasts, commentaries, suggestions, expressed or implied herein, are for informational, entertainment or educational purposes only and should not be construed as personal investment advice. While the information provided is believed to be accurate, it may include errors or inaccuracies.
I will not and cannot be held liable for any actions you take as a result of anything you read here.
Conduct your own due diligence, or consult a licensed financial advisor or broker before making any and all investment decisions. Any investments, trades, speculations, or decisions made on the basis of any information found on this channel, expressed or implied herein, are committed at your own risk, financial or otherwise.


EUR USD potential roadmapLooking for entry signal for weaker EUR favouring a major ABC -C leg down perhaps W2 ends. Currently looks like end of minor abc - c leg up at resistance (blue trendline)

EURUSD – Eyes on the Supply Zone Before the Big DropRight now, I see EURUSD gearing up for a bigger fall. The recent price rejection and break below key fib levels hint at strong bearish pressure. My expectation is for the price to head toward the highlighted Supply Zone around 1.1553.
If the market respects this zone, we could see a short-term bounce. But if price breaks and closes below it, I’m looking for a bearish continuation toward deeper levels near 1.1518 and possibly 1.1494.
The EMA is also above current price action, adding extra weight to the bearish bias. For me, this setup signals a “stay short until proven otherwise” approach.
📉 Bias – Bearish towards the Supply Zone
📍 Key Break Point – 1.1553 zone
🎯 Next Targets if broken – 1.1518 / 1.1494

EUR/USD - RISKY PlayShorting EURO as we head into the weekend
Looking for a reversal and claw back on gains after the positive news at the end of last week
Bulls running out of steam, US releasing relatively positive news on SEC chair
Lets see how we go!

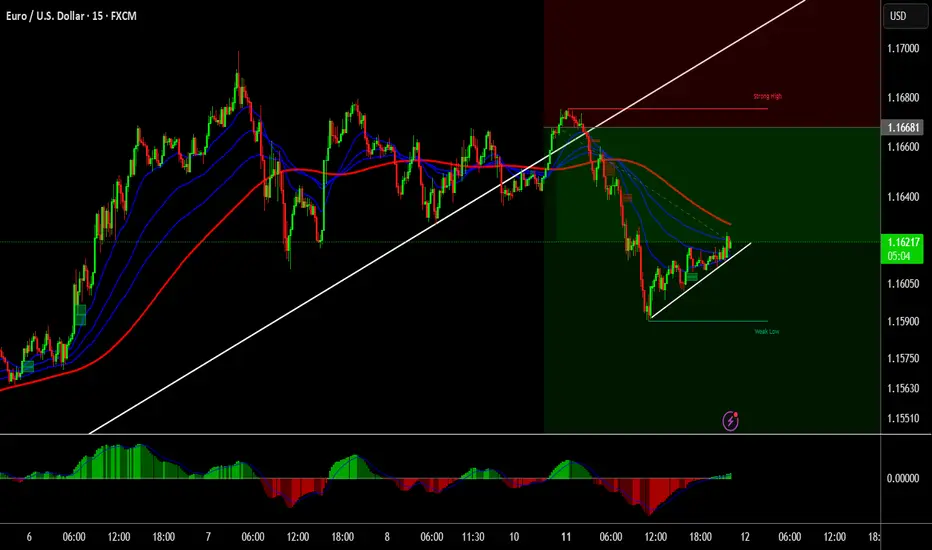
EURUSD - Current technical pictureCurrent technical picture
The euro strengthened after weak US employment data and broke above 1.1670, which greatly improved its technical sentiment
The pair is currently testing its 200-hour moving average (≈1.1578) - stability above this level indicates confident interest in the euro
The price has broken the 50% retracement level of the decline from the July 1 high (≈1.16098) and has already reached the 61.8% level (≈1.1661), which previously served as resistance in mid-July

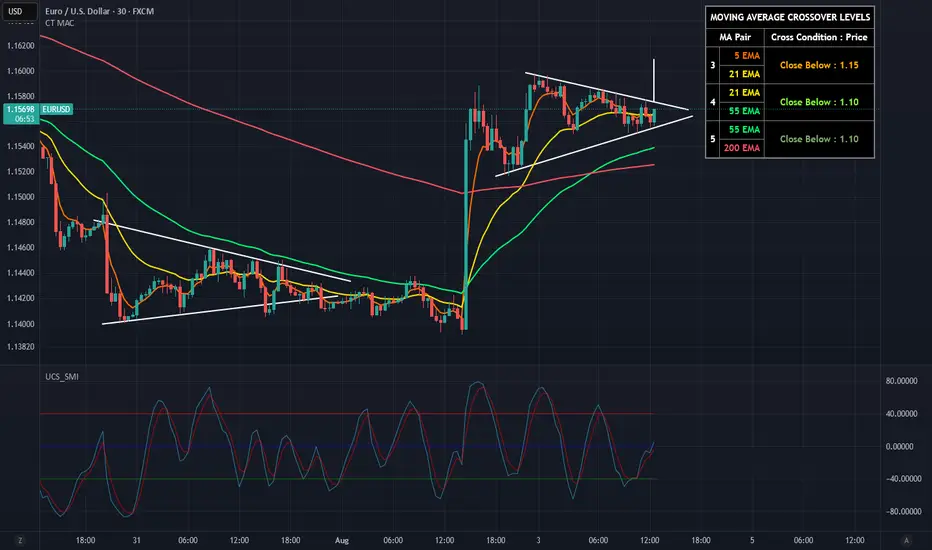
EUR/USD Breaking Point! ALERT Price action is coiling up in a tight triangle and a breakout is imminent! See how the ABCDE pattern on the chart is setting up for a potential explosive move. Will EUR/USD surge higher or drop to key support?
I've mapped out BOTH scenarios with clear technical targets—don’t miss your chance to catch the next big wave!
💡 Tap "Boost" if you found this analysis helpful.
📈 Follow my page for daily actionable trading setups!
👇 Drop your predictions in the comments below—are you bullish or bearish on EUR/USD this week?
Let’s win together!

EUR/USD short in profitIf you caught the setup I shared last week, you should be seeing some early-week profits.
From here, it’s all about managing the trade according to your plan.
Personally, I’m confident in finding quality entries, so I don’t mind keeping a tight stop and re-entering if needed.

EURUSD uptrendEURUSD remains in a sideways range.
The overall trend is bullish, but a short-term pullback is possible.
Tomorrow’s U.S. inflation data could influence the market and present additional opportunities.
Reduce your risk and avoid rushing into new positions.

ICC structure forming. Correction is happening now, looking for more downside. Stop loss can be set to break even from the initial move if desired.
EURUSD Will Go Higher! Buy!
Please, check our technical outlook for EURUSD.
Time Frame: 9h
Current Trend: Bullish
Sentiment: Oversold (based on 7-period RSI)
Forecast: Bullish
The market is approaching a significant support area 1.164.
The underlined horizontal cluster clearly indicates a highly probable bullish movement with target 1.175 level.
P.S
Overbought describes a period of time where there has been a significant and consistent upward move in price over a period of time without much pullback.
Disclosure: I am part of Trade Nation's Influencer program and receive a monthly fee for using their TradingView charts in my analysis.
Like and subscribe and comment my ideas if you enjoy them!

EUR/USD – Day 12 of 100 Days Analysis
We’re closely watching price action around the 1.16164 demand zone. If price holds above this range and breaks 1.16472, we may see a bullish continuation up to 1.17060.
🔍 Smart Money Perspective:
Price may dip below the minor low to sweep liquidity
Retest around 1.16472 can offer a long opportunity
Target Zones:
🟢 TP1 – 1.16722
🟢 TP2 – 1.17060
⚠️ Risk Zone:
Below 1.16164, invalidation for longs. Break of 1.15981 = bearish shift.
📆 Recorded on: August 7, 2025
📍 Session: New York
💥 Watch this level-by-level roadmap unfold and stay consistent through 100 days of EUR/USD analysis!
👇 Comment your bias – Bullish or Bearish?
#forexsignals #eurusdanalysis #tradingview #priceactiontrader #forexchart #technicalanalysis #traderlifestyle #nyopen #smcforex #forexjourney

EURUSD; Heikin Ashi Trade Idea📈 Hey Traders!
Here’s a fresh outlook from my trading desk. If you’ve been following me for a while, you already know my approach:
🧩 I trade Supply & Demand zones using Heikin Ashi chart on the 4H timeframe.
🧠 I keep it mechanical and clean — no messy charts, no guessing games.
❌ No trendlines, no fixed sessions, no patterns, no indicator overload.
❌ No overanalyzing market structure or imbalances.
❌ No scalping, and no need to be glued to the screen.
✅ I trade exclusively with limit orders, so it’s more of a set-and-forget style.
✅ This means more freedom, less screen time, and a focus on quality setups.
✅ Just a simplified, structured plan and a calm mindset.
💬 Let’s Talk:
💡Do you trade supply & demand too ?
💡What’s your go-to timeframe ?
💡Ever tried Heikin Ashi ?
📩 Got questions about my strategy or setup? Drop them below — ask me anything, I’m here to share.
Let’s grow together and keep it simple. 👊

EurusdNy Reversal trade
Only perfect W formation with a 5/13 Cross will possibly give is a 1 % win ratio
TDI sharkfin low

EURUSD - We Joined If you follow my previous analysis, we joined the trend to the next level.
Risking 9 Pips, we are aiming for a 1:10+

EUR/USD - Short-Term - Triangle Breakout soonI'm currently watching EUR/USD as it's forming an ascending triangle on the lower timeframes. Price has been respecting the lower resistance while printing higher lows - suggesting bullish pressure building up. A breakout above the upper area could trigger a larger move to the upside. My first target for the breakout sits around 1.161 based on the triangle height.
Let’s see if the momentum follows through.
1.17171 is the decision point.As long as the price hasn't reached that level, no position should be opened.
We need to wait for it to reach that level and then, based on the reaction to that point, see whether the trend will continue or turn bearish.

EURUSD SHORTHere on these post, i shared short analysis on PEPPERSTONE:EURUSD , Combining both weeklyTF and dailyTF chart, for further info, see the content of the video.

EURUSD: Move Down Expected! Short!
My dear friends,
Today we will analyse EURUSD together☺️
The recent price action suggests a shift in mid-term momentum. A break above the current local range around 1.16384 will confirm the new direction upwards with the target being the next key level of 1.16133 and a reconvened placement of a stop-loss beyond the range.
❤️Sending you lots of Love and Hugs❤️

EURUSD, What's cooking?Since we all know that the market rewards the patient one and scolds the impatient, I've been waiting in the dark. So the EU did some crazy stunts some weeks ago, extending downwards without permission but for all we know, every broken bone must be repaired. I never thought the lazy NFP could give us the head start for a retest and boom...here we are, about to get to the promised land after so much wait. Irregularities can be found as EU ascend, just to clock out of a shift above but as a LOVING SWEET HONEY that I am, I have prepared a warm bath for "HONEY, I'M HOME"...
Be advised that we could end up drowning in the bath water, so do yourself a favor and make sure you still got a leg sticking out (don't go all in), just in case the cops get involved.
Ready or not, hit that SELL BUTTON at the designated mark and regret later!
Go and sin no more!
