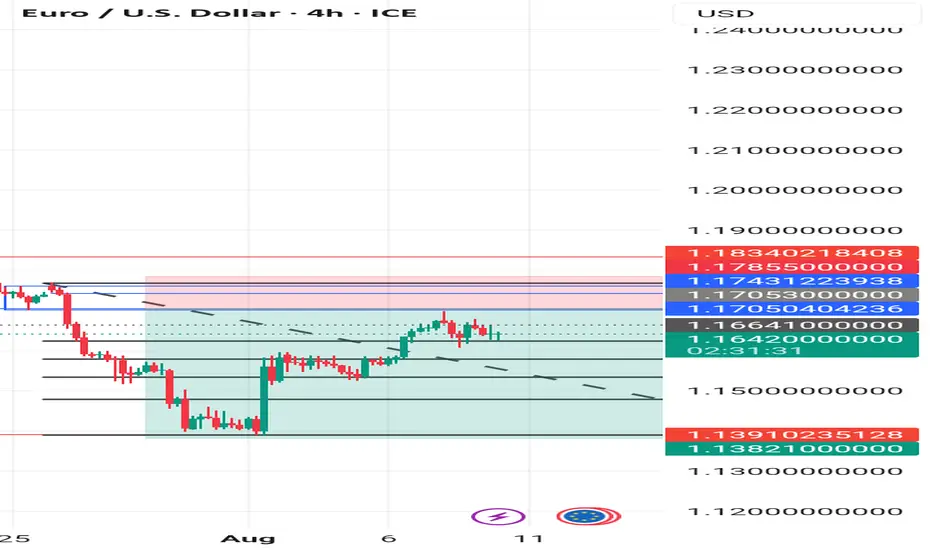
EUR/USD Eyes Bullish Continuation Toward Key Resistance”📊 EUR/USD Chart Analysis (H4 Timeframe) – August 6, 2025
🔍 Market Structure Overview:
Current Price: 1.16086
Trend Context: After a sharp drop toward the 1.14000 support zone, EUR/USD is showing signs of a bullish reversal.
Supertrend Indicator: The Supertrend has flipped bullish, supporting upward momentum.
🧱 Key Levels:
Support Zone: 1.13500 – 1.14200
This level acted as a strong demand area where price reversed sharply.
Resistance Zone: 1.17800 – 1.18500
A major supply zone where price was previously rejected multiple times.
Fair Value Gap (FVG): Between 1.15500 – 1.16500
This imbalance has now been filled, indicating institutional interest and possible price continuation.
📈 Technical Outlook:
Price Action:
The price formed a strong bullish reversal after a sweep of support, indicating possible liquidity grab or accumulation.
Market Objective:
Price is likely targeting the resistance zone near 1.18000, aligned with the arrow shown on the chart.
Supertrend Confirmation:
The flip from red to green further confirms the potential continuation of the bullish leg.
📚 Educational Note:
This is a classic example of price forming a bullish market structure shift after hitting higher timeframe support and then reclaiming the FVG zone. Price breaking and holding above 1.16500 may confirm continuation toward the resistance zone.
✅ Conclusion:
Bias: Bullish
Entry Idea (Educational Purpose):
After confirming a higher low above 1.15500 and strong bullish candle close, entries can be considered toward 1.18000.
Invalidation: A break below 1.14500 would invalidate the bullish setup.
EURUSD trade ideas

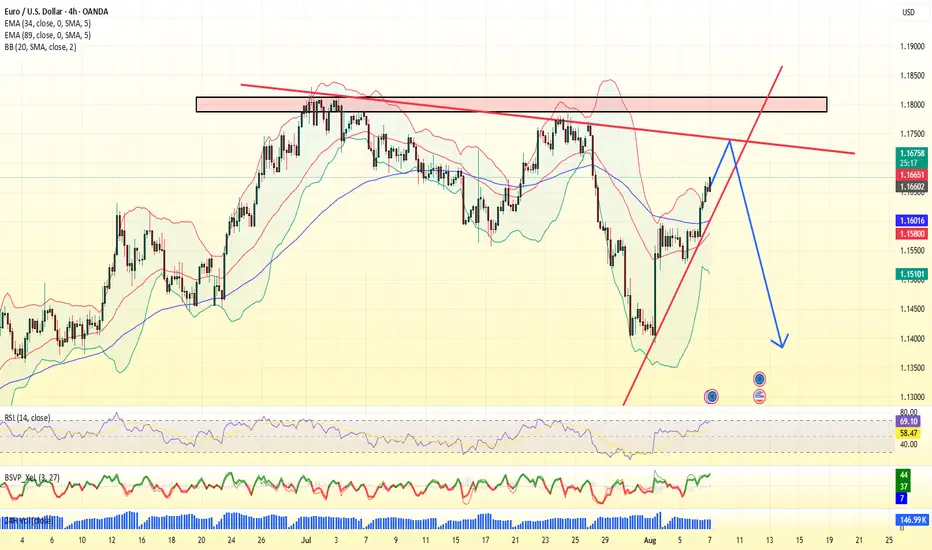
EURUSD Upcoming sell??? FX:EURUSD Mmm..🤔 Looking at price right now and see what looks like a H&S PATTEN forming will this mean sellers are now taking over? Do let me know what you think on the comment session.

Time For Pullback📉 Technical Breakdown:
1. Resistance Zone (Supply Zone) — 1.15700 to 1.15950
> Price was previously rejected strongly from this area, confirming it as a strong supply/resistance zone.
> Multiple rejections from this level indicate the presence of strong sellers.
2. Current Price Action:
> After retesting the resistance area, price is now dropping with momentum, forming strong bearish candles.
> The blue arrows show an expected continuation downward.
3. Retrace Target Area (Short-term Target) — 1.14685 to 1.14593
> This zone is likely the next support level or liquidity pool, where price might temporarily stall or bounce.
>It could be a profit-taking zone for intraday/swing sellers.
4. Previous Low / Major Support Zone — Around 1.14000 to 1.13917
> This purple box marks the previous significant low, which is a key bearish target.
> A break below this level would confirm a strong bearish trend continuation on a higher timeframe.
🧠 Trade Idea:
✅ Sell Setup in Play
Entry: Already in motion after rejection from the 1.15700–1.15950 zone
# TP1: 1.14685 (retracement target zone)
# TP2: 1.14000 area (previous low)
# SL Idea: Above 1.1600 (above resistance wick for safe margin)
✅ Conclusion:
> This chart shows a clear bearish market structure with room for downside.
> Expect continuation to 1.1468, then possibly to 1.1400, unless buyers step in around the retrace zone.
> Solid opportunity for trend-following short trades.

EURUSD before inflation dataEURUSD remains range-bound ahead of the key U.S. inflation news scheduled for 1:30 PM (GMT+1).
We expect increased volatility following the release.
Wait for the market’s reaction and look for entries only once the main direction is confirmed.

Eurusd Buy Setup | 11 august
EUR/USD (Euro vs. US Dollar)
Timeframe:1 5 minutes
Broker Feed: OANDA
Session Indicator: Shows global market sessions — New York, London, Tokyo, Sydney.
Price Levels Marked:
Entry Zone: Around 1.16187 (current price)
Stop-Loss (SL): 1.16141 (highlighted in pink below entry)
Take-Profit (TP): 1.16319 (highlighted in red zone above entry)
Risk-Reward Ratio: The green (reward) area is much larger than the red (risk) area, indicating a favorable R:R setup.
Trade Idea:
Price is expected to dip slightly (gray curved arrow down) before moving upward toward the target zone.
The red rectangle above marks a supply/resistance zone where the trader expects to take profit.
The pink area below is the risk zone leading to stop-loss if price goes against the trade.
Visual Indicators:
Green Zone: Profit target area.
Red/Pink Zone: Risk area.
Gray Arrows: Expected price path prediction.
Labels: Exact price points for SL, TP, and key intermediate levels.
If any doubt feel free to Comment

EURUSD – DAILY FORECAST Q3 | W33 | D11 | Y25
📊 EURUSD – DAILY FORECAST
Q3 | W33 | D11 | Y25
Daily Forecast 🔍📅
Here’s a short diagnosis of the current chart setup 🧠📈
Higher time frame order blocks have been identified — these are our patient points of interest 🎯🧭.
It’s crucial to wait for a confirmed break of structure 🧱✅ before forming a directional bias.
This keeps us disciplined and aligned with what price action is truly telling us.
📈 Risk Management Protocols
🔑 Core principles:
Max 1% risk per trade
Only execute at pre-identified levels
Use alerts, not emotion
Stick to your RR plan — minimum 1:2
🧠 You’re not paid for how many trades you take, you’re paid for how well you manage risk.
🧠 Weekly FRGNT Insight
"Trade what the market gives, not what your ego wants."
Stay mechanical. Stay focused. Let the probabilities work.
FX:EURUSD

EURUSD Squeeze may decide where price will further goOn 1D, there is no clear trend. Price may continue down since we have a LL and LH. But we have three EMA’s as barriers to moving down. We have no see what price does.
On the 4H, we have a good bullish move. We are also above all EMA’s which is good. Price seems to be moving up from here.
On the 1H, we have a triangle squeeze, which price will break soon. This can decide where the market will go. Price is between EMA’s which is not a good sign. We cannot say where price will go. We must wait for a break of structure and then decide.

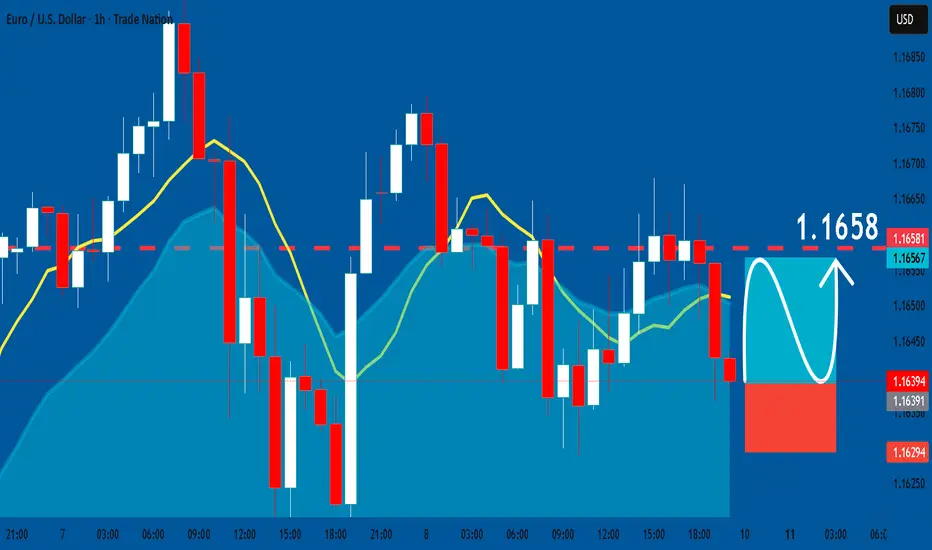
EURUSD: Long Signal Explained
EURUSD
- Classic bullish formation
- Our team expects growth
SUGGESTED TRADE:
Swing Trade
Buy EURUSD
Entry Level - 1.1639
Sl - 1.1629
Tp - 1.1658
Our Risk - 1%
Start protection of your profits from lower levels
Disclosure: I am part of Trade Nation's Influencer program and receive a monthly fee for using their TradingView charts in my analysis.
❤️ Please, support our work with like & comment! ❤️
Short EURUSDOn the Daily time frame the EU is on a downtrend and has create a BOS...for me this a ia sell bais
EURUSD(20250808) Today's AnalysisMarket News:
① Trump nominated Stephen Milan, Chairman of the White House Council of Economic Advisers, to serve on the Federal Reserve Board, with a term ending January 31, 2026.
② Waller is reportedly a leading candidate for the next Fed Chair.
③ U.S. Treasury Secretary Bensont stated that the interview process for the Fed Chair has begun.
④ Bostic stated that the July jobs report did indeed change the Fed's outlook on its employment goals.
Technical Analysis:
Today's Buy/Sell Levels:
1.1657
Support and Resistance Levels:
1.1745
1.1712
1.1691
1.1624
1.1603
1.1570
Trading Strategy:
If the price breaks above 1.1691, consider entering a buy position, with the first target price being 1.1712. If the price breaks below 1.1657, consider entering a sell position, with the first target price being 1.1624.

SWING TRADE IN EURUSD SWING Trade in EURUSD.📉🔻
Swing opportunity is forming in EURO to Short
Follow for more swing analysis on Indices, Commodities
Dr. Iqra Shah

EURUSD; Heikin Ashi Trade Idea📈 Hey Traders!
Here’s a fresh outlook from my trading desk. If you’ve been following me for a while, you already know my approach:
🧩 I trade Supply & Demand zones using Heikin Ashi chart on the 4H timeframe.
🧠 I keep it mechanical and clean — no messy charts, no guessing games.
❌ No trendlines, no fixed sessions, no patterns, no indicator overload.
❌ No overanalyzing market structure or imbalances.
❌ No scalping, and no need to be glued to the screen.
✅ I trade exclusively with limit orders, so it’s more of a set-and-forget style.
✅ This means more freedom, less screen time, and a focus on quality setups.
✅ Just a simplified, structured plan and a calm mindset.
💬 Let’s Talk:
💡Do you trade supply & demand too ?
💡What’s your go-to timeframe ?
💡Ever tried Heikin Ashi ?
📩 Got questions about my strategy or setup? Drop them below — ask me anything, I’m here to share.
Let’s grow together and keep it simple. 👊

EURUSD SELLGlobal equities rose on Thursday, with Japanese shares hitting a record high, as tech-led gains on Wall Street, upbeat earnings, growing hopes for a ceasefire in Ukraine and expectations for U.S. rate cuts boosted sentiment.

EURUSD rises slightly as US economy weakens more than expected1) Market Overview
EURUSD fluctuates around 1.0850 - 1.0960, with a slight upward trend thanks to
- US economic data is below expectations
- ECB maintains a mildly dovish stance, affirming that it will continue to monitor inflation instead of declaring an end to interest rate hikes
This week the market will focus on
- US CPI - which can cause strong fluctuations
- Some statements from ECB and FED members
- Geopolitical risks in the Middle East and Europe
2) Technical Analysis
- Trend: EURUSD is trending slightly upward, the main support level is around 1.0850 and strong resistance is at 1.0970-1.10000
- RSI: fluctuates near the 55-60 zone, not overbought, still has room to increase
- MACD: is crossing the signal line - a potential bullish signal
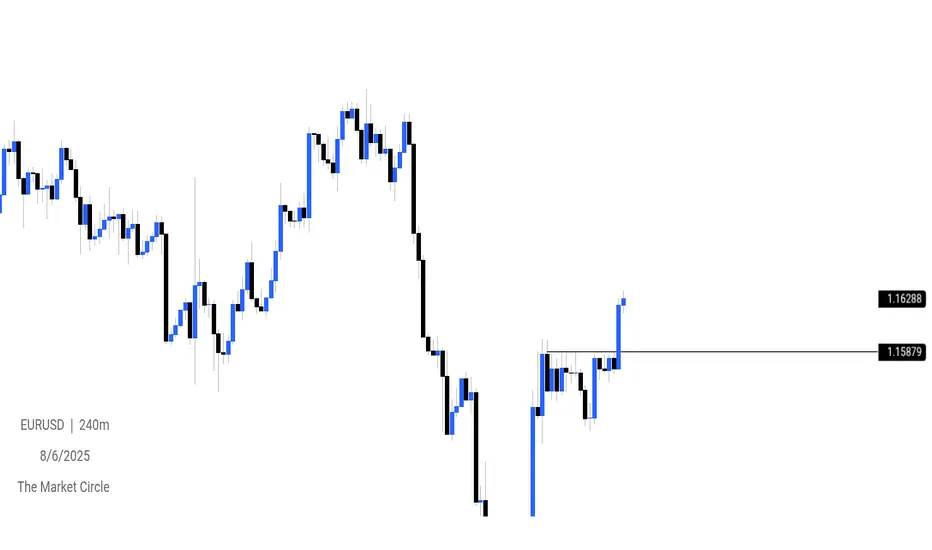
EURUSD OUTLOOKEUR/USD is expected to show bullish sensitivity around the 1.15879 level, indicating a key support area where buyers may step in.
EURUSD SHORTThe current EUR/USD exchange rate is 1.1604, with a 0.24% increase (0.0028) from the previous closing rate. Here's a breakdown of the rate's movement¹:
- *Current Rate*: 1 EUR = 1.16 USD
- *Daily Change*: +0.0028 (0.24%)
- *Daily High*: 1.15886
- *Daily Low*: 1.15640
Some analysts predict a potential decline in EUR/USD due to various factors, including² ³:
- *Federal Reserve Interest Rate Decisions*: Expectations of a rate cut may impact the USD.
- *US Tariff Policies*: Renewed concerns over tariffs could influence the EUR/USD rate.
- *Economic Indicators*: Weak US job data and Eurozone sentiment may affect the rate.
Keep in mind that forex markets can be highly volatile, and rates may fluctuate rapidly. For the most up-to-date information, consider checking financial news websites like FXStreet etc


Euro surges as weak US jobs data hammers dollarThe massive downward revision of the June non-farm payrolls and the softer-than-expected July figure had a big impact on the US Dollar, which is visible across various markets. One of them is the forex pair against the Euro, which had a 2% intraday bullish move on the 1st of August, right after the release of the job report.
The U.S. 10-year treasury bond yields declined from 4.37% to 4.22% showing the bearish pressure on the Dollar, while on the same day, the European flash inflation rate remained stable at 2% when expectations were for a decline to 1.9%. This further boosted the forex pair, strengthening the Euro against the USD.
On the technical side, the price found sufficient support on a major technical level consisting of the combination of the 50% of the weekly Fibonacci retracement level, the lower band of the Bollinger bands, as well as the 100-day simple moving average. It has since rebounded to the upside, and there are no major technical indications of a bearish move in the near short term.
Moving averages are validating the overall bullish trend, and the Stochastic oscillator is at a neutral level, hinting that the trend could move to either side in the upcoming sessions. The most probable scenario might be that the bullish correction might project for this week, and volatility is there to support this since the Bollinger bands have expanded quite a bit.
Disclaimer: The opinions in this article are personal to the writer and do not reflect those of Exness

Pullback tradeThe price has been rejected off a pullback multiple times and now the price looks to continue its downward trend
WE ONLY TRADE PULLBACKS

EURUSD oversold bounceback supported at 1.1526The EURUSD remains in a bullish trend, with recent price action showing signs of a corrective pullback within the broader uptrend.
Support Zone: 1.1526 – a key level from previous consolidation. Price is currently testing or approaching this level.
A bullish rebound from 1.1526 would confirm ongoing upside momentum, with potential targets at:
1.1714 – initial resistance
1.1810 – psychological and structural level
1.1885 – extended resistance on the longer-term chart
Bearish Scenario:
A confirmed break and daily close below 1.1526 would weaken the bullish outlook and suggest deeper downside risk toward:
1.1470 – minor support
1.1400 – stronger support and potential demand zone
Outlook:
Bullish bias remains intact while the EURUSD holds above 1.1526. A sustained break below this level could shift momentum to the downside in the short term.
This communication is for informational purposes only and should not be viewed as any form of recommendation as to a particular course of action or as investment advice. It is not intended as an offer or solicitation for the purchase or sale of any financial instrument or as an official confirmation of any transaction. Opinions, estimates and assumptions expressed herein are made as of the date of this communication and are subject to change without notice. This communication has been prepared based upon information, including market prices, data and other information, believed to be reliable; however, Trade Nation does not warrant its completeness or accuracy. All market prices and market data contained in or attached to this communication are indicative and subject to change without notice.

The Day AheadTuesday, August 5 – Market Summary
Key Data Releases:
US:
ISM Services (July) – A key gauge of the services sector's health.
Trade Balance (June) – Provides insight into export/import dynamics and GDP impact.
China:
Services PMI (July) – Measures activity and sentiment in the service sector.
UK:
Official Reserves Changes (July)
New Car Registrations – A proxy for consumer demand.
Europe:
France: Industrial production and budget balance (June)
Italy: Services PMI (July)
Eurozone: Producer Price Index (PPI) (June) – Tracks inflation at the wholesale level.
Canada:
International Merchandise Trade (June)
New Zealand:
Q2 Labour Force Survey – Key for RBNZ policy direction.
Central Banks:
Bank of Japan:
Minutes from June meeting – Market watches for clues on policy normalization.
Earnings Highlights:
A busy day with reports from several major global firms, including:
US: AMD, Caterpillar, Amgen, Pfizer, Arista Networks, Eaton, Marriott, Snap, DuPont, Zoetis, Super Micro Computer
Europe/Asia: BP, Diageo, Deutsche Post, Infineon, Recruit Holdings, Mitsubishi Heavy, Coupang, Apollo, Fidelity National
Auctions:
US: 3-year Treasury Note auction – Market-sensitive given recent shifts in yield expectations.
Conclusion:
Tuesday is dense with global economic data and earnings. The US ISM services index and China’s PMI will be key indicators of service sector resilience amid diverging monetary policies. Meanwhile, corporate results from major names across tech, industrials, and healthcare may drive sector-specific moves. Markets will also parse BoJ minutes for any policy shift signals and monitor bond auctions for rate sentiment.
This communication is for informational purposes only and should not be viewed as any form of recommendation as to a particular course of action or as investment advice. It is not intended as an offer or solicitation for the purchase or sale of any financial instrument or as an official confirmation of any transaction. Opinions, estimates and assumptions expressed herein are made as of the date of this communication and are subject to change without notice. This communication has been prepared based upon information, including market prices, data and other information, believed to be reliable; however, Trade Nation does not warrant its completeness or accuracy. All market prices and market data contained in or attached to this communication are indicative and subject to change without notice.

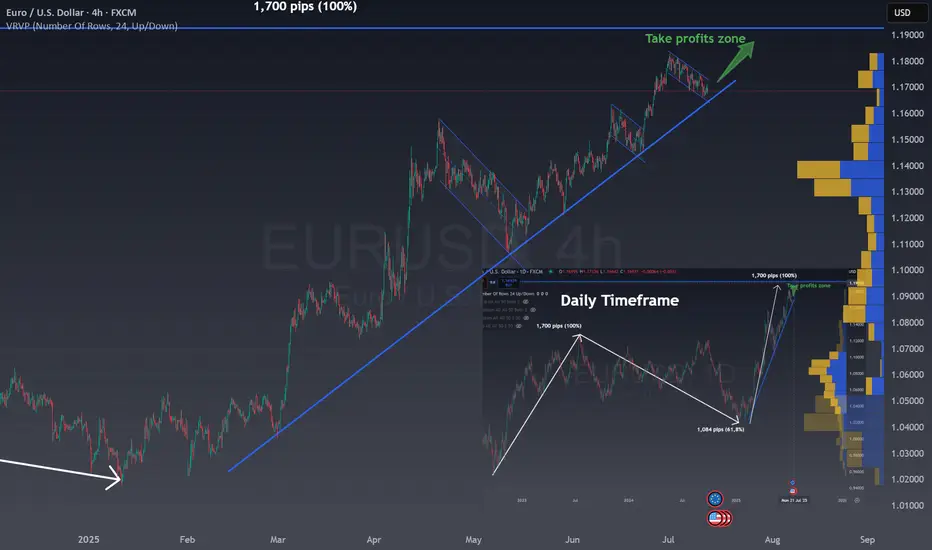
One last rally in EUR/USDIn the right bottom you can see the Daily chart for EUR/USD:
The chart shows the EUR/USD on a daily timeframe.
There was an initial strong rise of 1,700 pips, marked as a 100% move.
After this, the price corrected downward by 1,084 pips, which is 61.8% of the previous rise.
The 61.8% retracement is a common Fibonacci level, often signaling a reversal or pause.
Now, the price is moving up again, following a similar path as the first rise.
The chart suggests a possible new upward move of another 1,700 pips (100%).
A "take profits zone" is marked at the top, indicating a target area for traders.
This pattern reflects how markets often move in waves: trend, correction, and trend continuation.
Fibonacci levels help traders identify potential reversal points.
The chart is used to project future moves based on past price behavior.
The MAIN CHART shows a clear uptrend for EURUSD and the current correction with a flag.
The combination of both patterns give us a clear BUY zone in the channel and using the trend as support or once the channel break upwards.
This is a very good risk reward ratio trade situation where all traders should be!
EURUSD BUY!!!!EURUSD is currently on an uptrend, it broke through and retraced.
Enter BUYS at your own risk and set Take profit & Stop Loss according to your funded amount
