EURUSD - Parallel channel in play!The following chart offers a closer look at the current structure of the EUR/USD pair on the 4-hour timeframe. Price action has been respecting a well-defined bearish parallel channel, which has provided clear boundaries for both resistance and support. Based on the ongoing reaction to these levels, we outline both bullish and bearish scenarios that could unfold in the coming sessions.
Bearish Parallel Channel
Since June 30, EUR/USD has been consistently moving within a downward-sloping bearish parallel channel. Each attempt to break above the upper boundary of the channel has been rejected, while the lower boundary continues to act as dynamic support. This sustained rejection from the upper trendline confirms the strength of the bearish momentum currently at play. The pair remains structurally weak unless a clean breakout to the upside occurs, accompanied by strong bullish confirmation.
Bullish Scenario
A potential bullish reversal could materialize if EUR/USD manages to hold above the 4-hour Fair Value Gap (FVG) located between 1.1620 and 1.1600. This zone may provide the necessary support for the bulls to step in. If the price maintains strength within or just above this FVG and buyers begin to show dominance, a rebound toward the upper boundary of the channel could occur. A successful breakout above the channel could then trigger a stronger rally, possibly targeting the 1.1750–1.1800 region, marking a clear shift in short-term momentum.
Bearish Scenario
Conversely, if the pair fails to hold the 4-hour FVG between 1.1620 and 1.1600 and closes a strong bearish 4-hour candle below this zone, the market may be setting up for further downside. This would suggest a rejection of the FVG as resistance and open the path for a drop toward the lower end of the channel. Interestingly, this area also aligns with a previously established larger 4-hour FVG. A move into this deeper FVG could present a more favorable zone for a longer-term bullish reversal, as it offers a stronger liquidity pool and potential demand area.
Final Thoughts
The EUR/USD pair is at a critical juncture. Price is hovering near a key support zone within a bearish channel that has defined its movement for several weeks. Whether bulls can hold this support and break above the channel, or bears take control and push it lower toward the broader 4-hour FVG, will determine the next major directional move. Traders should closely monitor price action around the 1.1620–1.1600 level for clues on the likely breakout direction.
--------------------------
Disclosure: I am part of Trade Nation's Influencer program and receive a monthly fee for using their TradingView charts in my analysis.
Thanks for your support. If you enjoyed this analysis, make sure to follow me so you don't miss the next one. And if you found it helpful, feel free to drop a like and leave a comment, I’d love to hear your thoughts!
EURUSDTDTM trade ideas

EURO - Price can continue to decline in falling channelHi guys, this is my overview for EURUSD, feel free to check it and write your feedback in comments👊
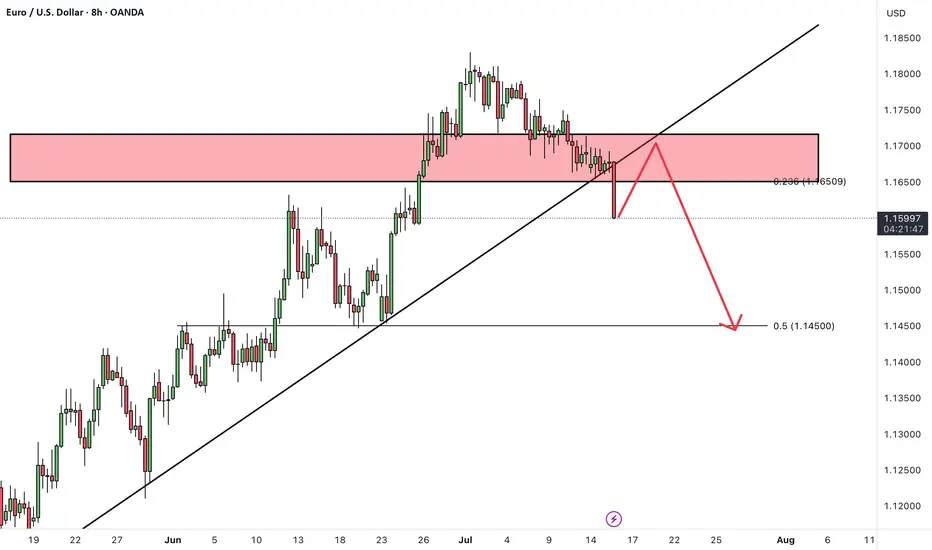
For a long time, the price was moving within a large ascending wedge, showing a gradual upward trend.
However, buyers failed to maintain momentum, and the price made a decisive breakout below the wedge's support line.
Following the breakout, the instrument established a new structure, a local falling channel, and has been trading within its boundaries since.
Currently, the price is in a corrective upward move, approaching the key resistance area of $1.1630 - $1.1660.
This zone is significant as it aligns with a previous support level and the upper boundary of the current falling channel.
I expect that the price will face rejection from this resistance area and will then continue its decline towards the channel's support line, targeting the $1.1465 level.
If this post is useful to you, you can support me with like/boost and advice in comments❤️
Disclaimer: As part of ThinkMarkets’ Influencer Program, I am sponsored to share and publish their charts in my analysis.

123 Quick Learn Trading Tips - Tip #7 - The Dual Power of Math123 Quick Learn Trading Tips - Tip #7
The Dual Power of Math: Logic for Analysis, Willpower for Victory
✅ An ideal trader is a mix of a sharp analyst and a tough fighter .
To succeed in the financial markets, you need both logical decision-making and the willpower to stay on track.
Mathematics is the perfect gym to develop both of these key skills at the same time.
From a logical standpoint, math turns your mind into a powerful analysis tool. It teaches you how to break down complex problems into smaller parts, recognize patterns, and build your trading strategies with step-by-step thinking.
This is the exact skill you need to deeply understand probabilities and accurately calculate risk-to-reward ratios. 🧠
But the power of math doesn't end with logic. Wrestling with a difficult problem and not giving up builds a steel-like fighting spirit. This mental strength helps you stay calm during drawdowns and stick to your trading plan.
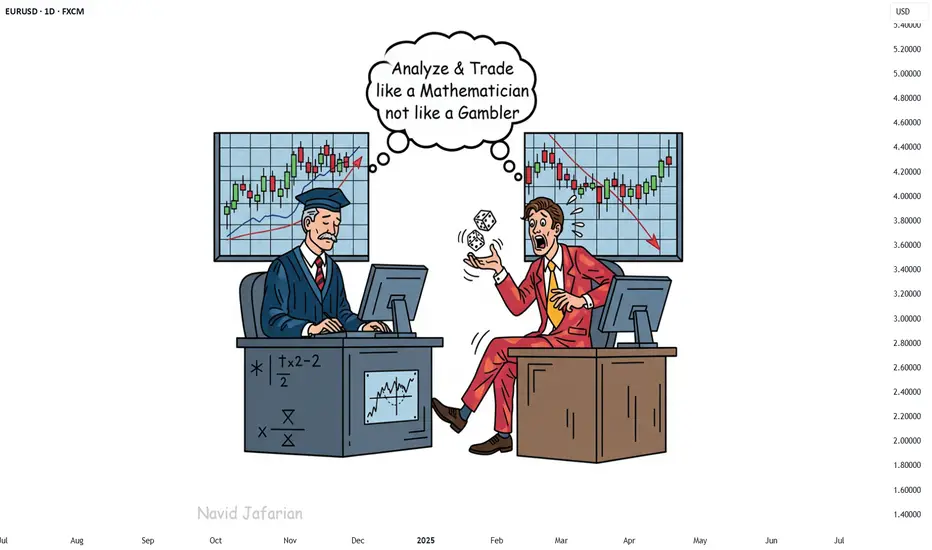
"Analyze with the precision of a mathematician and trade with the fighting spirit of a mathematician 👨🏻🎓,
not with the excitement of a gambler 🎲. "
Navid Jafarian
Every tip is a step towards becoming a more disciplined trader.
Look forward to the next one! 🌟
EUR/USD Flexing Strength- Is the Next Big Coming? EUR/USD Market Update – Bullish Setup at 1.16440
EUR/USD is trading around 1.16440, maintaining its bullish momentum in the current uptrend.
🔹 Current Price: 1.16440
🔹 Support Zone: 1.1600 – 1.1620
🔹 Resistance Zone: 1.1680 – 1.1700
🔹 Trend: Strong bullish structure with clear upward momentum
The pair is holding above key support and aiming for the next resistance at 1.1700. A breakout above this level could open the door to further upside. Traders watching for a retest near support or breakout entry above resistance.
🎯 Trading Plan:
Buy on dips above 1.1620 or wait for a confirmed breakout above 1.1680 with volume.
#EURUSD #ForexAnalysis #BullishSetup #ResistanceSupport #TechnicalAnalysis #PriceAction #TrendTrading #SmartTrader #FXSignals

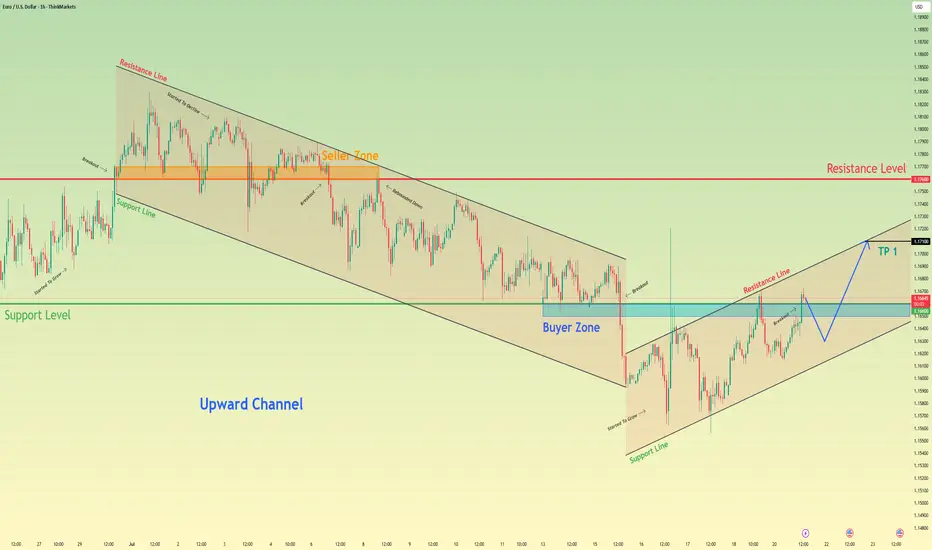
Euro may correct a little and then continue to rise in channelHello traders, I want share with you my opinion about Euro. Observing the recent price action, we can map out a clear transition in market structure. Previously, the pair was contained within a well-defined downward channel, where the seller zone around the 1.1760 resistance level consistently capped rallies, leading to multiple breakdowns and correctional movements. However, after a final push lower, the dynamic shifted, with the price action showing a clear downtrend-to-uptrend reversal. Currently, the euro has established a new upward channel, finding solid ground in the buyer zone around the 1.1660 support level. The price is now engaged in a constructive upward movement within the boundaries of this new channel. The prevailing hypothesis is that after a potential minor correction towards the channel's support line, the pair will resume its ascent. Therefore, the take-profit target for this scenario, tp 1, is strategically placed at 1.1710, as this level directly corresponds with the resistance line of the current upward channel, representing a logical point for price to react. Please share this idea with your friends and click Boost 🚀
Disclaimer: As part of ThinkMarkets’ Influencer Program, I am sponsored to share and publish their charts in my analysis.
EURUSD Potential UpsidesHey Traders, in today's trading session we are monitoring EURUSD for a buying opportunity around 1.16650 zone, EURUSD is trading in an uptrend and currently is in a correction phase in which it is approaching the trend at 1.16650 support and resistance area.
Trade safe, Joe.

EUR/USD - Bullish parallel channel formation!The EUR/USD currency pair is currently exhibiting a bullish market structure on the 4-hour timeframe, moving steadily within a well-defined ascending parallel channel. Price action has consistently bounced between the lower and upper boundaries of the channel, with each dip finding support at the lower trendline and each rally meeting resistance near the upper trendline. This ongoing pattern suggests a strong and orderly bullish trend as the pair continues to make higher highs and higher lows within the channel.
The Market’s Upward Momentum
One notable feature of this trend is the recurring formation of 4-hour Fair Value Gaps (FVGs) during each upward leg. These FVGs act as temporary inefficiencies in the price movement, which the market consistently returns to fill before resuming its bullish momentum. As shown in the chart, the EUR/USD has filled multiple FVGs over the past week. Today, the pair once again retraced to fill a newly formed 4H FVG and has since continued its move higher. This repeated behavior reinforces the strength of the uptrend, as the market efficiently corrects itself and then propels further in the direction of the overall trend.
Bullish Outlook
From a bullish perspective, the key level to watch is the horizontal resistance zone around 1.1766. A confirmed break and hold above this level would signal a strong continuation of the current uptrend. Should the price sustain itself above this level, it could initiate a renewed push toward the upper boundary of the ascending channel, potentially targeting levels near 1.1820 and beyond. This scenario would confirm market confidence and open the door for further gains.
Bearish Risk
On the flip side, the bearish case would involve a false breakout above the 1.1766 resistance level, followed by a sharp rejection and a break below the rising lower trendline of the channel. Such a move would invalidate the current structure and shift the bias to the downside. In that case, the 4-hour FVG located between approximately 1.1710 and 1.1740 will act as a critical support zone. If this area fails to hold, it could trigger a deeper retracement and potentially lead to a more prolonged bearish correction.
Final thoughts
In summary, the EUR/USD is currently respecting a bullish parallel channel on the 4-hour timeframe, with upward moves consistently leaving and then filling 4H FVGs before continuing higher. The 1.1766 level is pivotal, a sustained break above it favors continued bullish momentum, while a rejection and breakdown from the channel could signal a bearish reversal. Traders should closely monitor price behavior around this key level and the integrity of the ascending channel to anticipate the next significant move.
-------------------------
Disclosure: I am part of Trade Nation's Influencer program and receive a monthly fee for using their TradingView charts in my analysis.
Thanks for your support. If you enjoyed this analysis, make sure to follow me so you don't miss the next one. And if you found it helpful, feel free to drop a like 👍 and leave a comment 💬, I’d love to hear your thoughts!

EURUSD: The Logic of Institutional Capital UnveiledThe trend is your friend... until it isn't. While EURUSD remains in a clear global uptrend, the short-term picture is far more deceptive. Before you jump into a long position, it's crucial to understand the bearish order flow that has taken control on the 4H chart.
This idea isn't about fighting the trend, but about having the patience to join it at the right, high-probability moment. Let's dive in.
The most liquid forex asset, EURUSD , continues its global uptrend as long as the price does not close decisively below the daily structure's BOS level at 1.14458. On its ascent, the pair met resistance from a monthly supply zone , from which it began a daily structure correction. This correction was paused by a demand zone and the 61.8% Fib level.
While this might seem like a sufficient support point to consider long positions, let's look at the context on the 4H structure to see why I believe the correction will go deeper.
The 4H structure shows a clear bearish order flow that began from the aforementioned monthly supply zone. We see this order flow manifest as the price consecutively rejects from order blocks #1 and #2 ( they have fulfilled their role and should no longer be considered — any manipulation zone becomes deactivated after its first mitigation ). It would have seemed logical for the price to then reject from OB #3 , where I was personally expecting a counter-trend short trade upon its mitigation, especially after the 4H structure had broken down (BOS 4H).
However, the price doesn't always behave as we expect ; it dropped to the demand zone, leaving behind a 4H FVG. This left OB #3 still technically valid. But the sharp squeeze on July 16th reached the 4H FVG, rebalancing it and thus invalidating OB #3 as a Point of Interest (POI) for large capital. This is because the price was already delivered close to it, and with a high probability, the "Whale" closed its losing hedged long positions there, having no reason to return the price. The sharp upward squeeze on July 16th also served to sweep liquidity from the high marked with an 'x'.
These two factors — the FVG mitigation and the liquidity sweep — confirmed the continuation of the bearish order flow and indicated that the price is likely to continue its corrective move towards the next support levels. Let's examine them in more detail.
~~~~~~~~~~~~~~~~~~~~~~~~~~~~~~~~~~~~~~~~~~~~~~~~~~~~~~~~~~~~~~~~~
Two Potential Long Scenarios
SCENARIO 1: Entry from the Daily Order Block
The first level for a potential reversal is the 78.6% Fibonacci retracement level from the daily structure, in conjunction with a daily order block .
► Setup Condition: Price must reach this level, mitigate the order block, and hold above the 78.6% Fib level. An entry will require LTF confirmation (a BOS or the beginning of LTF order flow).
► Invalidation: A break of the 78.6% level with the price closing below it.
Note: I consider the scenario of breaking this level quite probable due to the weakness of this daily order block — it did not sweep any liquidity when it was formed. Thus, it may itself act as liquidity, activating the second long scenario.
SCENARIO 2: Entry after a Deeper Liquidity Sweep
This scenario becomes valid if the first one fails.
► Setup Condition: A liquidity sweep below the daily structure's break level (BOS D) , which simultaneously corresponds to reaching the 50% Fib level from the weekly structure . This confluence strongly reinforces the setup if this level (at 1.14480) holds. Since this is a weekly level, it must not be broken by the bodies of daily candles closing below it.
► Invalidation: A daily candle close below this level. In that case, we can confidently assume that the uptrend is changing and start looking for short positions.
~~~~~~~~~~~~~~~~~~~~~~~~~~~~~~~~~~~~~~~~~~~~~~~~~~~~~~~~~~~~~~~~~
The principles and conditions for forming the manipulation zones I show in this trade idea are detailed in my educational publication, which was chosen by TradingView for the "Editor's Picks" category and received a huge amount of positive feedback from this wonderful, advanced TV community. To better understand the logic I've used here and the general principles of price movement in most markets from the perspective of institutional capital, I highly recommend checking out this guide if you haven't already. 👇
P.S. This is not a prediction of the exact price direction. It is a description of high-probability setups that become valid only if specific conditions are met when the price reaches the marked POI. If the conditions are not met, the setups are invalid. No setup has a 100% success rate, so if you decide to use this trade idea, always use a stop-loss and proper risk management. Trade smart.
~~~~~~~~~~~~~~~~~~~~~~~~~~~~~~~~~~~~~~~~~~~~~~~~~~~~~~~~~~~~~~~~~
If you found this analysis helpful, support it with a Boost! 🚀
Have a question or your own view on this idea? Share it in the comments. 💬
► Follow me on TradingView to get real-time updates on THIS idea (entry, targets & live trade management) and not to miss my next detailed breakdown.
~~~~~~~~~~~~~~~~~~~~~~~~~~~~~~~~~~~~~~~~~~~~~~~~~~~~~~~~~~~~~~~~~

#EURUSD: Still Extremely Bullish! Let's see how it goes! EURUSD is currently making minor correction and it is likely to reverse in coming days. We have to area from where price could reverse from. we advise you to read the chart and also do your analysis before making any decision.
Like and Comment For More!
Team Setupsfx_

Euro may reach resistance level, break it and continue to growHi guys, this is my overview for EURUSD, feel free to check it and write your feedback in comments👊
For an extended period, the price was dictated by a descending channel, with each rally attempt failing at its upper boundary.
The downward trend culminated in a test of the crucial support level at $1.1635, where sellers were unable to secure a foothold, signaling a potential momentum shift.
This shift was confirmed when buyers took control, launching an upward impulse that decisively breached the long-standing resistance of the channel's upper trendline.
After the breakout, the price established a new local support base above the former channel, solidifying the change in market structure.
The subsequent rally carried the asset's price to the significant horizontal resistance zone around $1.1755, where the upward advance has temporarily stalled.
I expect that after a brief consolidation, bullish pressure will resume, enabling the price to break the $1.1755 barrier and continue towards the $1.1820 target.
If this post is useful to you, you can support me with like/boost and advice in comments❤️
Disclaimer: As part of ThinkMarkets’ Influencer Program, I am sponsored to share and publish their charts in my analysis.

Hellena | EUR/USD (4H): LONG to the resistance area 1.18280.The previous idea was aimed at updating the maximum of 1.18280, but the correction turned out to be too deep.
Therefore, I am proposing a new idea. I believe that wave “3” has formed, and now we should see the completion of the correction in wave “4,” after which I expect to see an upward movement in wave “5.” My target is at least the high of wave “3” — the resistance area of 1.18280.
As for the correction, I think it could reach the 1.15459 area, but I recommend working with pending orders.
Manage your capital correctly and competently! Only enter trades based on reliable patterns!

EUR/USD | Bullish Momentum Builds – Next Targets Ahead! (READ)By analyzing the EURUSD chart on the 4-hour timeframe, we can see that, as per the previous analysis, the price first made a strong move in two steps, successfully hitting the 1.15580 target. Upon reaching this key level, it reacted positively with increased demand and is now trading around 1.16520. Given the current trend, I expect further bullish movement soon, with the next potential targets at 1.16720, 1.17230, and 1.17500.
Please support me with your likes and comments to motivate me to share more analysis with you and share your opinion about the possible trend of this chart with me !
Best Regards , Arman Shaban

EURUSD is Nearing an Important Support!!Hey Traders, in today's trading session we are monitoring EURUSD for a buying opportunity around 1.15400 zone, EURUSD is trading in an uptrend and currently is in a correction phase is in a correction phase in which it is approaching the trend at 1.15400 support and resistance area.
Trade safe, Joe.

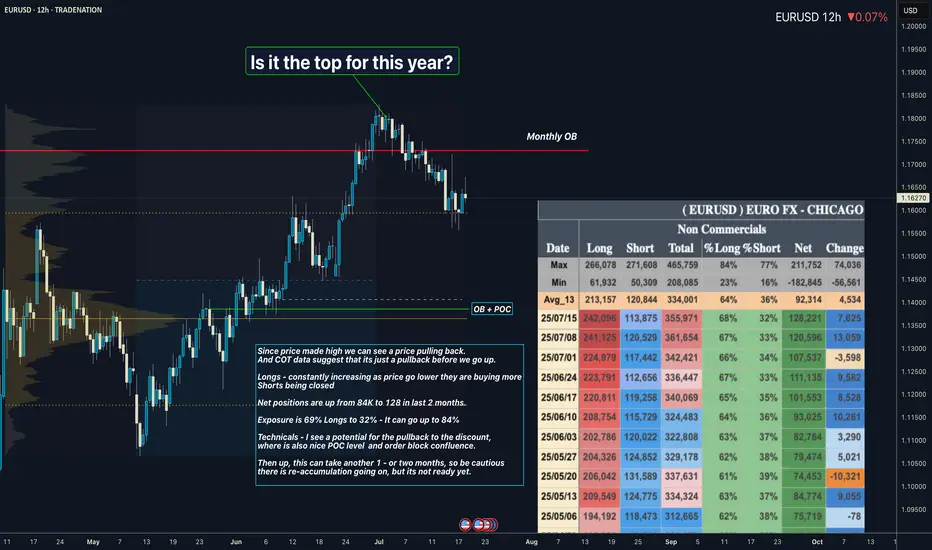
EURUSD I Its re-accumulation. COT Overview Hey what up traders welcome to the COT data and Liquidity report. It's always good to go with those who move the market here is what I see in their cards. I share my COT - order flow views every weekend.
🎯 Non Commercials added significant longs and closed shorts at the same time. So for that reason I see the highs as a liquidity for their longs profits taking.
📍Please be aware that institutions report data to the SEC on Tuesdays and data are reported on Fridays - so again we as retail traders have disadvantage, but there is possibility to read between the lines. Remember in the report is what they want you to see, that's why mostly price reverse on Wednesday after the report so their cards are hidden as long as possible. However if the trend is running you can read it and use for your advantage.
💊 Tip
if the level has confluence with the high volume on COT it can be strong support / Resistance.
👍 Hit like if you find this analysis helpful, and don't hesitate to comment with your opinions, charts or any questions.
Analysis done on the Tradenation Charts
Disclosure: I am part of Trade Nation's Influencer program and receive a monthly fee for using their TradingView charts in my analysis.
"Adapt what is useful, reject what is useless, and add what is specifically your own."
— David Perk aka Dave FX Hunter ⚔️
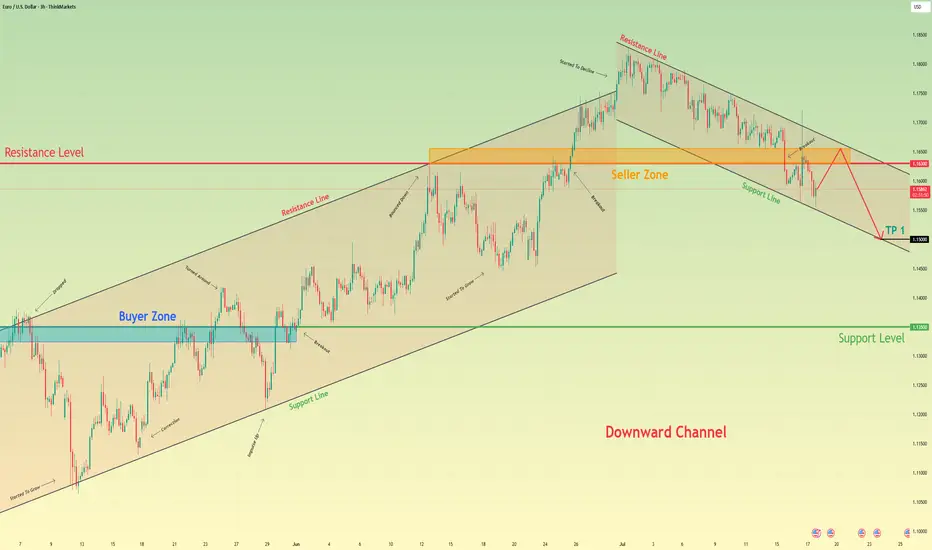
Euro may reach seller zone and then continue to fall in channelHello traders, I want share with you my opinion about Euro. The price pair has recently shifted its market structure, establishing a clear downward channel after breaking its previous uptrend. Before this breakdown, the price was consistently trading within an Upward Channel, repeatedly finding support in the buyer zone (1.1325–1.1350) and reversing upward. The bullish momentum eventually faded when the price failed to break the major horizontal resistance level at 1.1630. This failure triggered a strong bearish impulse, leading to a decisive breakout below the channel's support line and confirming a trend reversal. Currently, the price is making a corrective move up inside the newly formed downward channel, which appears to be a classic retest of the broken structure from below. I expect this upward move to stall as it approaches the heavy confluence of resistance formed by the channel's upper Resistance Line and the horizontal seller zone at 1.1630–1.1655. After testing this area, I anticipate a rejection and the beginning of a new bearish leg down. That's why I've set my TP at the 1.1500 level — it aligns perfectly with the support line of the current downward channel, making it a logical target for sellers. Please share this idea with your friends and click Boost 🚀
Disclaimer: As part of ThinkMarkets’ Influencer Program, I am sponsored to share and publish their charts in my analysis.
EURUSDHello Traders! 👋
What are your thoughts on EURUSD?
EURUSD has broken support level and its ascending trendline, indicating a possible shift in short-term market structure and growing bearish pressure.
In the short term, we expect a pullback toward the broken support/trendline zone.
If price fails to reclaim this level, a continued move lower toward the next identified support zone is likely.
As long as price remains below the broken structure, the short-term outlook stays bearish.
Don’t forget to like and share your thoughts in the comments! ❤️
DeGRAM | EURUSD moving in an ascending channel📊 Technical Analysis
● Bulls punched through the 11-day descending trend-line (circled “breakout”) and immediately based on it, keeping the rising 30-min channel of higher-lows intact.
● The next confluence lies at 1.1665 where the channel mid-line meets the prior swing top; clearance unlocks the upper band / July supply at 1.1692-1.1700.
💡 Fundamental Analysis
● Friday’s slide in US 2-yr yields after soft existing-home-sales and mixed Fed speak trims dollar carry, while pre-ECB-meeting sources stress “data-dependent patience,” limiting euro downside.
✨ Summary
Long 1.1635-1.1650; hold above 1.1665 targets 1.1692 → 1.1700. Bias void on an H1 close below 1.1615.
-------------------
Share your opinion in the comments and support the idea with a like. Thanks for your support!

Lingrid | EURUSD Potential Surge Following Channel BreakoutFX:EURUSD is consolidating after bouncing from a key confluence of support around 1.16000 and forming a higher low within the upward channel. The recent corrective pullback through a downward channel now appears complete, with bullish structure resuming. Price is likely to advance toward the 1.18300 resistance as long as the 1.15900 zone holds. Momentum favors a continuation of the A-B-C and trend continuation sequences already established.
📉 Key Levels
Buy trigger: Break above 1.16500
Buy zone: 1.16000–1.16250
Target: 1.18300
Invalidation: Close below 1.14500
💡 Risks
Failure to break the corrective channel resistance
Bearish divergence on lower timeframes
Broader USD strength reversal
If this idea resonates with you or you have your own opinion, traders, hit the comments. I’m excited to read your thoughts!

EURUSD Trading Price Channel, SELL Strategy✏️ OANDA:EURUSD H4 Timeframe EURUSD is trading in a bearish channel. This bearish channel may extend to the important support at 1.145. A break of this important support will form a Downtrend. Further upside recovery will remain limited by the channel, with the notable upper boundary at 1.16800.
📉 Key Levels
Sell trigger: rejection from 1.168 with bearish confirmation
Sell DCA: Break 1.155
Target: 1.145
Leave your comments on the idea. I am happy to read your views.

EURUSD: Support & Resistance Analysis For Next Week 🇪🇺🇺🇸
Here is my latest structure analysis and important supports/resistances
for EURUSD for next week.
Consider these structures for pullback/breakout trading.
❤️Please, support my work with like, thank you!❤️
I am part of Trade Nation's Influencer program and receive a monthly fee for using their TradingView charts in my analysis.

DeGRAM | EURUSD in the consolidation zone📊 Technical Analysis
● Price broke the month-long bearish channel and is now basing inside the 1.165-1.169 consolidation block; repeated intraday retests (blue zone) turn the former cap into fresh support.
● A steep hourly up-sloper is carving successive higher-lows; its width and the prior channel depth project follow-through toward 1.1745 (mid-July pivot) with room to the next swing line at 1.1800.
💡 Fundamental Analysis
● FXStreet highlights softer US PMIs and a pull-back in 2-yr yields, while ECB sources flag “data-dependent patience” rather than imminent cuts—narrowing the short-rate gap and favouring the euro.
✨ Summary
Long 1.1650-1.1680; hold above the blue base targets 1.1745 ➜ 1.1800. Long view void on an H1 close below 1.1615.
-------------------
Share your opinion in the comments and support the idea with a like. Thanks for your support!

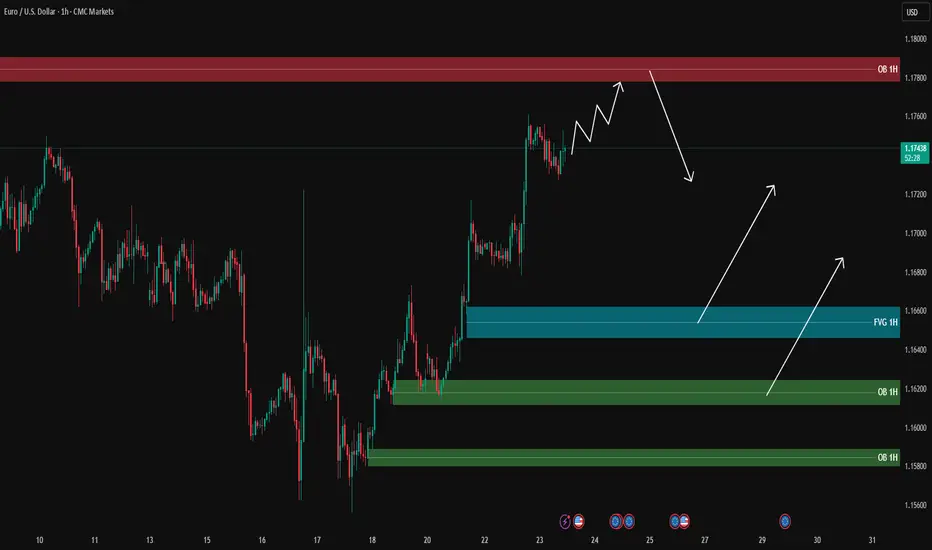
EURUSD analysis - 1H FVG and OB setupsOn the 1H timeframe, price is moving strongly towards the 1H supply zone (around 1.1780), and it is likely to reach this area first before pulling back.
During the pullback, the blue FVG and green OB zones below are key areas for potential long entries:
🔹 FVG 1H around 1.1660
🔹 OB 1H around 1.1620
🔹 OB 1H around 1.1580
📌 Plan:
1️⃣ If the price reaches the upper supply zone, we will look for short scalps with confirmation on the lower timeframe (5M/3M).
2️⃣ After the pullback to lower zones, we will look for long opportunities with PA confirmation.
🎯 Long targets after pullback: 1.1700 – 1.1720, potentially 1.1750.
❌ No entry without confirmation.
EURUSD Buy Trade Idea: Reversal Rocket Ready to Launch!Hey Fellow Traders! 👋
The EURUSD (EU) is setting up for a massive reversal that’s got me hyped! 🚀 After nailing the lows of that descending channel like a pro, price has retraced to our expected zone and is now bouncing hard. It’s time to gear up for a potential buy trade targeting the Buyside Liquidity! Let’s break down this fire setup and get ready to ride the wave! 🌊
📈 The Setup: Reversal in the Making!
EU hit the descending channel lows as predicted, and now it’s showing some serious bullish vibes with a strong bounce off a key weekly trendline support. This isn’t just a random move—price is reacting to a weekly demand zone and a trendline that’s holding like a fortress. 🏰 I’m expecting a reversal to kick in, aiming for that juicy Buyside Liquidity up top. But hold up—don’t just dive in blindly! Let’s talk strategy. 😎
🎯 Trade Details: How to Play It Smart
Entry Zone: Look for a calculated entry in this bounce area. Key setups to watch for:
FVG (Fair Value Gap) or IFVG (Imbalance Fair Value Gap) for precision entries.
Order Blocks (OB) for high-probability setups.
Trendlines/Support Zones: Use these for confluence, as EU is respecting that weekly trendline support.
Target: We’re gunning for the Buyside Liquidity—a high-probability target where price loves to gravitate.
Stop Loss: Place your stops below the recent lows or your chosen setup (FVG/OB) to keep risk tight.
👀 Keep an Eye on DXY for Confluence
The Dollar Index (DXY) is a key player here. A weakening DXY could supercharge this EU reversal, so monitor it closely for extra confirmation. If DXY starts to roll over, it’s like pouring rocket fuel on this trade! 🚀
🧠 Why This Reversal Makes Sense
Weekly Trendline Support: Price kissed this level and is bouncing like it means business.
Weekly Demand Zone: This area has historical strength, making it a prime reversal spot.
Channel Lows Conquered: EU smashed through the descending channel lows and is now retracing for the next leg up.
⚠️ Risk Management Reminder
Don’t YOLO this one! Use proper risk management—calculate your position size, set tight stops, and only enter when your setup aligns. Whether you’re using FVGs, OBs, trendlines, or classic support/resistance, make sure your entry is calculated to avoid getting caught in a fakeout. 💪
💬 Let’s Talk Trades!
What’s your take on this EU reversal? Are you jumping in with an FVG, OB, or something else? Drop your thoughts, setups, or questions in the comments below! 👇 If this idea gets you pumped, smash that LIKE button ❤️, follow for more banger trade ideas, and share your charts with the community! Let’s keep the vibes high and the profits higher! 💰
#EURUSD #ForexTrading #BuyTrade #Reversal #TradingView
