EURUSD - ANALYSIS👀 Observation:
Hello friends! I hope you're doing well. I’d like to share my view on EUR-USD with you.
Looking at the EUR-USD chart, I see two potential scenarios ahead:
🔹 Scenario 1 – Bearish:
If EUR-USD breaks below 1.16836 on the 15-minute time frame, I expect a downward move toward the 1.16319 to 1.15850 area.
🔹 Scenario 2 – Bullish then Bearish:
If the price rises from the current level, I expect an initial move up toward 1.17937, followed by a decline back toward the 1.16319 to 1.15850 zone.
💡 Key Levels to Watch:
📌 Support: 1.16836 / 1.16319 / 1.15850
📌 Resistance: 1.17937
💬 What are your thoughts on EUR-USD? Let me know in the comments below.
Trade safe
EURUSDTDTM trade ideas

EURUSD may uptrend for a few yearThe breakout on monthly timeframe seem almost fully close.
And that continue happen, EURUSD might have a few year of uptrend.

German CPI flatlines, eurozone CPI nextThe euro is up for an eighth consecutive day and has gained 2.4% during that time. In the North American session, EUR/USD is trading at 1.1738, up 0.36% on the day.
German inflation data on Monday pointed to a weakening German economy. The CPI report indicated that the deflationary process slowly continues. The inflation rate for June came in at 0% m/m, down from 0.1% in May and below the consensus of 0.2%. Annually, inflation dropped to 2.0% from 2.1% and below the consensus of 2.1%. The eurozone releases its CPI report on Tuesday.
Inflation has been dropping in small increments and has now fallen to the European Central Bank's inflation target of 2%. The ECB cut the deposit rate to 2.0% earlier in June and meets next in July. Although eurozone inflation is largely contained, there are concerns about the impact that US tariffs and counter-tariffs by US trading partners could have on the inflation picture. The ECB is likely to maintain rates in July but could lower rates in September if disinflation continues.
The US continues to show signs that the economy is slowing down. Last week, GDP was revised downwards to -0.5% in the first quarter. This was followed by US consumer spending for May (PCE) which posted a 0.1% decline, following a 0.2% gain in April and shy of the consensus of 0.1%. This was the first contraction since January. If economic data continues to head lower, pressure will increase on the Federal Reserve to lower interest rates, which isn't expected before the September meeting.
EUR/USD is testing resistance at 1.1755. Above, there is resistance at 1.1791
1.1718 and 1.1682 are the next support levels

EURUSD Under Pressure! SELL!
My dear subscribers,
My technical analysis for EURUSD is below:
The price is coiling around a solid key level - 1.1726
Bias - Bearish
Technical Indicators: Pivot Points High anticipates a potential price reversal.
Super trend shows a clear sell, giving a perfect indicators' convergence.
Goal - 1.1612
My Stop Loss - 1.1783
About Used Indicators:
By the very nature of the supertrend indicator, it offers firm support and resistance levels for traders to enter and exit trades. Additionally, it also provides signals for setting stop losses
Disclosure: I am part of Trade Nation's Influencer program and receive a monthly fee for using their TradingView charts in my analysis.
———————————
WISH YOU ALL LUCK

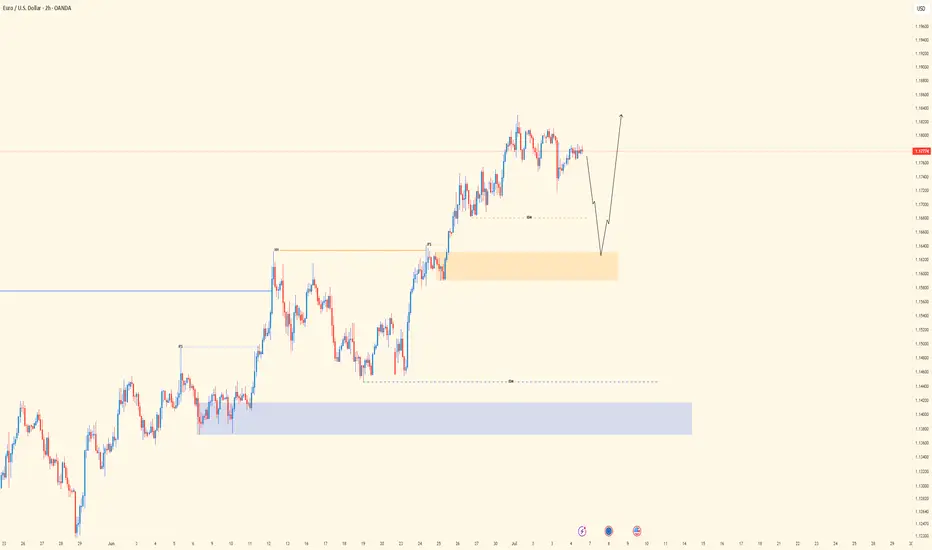
#EURUSD:Expecting A Strong Bull Move, Two Entries | Two TargetsIn our previous analysis, we clearly stated that the price would remain bullish as the DXY had to plummet, and it did exactly that, rising by 450 pips from our last entry. Currently, we have two areas from which we can see the price reversing. The first one is nearby and has a higher risk compared to our second entry, which may be safer for some traders. We need a strong confirmation before making any significant decisions.
Good luck and trade safely. We wish you the best in your trading journey.
Team Setupsfx_

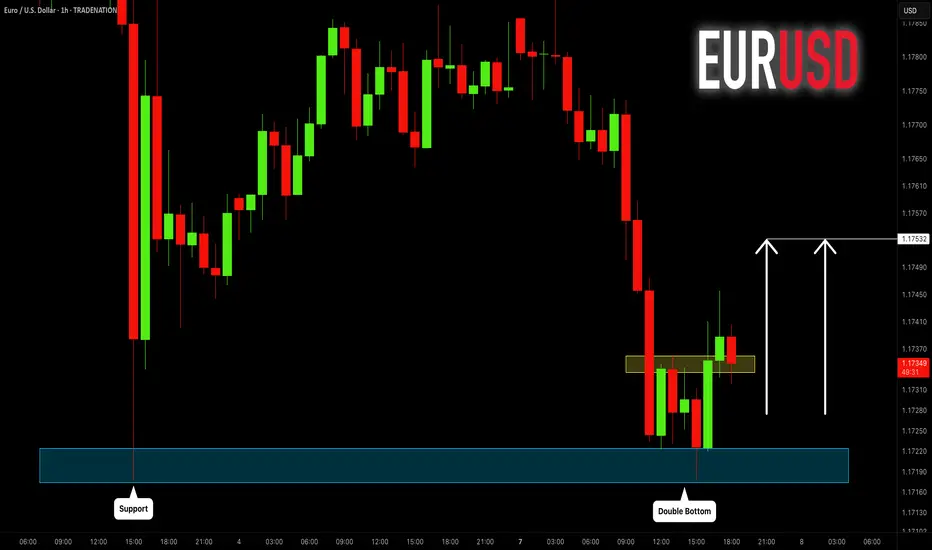
EURUSD: Another Pullback Trade for Today 🇪🇺🇺🇸
EURUSD formed a double bottom pattern on a key daily horizontal support.
Its neckline violation signifies a local strength of the buyers.
I think that the pair may move up and reach 1.1753 level.
❤️Please, support my work with like, thank you!❤️
I am part of Trade Nation's Influencer program and receive a monthly fee for using their TradingView charts in my analysis.
EURUSD - Looking for the RTLooking for the RT on the upper supply zone, long term target for EURUSD is 1.200-1.2200. However, on RT we can potentially expect a larger pull back but will analyse PA.

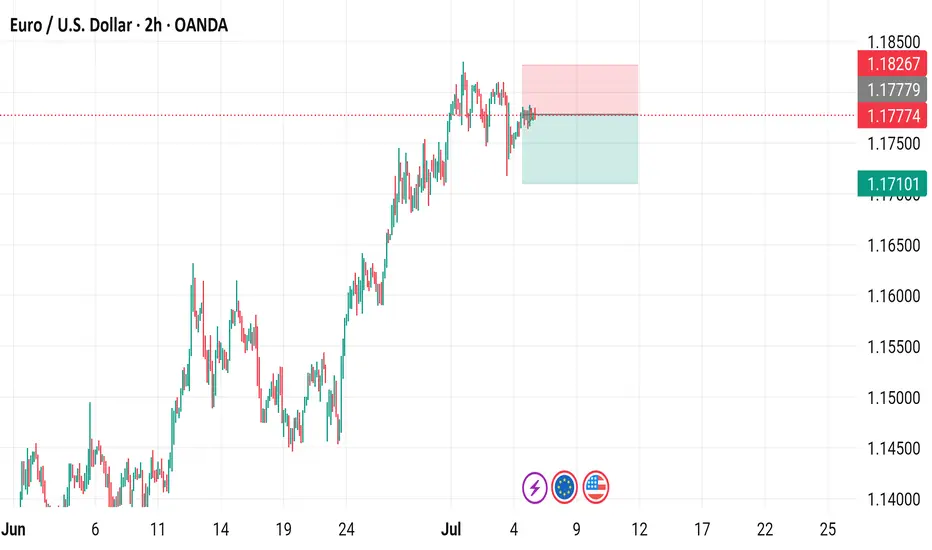
Euro / U.S. Dollar - 2h Chart (OANDA)2-hour candlestick chart of the EUR/USD currency pair from OANDA, showing the exchange rate trend from late June to July 07, 2025. The current rate is 1.17774, with a 0.00200 (0.17%) increase. The chart highlights a recent trading range between 1.17774 (sell) and 1.17824 (buy), with a notable upward movement in the past few hours.
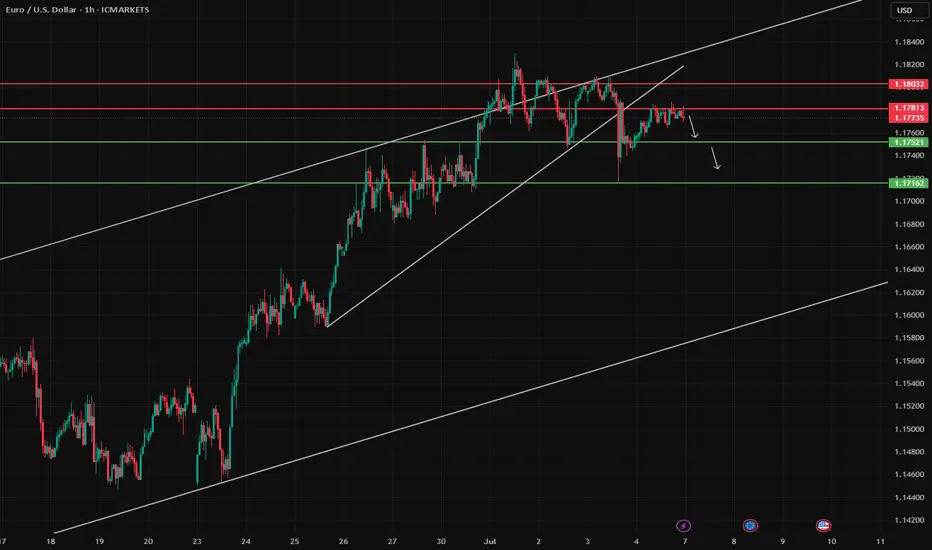
EUR/USD Weakens After Rising Wedge BreakdownAfter forming a rising wedge at the top of the upward channel, EUR/USD has broken to the downside. The price is now trading below 1.17813 and struggling to reclaim previous support zones.
The break of the wedge and failure to hold above 1.17813 may indicate more downside pressure.
EU| - Bullish Structure Intact | Watching for SSL Sweep and RunPair: EURUSD
Bias: Bullish
Timeframes: 4H, 2H, LTFs
• 4H structure is clean and bullish — momentum’s been steady, and the market looks ready to ride higher going into next week.
• 2H gives clarity — I’m watching for a sweep of SSL into OB to set the stage for LTF confirmation.
• Entry process remains the same: wait for CHoCH, followed by sweep inside the OB zone.
🔹 Entry: After CHoCH + sweep inside OB (LTF process repeated)
🔹 Entry Zone: After confirmation within OB
🔹 Target: Structure highs — letting price unfold with the trend
Mindset: Patience pays the most. Wait for the market to come to you, not the other way around.
Bless Trading!
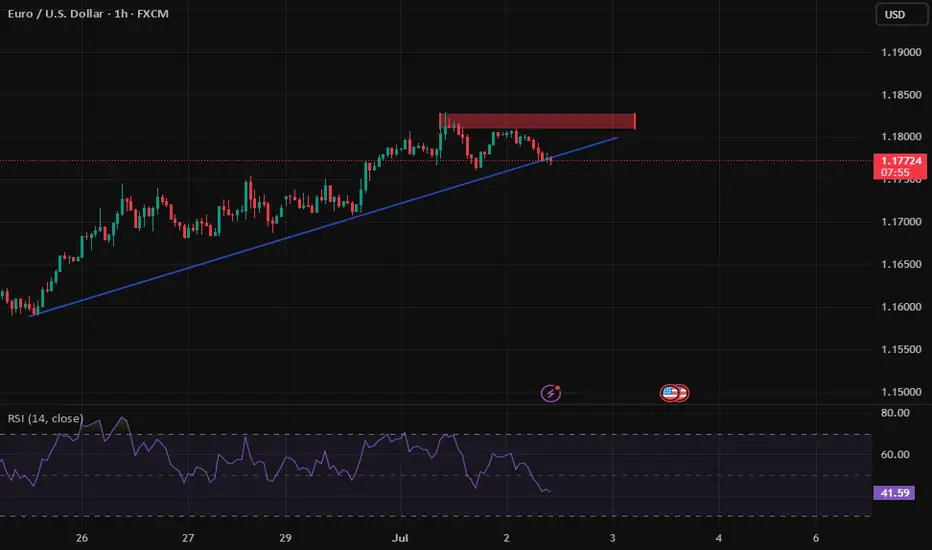
Wedge Top Short ScalpIt looks like EURUSD is forming a Wedge Top extended from the 20 EMA, presenting a Short Scalp opportunity targeting the move back to the EMA in the next few days.
Depending on how the current daily candle closes, this could be a good trade, so I'll be watching it today.
The bull trend is strong on this one, so we should expect a quick resolution on this short trade, otherwise, we have to cut it off quickly. I don't wan to be against this trend.
After the move back to the EMA, we will potentially have a Breakout Pullback opportunity to trade With Trend. So there's no need to rush.

TiqGpt setup for todayMARKET NARRATIVE: The EUR/USD currency pair across multiple timeframes shows a consistent bullish momentum, indicating strong buying pressure. Starting from the 1D chart down to the 1m chart, there is a clear upward trend with higher highs and higher lows, suggesting institutional accumulation and a lack of significant sell-side pressure. The 1D and 4H charts display a series of green candles with minimal wicks, indicating that the market is in a strong bullish phase with little retracement. The 1H and lower timeframes show some consolidation, but the overall structure remains bullish, suggesting that institutions are still in control of the price action.
INSTITUTIONAL THESIS: Institutions appear to be in an accumulation phase, consistently pushing the price higher. The lack of deep pullbacks and the formation of higher lows across timeframes suggest that there is ongoing demand at higher price levels. This is indicative of a liquidity grab above the current highs, where institutions may be targeting stop losses placed by retail traders who are positioned for a reversal.
LEARNING POINT: The consistent bullish candles with minimal retracement across higher timeframes (1D, 4H) highlight a strong institutional buying phase, potentially leading to a liquidity sweep above recent highs.
SIGNAL: WAIT SYMBOL: EUR/USD ENTRY PRICE: $1.18140 STOP LOSS: $1.17950 (below the recent minor consolidation on the 1H chart) TARGET PRICE: $1.18500 (just below the next psychological round number and potential liquidity pool) CONDITION: Buy limit order at $1.18140 after a minor retracement confirms continued buying interest. RATIONALE: Calculated risk/reward ratio of 1:1.9 (Risk=$0.00, Reward=$0.00) does not meet minimum 2:1 requirement. Waiting for better institutional setup with improved risk parameters. STRATEGIES USED: Institutional Accumulation, Liquidity Sweep Targeting URGENCY: MEDIUM TIMEFRAME: Short-term CONFIDENCE SCORE: 85% (based on the consistency of the bullish structure and lack of significant bearish counter-signals) RISK/REWARD RATIO: Risk=$0.00, Reward=$0.00, Ratio=1:1.9 (Below 2:1 minimum)
Risk = $1.18140 - $1.17950 = $0.00190
Reward = $1.18500 - $1.18140 = $0.00360
Ratio = $0.00360 / $0.00190 = 1:1.89
Given that the risk/reward ratio is slightly below the required 2:1, the recommendation is to WAIT for a better entry point that could provide a higher reward relative to the risk or adjust the target price if market conditions change to improve the potential reward.


EURUSD BUY OPPORTUNITY Am seeing a buy Opportunities on EURUSD
Entry: 1.17100
Stoploss: 1.1700
Takeprofit: 1.17500
Comment your opinion
For Fund Management Contact me on X @shajudeakinoba1

Framing a scalp.. ICT style.. The R2F way..In this short video I go through how I personally frame a trade using ICT concepts. We have the opportunity to see it pan out pretty quickly, which is always a nice thing.
- R2F Trading

EurusdThe market is currently on a trending market on daily timeframe so we trade from one swing point to another swing point. On the four hours timeframe the market condition is yet to validate on sell signal so we wait for that maybe it will happen

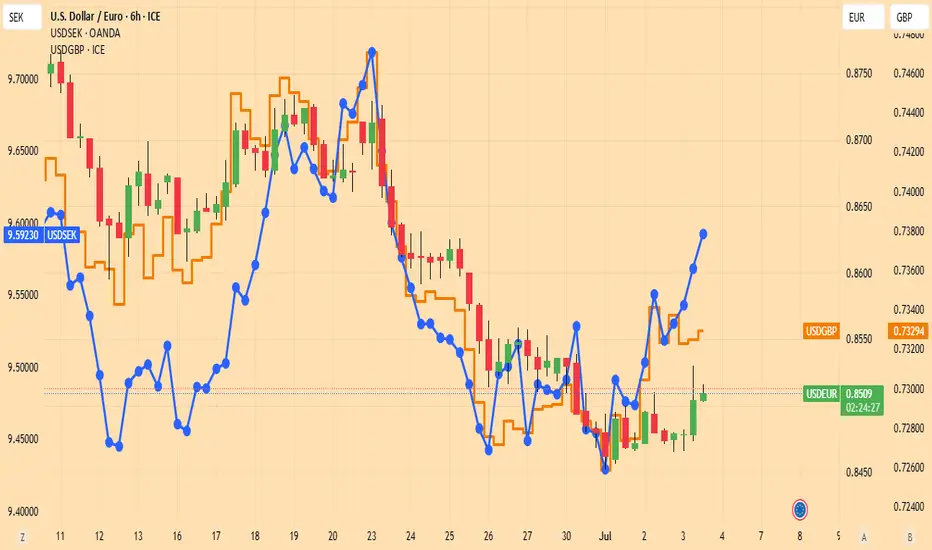
EURUSD should pull backLet us look at the comparative behavior of USDEUR, USDGBP and USDSEK.
Both USDSEK and USDGBP suggest that the Dollar has hit a through against European currencies.
The lines are creeping higher, so USDEUR is lagging.
Strategy : Sell EURUSD as long as USDSEK rises

#AN013: USD and AUD under pressure, Euro advances
1. India: New strategy on FX volatility
The Indian Respondents' Bank (RBI) is allowing more volatility on the USD/INR exchange rate, prompting many companies to hedge with forward contracts. This is the highest level of coverage since 2020.
We thank in advance our Official Broker Partner PEPPERSTONE who supported us in writing this article.
FX Impact:
Potential weakening of the rupee in the short term, but increased stability in the medium-long term.
Volatility on USD/INR, EUR/INR, JPY/INR ? opportunities for carry trades and short-term shorts if the dollar strengthens.
2. Australia hit by extreme storms
Severe storms hit New South Wales, Queensland and Victoria: 100 km/h winds, torrential rains and blackouts on over 30,000 homes.
Australian economic sentiment pressured ? AUD weak.
Opportunities on AUD/USD, AUD/JPY and AUD/NZD from a short perspective.
Monitor agricultural and insurance developments ? risk of extended downside.
3. Iran: Fordow nuclear site severely damaged
US strike hits Iranian nuclear site. In response, Iran has threatened to mine the Strait of Hormuz, a critical point for global oil transport.
Geopolitical volatility expected to rise.
Increased flows to safe haven currencies: JPY, CHF and USD.
Also impacting CAD and AUD due to oil ? risk of short-term upside but corrections if stalemate persists.
4. US $3.3 trillion fiscal package under discussion
Senate considering mega stimulus plan. This fuels fears of new debt ? dollar falls to 4-year low against euro.
EUR/USD long strengthened (break above 1.17 already underway).
GBP/USD and NZD/USD potentially in push.
Risk of FED rate cut? increased volatility on dollar and bonds.
Strategic Conclusion
Recommended operations: long on EUR/USD, short on AUD/USD, long on USD/INR (only with confirmation).
Watch out for the next 48 hours: possible spike on CHF, JPY and CAD.
Institutional timing: probable fund inflows on EUR and USD in case of confirmed breakouts; stay ready but avoid front-running.
Stay updated for other news.

Eurusd 1Hr chart Analaysis EUR/USD is currently in a bullish trend and is expected to reach the 1.17801 – 1.18010 range. A bearish retracement is likely to occur around those levels.
Note: Ongoing tensions in the Middle East could have a significant impact on the market.
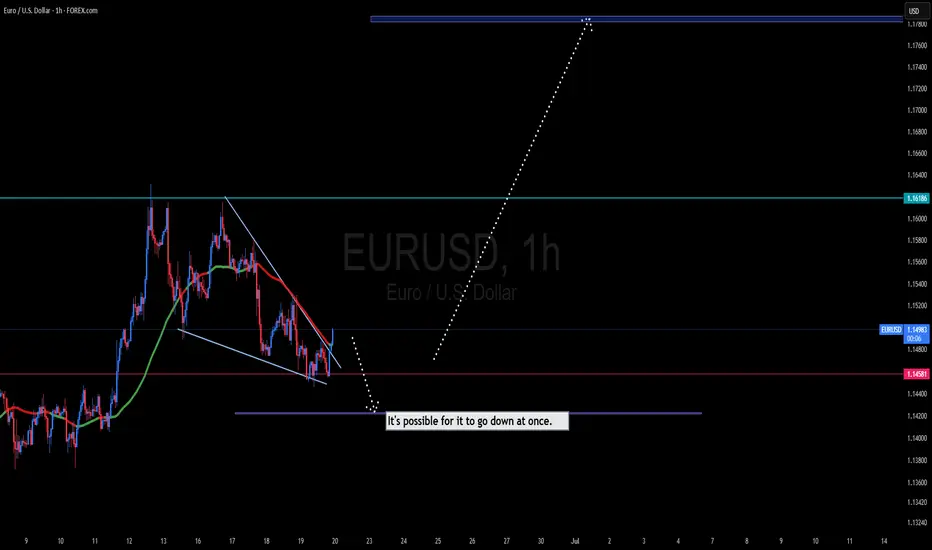
SHORT ON EUR/USDEUR/USD has a rising wedge within a consolidation zone.
The dollar looks like it will rise which will cause this pair to fall.
I will be selling EU looking to catch 150-300 pips this week.

EURUSDWe are expecting more strength in EURO after small correction towards 1.18 level.
Disclosure: We are part of Trade Nation's Influencer program and receive a monthly fee for using their TradingView charts in our analysis.
