EUR/USD💰Symbol: { EUR/USD }
🟩Price: { 1.16718 }
🟥Stop: { 1.17304 }
1️⃣profit: { 1.16336 }
2️⃣profit: { 1.15863 }
3️⃣profit: { 1.15332 }
4️⃣profit: { 1.14574 }
📊Check your chart before entering.
🚨Check before use to make sure there is no important news.🚨
EURUSDTDTM trade ideas

Hellena | EUR/USD (4H): LONG to the resistance area 1.17300.Colleagues, I believe that the upward five-wave impulse is not over yet. At the moment, I see the formation of wave “3” of the lower order and wave “3” of the middle order, which means that the upward movement will continue at least to the resistance area of 1.17300. This area is located between two levels (1.16529-1.18252) of Fibonacci extension.
A correction is possible — be careful.
Manage your capital correctly and competently! Only enter trades based on reliable patterns!

EURUSD h4 strongly bullish Instead of buying the breakout, consider selling the exhaustion. Be open to:
Short setups near 1.18500
Re-entry zones after BOS failure
Lower time-frame signs of momentum divergence

EUROUSD updates chartEUR/USD Sell Setup Active 🔻
Pair rejected key resistance zone near 1.0740 – entering sell position now.
📉 Short-term momentum favoring bears.
🎯 Target: 1.0650 → 1.0600
🛑 Stop Loss: Above 1.0755
🕰️ H1/H4 confluence confirms downside pressure.
Trendline + RSI divergence = high-probability short!
📌 Plan the trade. Trade the plan.

EURUSD Breakout and Potential RetraceHey Traders, in today's trading session we are monitoring EURUSD for a buying opportunity around 1.15700 zone, EURUSD was trading in a downtrend and successfully managed to break it out. Currently is in a correction phase in which it is approaching the retrace area at 1.15700 support and resistance area.
Trade safe, Joe.

EURUSD| - Inducement Fueling Bullish Intent📌 Pair: EURUSD
📈 Bias: Bullish
🕰 HTF View (4H):
Clear bullish intent shown with a break above major external structure (higher high). Inducement remains intact—expecting that draw to price. Strong bullish momentum signals smart money positioning for more upside.
🧭 MTF Clarity (2H → 30M):
30M structure refined and leaning bullish, but using 2H for confirmation. Waiting on liquidity sweep into the OB zone for entry precision.
🎯 Entry Criteria:
LTF CHoCH → Liquidity Sweep → OB Mitigation
(Execution in that exact order for maximum confirmation)
🎯 Target: Structure highs above
🧠 Mindset Note:
Let the inducement play out—don’t rush it. This is where patience and clarity separate a sniper from a scalper. One clean entry > 10 reactive trades.
Bless Trading!

EURO - Price can continue to decline inside wedge patternHi guys, this is my overview for EURUSD, feel free to check it and write your feedback in comments👊
Some days ago, price tried to grow, but failed and dropped below $1.1220 support level, after which started to grow in channel.
In rising channel, price broke $1.1220 level one more time and then rose to resistance line and then corrected.
Next, Euro rose to $1.1455 level and some time traded inside this level, until it broke it and continued to move up.
Price exited from rising channel and later started to decline inside wedge pattern, where it declined to $1.1455 level.
Recently, price bounced from this level and in a short time rose to resistance line of wedge pattern.
In my mind, Euro can continue to decline to $1.1400 support line of wedge, breaking support level.
If this post is useful to you, you can support me with like/boost and advice in comments❤️
Disclaimer: As part of ThinkMarkets’ Influencer Program, I am sponsored to share and publish their charts in my analysis.

EUR/USD 4H CHART IDEA"EUR/USD is currently trading within a key price range, showing signs of consolidation after recent volatility. The pair is testing support near the 1.0700 level while facing resistance around 1.0800. A breakout from this zone could set the tone for the next directional move. Traders should monitor upcoming economic data from the Eurozone and the US, as it may trigger strong momentum either way. The trend remains neutral in the short term, awaiting a clear confirmation."
This is just an idea not financial advice.

MarketBreakdown | EURUSD, GBPUSD, USDJPY, USDCHF
Here are the updates & outlook for multiple instruments in my watch list.
1️⃣ #EURUSD weekly time frame 🇪🇺🇺🇸
The pair is unstoppable.
The market violated a significant weekly resistance cluster last week.
It opens more growth potential after a pullback.
2️⃣ #GBPUSD weekly time frame 🇬🇧🇺🇸
In comparison to EURUSD, GBPUSD is now approaching a major
resistance area. I think that we can expect a retracement from that.
3️⃣ #USDJPY daily time frame 🇺🇸🇯🇵
The market continues a correctional movement lower.
The closest strong support that I see is based on a rising trend line.
I think that buying interest may spark again after its text.
4️⃣ #USDCHF daily time frame 🇺🇸🇨🇭
The price updated a historic low on Friday.
The next strong support that I see is based on a falling trend line.
We can expect a pullback from that.
Do you agree with my market breakdown?
❤️Please, support my work with like, thank you!❤️
I am part of Trade Nation's Influencer program and receive a monthly fee for using their TradingView charts in my analysis.

Could the Fiber reverse from here?The price is reacting off the pivot which is a pullback resistance and could drop from this level to the 1st 50% Fibonacci support.
Pivot: 1.1631
1st Support: 1.1552
1st Resistance: 1.1677
Risk Warning:
Trading Forex and CFDs carries a high level of risk to your capital and you should only trade with money you can afford to lose. Trading Forex and CFDs may not be suitable for all investors, so please ensure that you fully understand the risks involved and seek independent advice if necessary.
Disclaimer:
The above opinions given constitute general market commentary, and do not constitute the opinion or advice of IC Markets or any form of personal or investment advice.
Any opinions, news, research, analyses, prices, other information, or links to third-party sites contained on this website are provided on an "as-is" basis, are intended only to be informative, is not an advice nor a recommendation, nor research, or a record of our trading prices, or an offer of, or solicitation for a transaction in any financial instrument and thus should not be treated as such. The information provided does not involve any specific investment objectives, financial situation and needs of any specific person who may receive it. Please be aware, that past performance is not a reliable indicator of future performance and/or results. Past Performance or Forward-looking scenarios based upon the reasonable beliefs of the third-party provider are not a guarantee of future performance. Actual results may differ materially from those anticipated in forward-looking or past performance statements. IC Markets makes no representation or warranty and assumes no liability as to the accuracy or completeness of the information provided, nor any loss arising from any investment based on a recommendation, forecast or any information supplied by any third-party.

Back to low?The EUR/USD has been moving in a tight range around 1.1600 on Tuesday's European session, buoyed by a risk appetite, despite accusations of ceasefire violations in the Middle East. The pair had jumped about 1.30% from the previous day's lows following the announcement of a truce in the Middle East and holds gains with all eyes on the Federal Reserve's (Fed) Chairman Jerome Powell's testimony to Congress.
A confirmation below 1.15798 level would cancel the bullish view and bring the June 19 and June 22 low at 1.1445 back to the focus.

EURUSD I Monthly CLS I KL -MOB I Model 1Hey, Market Warriors, here is another outlook on this instrument
If you’ve been following me, you already know every setup you see is built around a CLS Footprint, a Key Level, Liquidity and a specific execution model.
If you haven't followed me yet, start now.
My trading system is completely mechanical — designed to remove emotions, opinions, and impulsive decisions. No messy diagonal lines. No random drawings. Just clarity, structure, and execution.
🧩 What is CLS?
CLS is real smart money — the combined power of major investment banks and central banks moving over 6.5 trillion dollars a day. Understanding their operations is key to markets.
✅ Understanding the behavior of CLS allows you to position yourself with the giants during the market manipulations — leading to buying lows and selling highs - cleaner entries, clearer exits, and consistent profits.
📍 Model 1
is right after the manipulation of the CLS candle when CIOD occurs, and we are targeting 50% of the CLS range. H4 CLS ranges supported by HTF go straight to the opposing range.
"Adapt what is useful, reject what is useless, and add what is specifically your own."
— David Perk aka Dave FX Hunter ⚔️
👍 Hit like if you find this analysis helpful, and don't hesitate to comment with your opinions, charts or any questions.

EUR/USD Holds Above Support – Watching 1.17400 and BeyondHi Everyone,
As highlighted, a successful bounce from the near-term support at 1.16680 provided a retest of the 1.17400 zone. Looking ahead, we expect price action to revisit this level in the coming week.
A confirmed break above this resistance could open the path toward 1.18000, where we anticipate encountering dynamic resistance.
As outlined in our analysis last week, we anticipated a continued move higher toward the 1.16564 and 1.18325 levels, provided price held above 1.14483.
Price respected this level, and EUR/USD extended its rally, reaching our first key target at 1.16564 and pushing above 1.17400 — marking the highest level since February 2022.
We will provide further updates on the projected path for EUR/USD should price reach this level.
The longer-term outlook remains bullish, with expectations for the rally to extend toward the 1.2000 level, provided the price holds above the key support at 1.10649.
We will continue to update you throughout the week with how we’re managing our active ideas and positions. Thanks again for all the likes/boosts, comments and follows — we appreciate the support!
All the best for a good end to the week. Trade safe.
BluetonaFX

Lingrid | EURUSD Pullback - Awaiting Trend Continuation SignalFX:EURUSD is consolidating above the upward trendline after forming a triangle within the broader ascending channel. The recent pullback tested the 1.1444 support zone, with a rebound hinting at renewed bullish pressure. A push beyond 1.1620 could unlock upside toward the 1.1700 resistance mark.
📈 Key Levels
Buy zone: 1.1444–1.1470
Sell trigger: breakdown below 1.1444
Target: 1.16200
Buy trigger: breakout above 1.1523 resistance
💡 Risks
Triangle breakdown could shift the short-term bias bearish
Failure to reclaim 1.1620 may stall bullish momentum
A sharp drop below the black trendline would invalidate the structure
If this idea resonates with you or you have your own opinion, traders, hit the comments. I’m excited to read your thoughts!

EUR/USD – Weak Expectations, Neutral German CPI📉 EUR/USD – Weak Expectations, Neutral German CPI, and Bearish Momentum Ahead
Bias: Short / Sell Setup
EUR/USD recently surged toward the 1.0750 zone sooner than expected, driven more by market optimism and speculative flows than solid fundamentals.
Now, that optimism is starting to fade as data fails to back it up.
Meanwhile, the potential U.S. tax reform proposal (Trump) and signs of renewed trade negotiations are helping shift sentiment back toward the U.S. dollar in the coming 10 days.
---
🇩🇪 German CPI – Neutral Print, But Bearish Implications
Today's regional inflation figures across German states were mixed:
States like Saxony and Baden-Württemberg showed slightly rising prices
Others like Bavaria and North Rhine-Westphalia showed declining YoY inflation
Final national CPI due later today is unlikely to beat expectations meaningfully
🎯 Summary: A Neutral CPI Print
No upside surprise → No support for EUR
No major downside → No panic either
---
🧠 Why "Neutral" Data Can Still Be Bearish for EUR
The market was hoping for a strong CPI to signal that ECB may pause rate cuts
Neutral inflation = ECB may still lean dovish
EUR rose on hope — but data offered no confirmation
In financial markets, failed expectations often trigger stronger corrections than bad news.
---
🔍 Technical Overview:
Price approaching strong supply zone near 1.0740 – 1.0760
RSI showing divergence on lower timeframes (H1)
Structure on M15 suggests potential for lower highs
Price stalling under resistance, with no bullish momentum follow-through
---
🎯 Trade Plan:
Bias: Short
Entry Zone: 1.0730 – 1.0755
Stop Loss: Above 1.0775
Take Profit 1: 1.0630
Take Profit 2: 1.0600
Trigger: Break of M15 bearish structure or supply reaction
---
📌 Markets punish over-optimism more than fear.
EUR/USD may correct lower as hopes of a strong CPI fade and macro flows tilt toward the USD.

short eurusdsell eurusd if the 4hr candle on IDC broker(this exact broker im currently using) closes as a bear candle

MASSIVE EURUSD SHORT We could see a breakdown of 30% on the MIL:EURO
There has been too much printing and liquidity is drying up

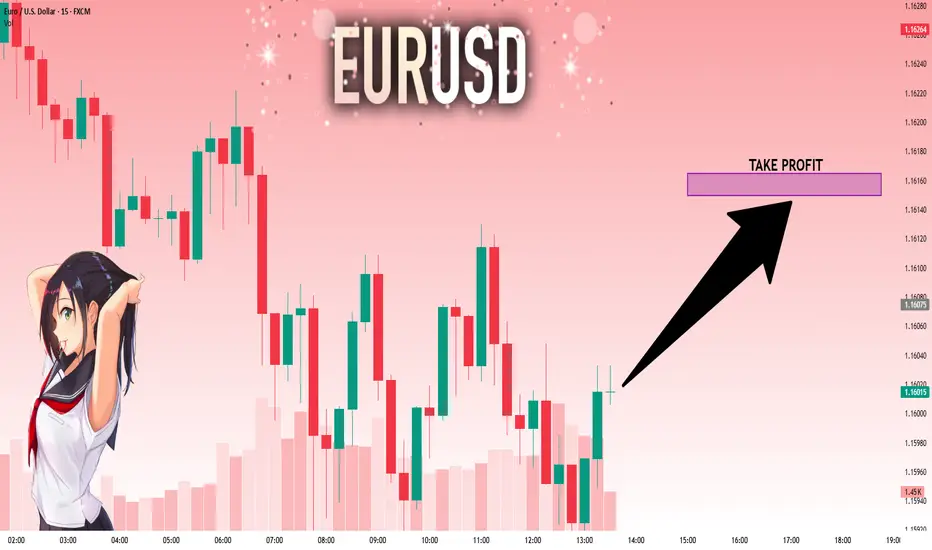
EUR/USD 15 MINUTE CHART PATTERN Thanks for sharing your EUR/USD trade setup. Here's a quick breakdown and risk-reward assessment for your 15-minute BUY entry strategy:
---
🟢 Trade Setup (Long)
Pair: EUR/USD
Entry: 1.16025
Stop Loss: 1.15780
Targets:
🎯 Target 1: 1.16361
🎯 Target 2: 1.16700
🎯 Target 3: 1.17090
---
🔍 Risk/Reward Ratios
Let’s calculate approximate Risk-to-Reward (R:R) for each target:
🔻 Risk: 1.16025 - 1.15780 = 24.5 pips
Reward to Target 1:
1.16361 - 1.16025 = 33.6 pips
✅ R:R ≈ 1.37
Reward to Target 2:
1.16700 - 1.16025 = 67.5 pips
✅ R:R ≈ 2.75
Reward to Target 3:
1.17090 - 1.16025 = 106.5 pips
✅ R:R ≈ 4.35
---
⚠ Key Notes:
Your stop loss is tight (24.5 pips), which is good for managing risk, but watch for minor price noise or wicks around support.
Best suited if price has broken out of consolidation or is in a strong uptrend on M15/M30.
Monitor news events (e.g., USD data, ECB statements) that can spike volatility.
Consider scaling out at each target to lock in profits and reduce exposure.

EURUSD Elliott Wave Update: Upward Momentum ResumesThe EURUSD Elliott Wave sequence initiated from the September 2022 low reveals an incomplete bullish structure, signaling potential for further upside. A short-term rally from the May 29, 2025 low is currently unfolding as a five-wave impulse. As depicted in the 1-hour chart below, wave ((i)) peaked at 1.16319. A corrective wave ((ii)) followed which concluded at 1.14435. The internal structure of wave ((ii)) formed a zigzag pattern, with wave (a) declining to 1.1486 and wave (b) rebounding to 1.1614. Wave (c) completed the correction at 1.144, finalizing wave ((ii)) in the higher degree.
The pair has resumed its ascent in wave ((iii)), exhibiting an impulsive internal subdivision. From the wave ((ii)) low, wave i advanced to 1.1544, followed by a minor dip in wave ii to 1.1451. Wave iii surged to 1.1641, with a subsequent wave iv pullback ending at 1.1587. The final leg, wave v, culminated at 1.1745, completing wave (i) in the higher degree. A corrective wave (ii) pullback, likely a three-wave zigzag, appears to have concluded at 1.1678. However, a break above the wave (i) high at 1.1745 is required to negate the possibility of a double correction lower. Given the shallow nature of the wave (ii) pullback, the risk of a deeper correction remains. However, as long as the pivotal low at 1.144 holds, dips should attract buyers in 3, 7, or 11 swings, supporting further upside momentum.

EURUSD: Strong Growth Ahead! Long!
My dear friends,
Today we will analyse EURUSD together☺️
The in-trend continuation seems likely as the current long-term trend appears to be strong, and price is holding above a key level of 1.16017 So a bullish continuation seems plausible, targeting the next high. We should enter on confirmation, and place a stop-loss beyond the recent swing level.
❤️Sending you lots of Love and Hugs❤️
EUR/USD Key Fibonacci Resistance into Q3 OpenIt's been a strong first-half of the year for EUR/USD.
As we came into 2025 it seemed a story of doom and gloom for the Euro, and calls for parity were practically everywhere. But the pair found support in January, held that support in February - and then broke out in a big way in March.
As we wind down Q2 that breakout remains in-play and EUR/USD is pushing fresh three-year highs as the USD sets its own fresh three-year lows.
Of interest is a simple Fibonacci retracement drawn from the 2021-2022 major move in the pair.
The 61.8% retracement is what caught the highs in 2023, and the 38.2% marker is what caught the low in April of last year, which held until that late-year breakdown. Along the way, the 50% mark at 1.0943 came into play as support and resistance multiple times.
And as the breakdown took hold through the 2025 open, it was the 23.6% retracement that showed up to catch the lows, right around the 1.0200 handle. As prices has posed a strong recovery over the past four months and change, the levels as taken from that Fibonacci retracement have exhibited a number of inflection points.
And now we have the 78.6% retracement coming into play to mark this week's highs. Notably - the pair is currently overbought on both the daily and weekly charts. And while it's difficult to justify strength in a USD that's been beaten down over the past four months, if looking for a turn - whether it's a simple pullback or perhaps the start of something larger, this resistance in EUR/USD remains a big spot to follow on the chart.
Quarterly cuts can be interesting junctures to investigate for turn potential, especially considering the bearish reversal in EUR/USD around the Q4 open last year. - js

EURUSDEUR/USD Bias: Bullish
(Market is positioned for euro strength vs. dollar weakness, so EUR/USD likely to move higher)
Speculators are confident in euro strength, and mildly bearish on the dollar — giving EUR/USD a clear upward bias.

EUR/USD – Consolidation and Uptrend Channel Analysis!Price is holding inside a well-defined uptrend channel on the 1-hour timeframe.
The trend remains bullish as long as price respects the channel structure.
Currently, we see consolidation near the upper zone, showing market indecision.
A breakout above consolidation will confirm bullish continuation.
If this happens, buyers can look for momentum entries to the upside.
However, if price breaks down below channel support and consolidates under it,
the bias will shift to bearish and open the way for deeper corrections.
Target in case of breakdown: 1.1400 – strong support and liquidity area.
Trading Plan:
Stay bullish while price is inside the channel.
Only turn bearish on a clean break and retest below the channel.
Avoid trading inside the middle of consolidation to reduce false signals.
Patience and confirmation are essential before taking any positions.
