EUR/USD Key Fibonacci Resistance into Q3 OpenIt's been a strong first-half of the year for EUR/USD.
As we came into 2025 it seemed a story of doom and gloom for the Euro, and calls for parity were practically everywhere. But the pair found support in January, held that support in February - and then broke out in a big way in March.
As we wind down Q2 that breakout remains in-play and EUR/USD is pushing fresh three-year highs as the USD sets its own fresh three-year lows.
Of interest is a simple Fibonacci retracement drawn from the 2021-2022 major move in the pair.
The 61.8% retracement is what caught the highs in 2023, and the 38.2% marker is what caught the low in April of last year, which held until that late-year breakdown. Along the way, the 50% mark at 1.0943 came into play as support and resistance multiple times.
And as the breakdown took hold through the 2025 open, it was the 23.6% retracement that showed up to catch the lows, right around the 1.0200 handle. As prices has posed a strong recovery over the past four months and change, the levels as taken from that Fibonacci retracement have exhibited a number of inflection points.
And now we have the 78.6% retracement coming into play to mark this week's highs. Notably - the pair is currently overbought on both the daily and weekly charts. And while it's difficult to justify strength in a USD that's been beaten down over the past four months, if looking for a turn - whether it's a simple pullback or perhaps the start of something larger, this resistance in EUR/USD remains a big spot to follow on the chart.
Quarterly cuts can be interesting junctures to investigate for turn potential, especially considering the bearish reversal in EUR/USD around the Q4 open last year. - js
EURUSDTDTM trade ideas

EUR/USD BULL RAID: Quick Profit Heist Before the Drop!🏴☠️ EUR/USD "The Fiber" HEIST ALERT: Bullish Loot Before the Trap! 🚨💰
🌟 Greetings, Market Pirates & Profit Raiders! 🌟
Hola! Oi! Bonjour! Hallo! Marhaba! 🤑
🔥 Thief Trading Strategy Activated! 🔥
Our bullish heist on EUR/USD is LIVE—time to swipe the loot before the bears set their trap! 🎯💸
📈 Entry (Vault is OPEN!):
Buy Limit Orders preferred (15M/30M swing levels).
Alert up! Don’t miss the breakout.
🛑 Stop Loss (Escape Route):
Nearest Swing Low (1.15200) on 30M TF.
Adjust for your risk & lot size—no reckless robberies!
🎯 Target (Profit Hideout): 1.16400
Scalpers: Stick to LONG only—trail your SL to lock gold!
Swing Traders: Ride the wave or split the haul.
⚡ Why This Heist?
Bullish momentum + weak bears = perfect robbery conditions.
Overbought? Yes. Risky? Absolutely. But thieves thrive in chaos!
📢 Pro Tip:
Avoid news spikes (volatility = jail time for unprepared traders).
Trailing SL = Your Getaway Car.
💥 BOOST THIS PLAN!
Hit 👍, share 🔄, and let’s drain this market together! More heists coming—stay tuned! 🚀🐱👤
(Disclaimer: Trade smart. We’re thieves, not gambleers.)

EUR/USD Daily Timeframe Analysis – Bullish OutlookOn the daily chart, the EUR/USD pair shows a clear bullish bias in the long term, backed by strong upward momentum in recent sessions.
🔹 Price Action Overview:
Last week, EUR/USD printed a strong impulsive move to the upside, indicating increased bullish interest and potential trend continuation. This momentum suggests that the bulls are firmly in control, at least for now.
🔹 What to Expect Next:
With the impulsive leg completed, we are now anticipating a short-term retracement. Price is likely to pull back into a key demand zone, previously acting as resistance, and now potentially flipping into support.
I've marked this retracement zone with a green circle on the chart, aligning with the price range:
📍 Key Trade Levels:
Buy Entry Zone: 1.15900 – 1.16100
(Expecting price to react at this former resistance turned support)
Stop Loss: 1.15400
(Below recent swing low to protect against invalidation)
Take Profit: 1.17300
(Targeting the next significant resistance area)
---
🧠 Trade Idea Summary:
This setup follows the classic "impulse–retracement–continuation" structure. As long as price holds above the retracement zone, we maintain a bullish outlook for EUR/USD.
🔔 Watch for bullish price action (e.g., pin bars, engulfing candles) within the buy zone before entering for confirmation.

EURUSD JUNE MONTH DELIVERY & NFP week ideasEURUSD
JUNE MONTH DELIVERY
*June closes with a expansion/accumulation monthly candle
*Price wicked to the Weekly SIBI from sept 2021
*Price expanded to come just below the parent range .79 Premium
*Note since May 13 price has been in a buy program with little retrace
*Price is delivering to a Premium market taking key equal highs last week
June 27 DELIVERY
*Thursday into Friday price consolidates
*Asia takes minor equal lows
*2 London macro expands to the buy side
*small retrace
*6 macro starts the expansion cycle to send Price to take equal highs
*10 silver bullet price reverses Londons delivery taking minor sell side
*14:00 macro Price retraces to close rebalancing NY am delivery
*Price closes just above the 50 in a premium
NFP WEEK IDEAS
Deep premium with little retrace last week-over bought
*I suspect that we could see a retrace/reversal beginning of NFP week
*could we see price come to the current range 50 level 1.16037
*Note the EV is in a discount could price retrace to that target for the week
June 30 IDEAS
*Parent bias is bull stick to it this week
*Sundays delivery Price could retrace to minor equal highs at the .618
*Note Dealers range is already 32 pips-setting up for a potential larger expansion day
*watch out for a possible consolidation cycle Monday-typical profile is expansion but we will see with no news
*Sundays delivery could consolidation
*Watch for reaction at .618 at minor equal highs
*see if we swing for higher prices in Asia to London and lower in NY for Mondays suspected delivery-read what the chart prints this is just an idea-its not my gospel

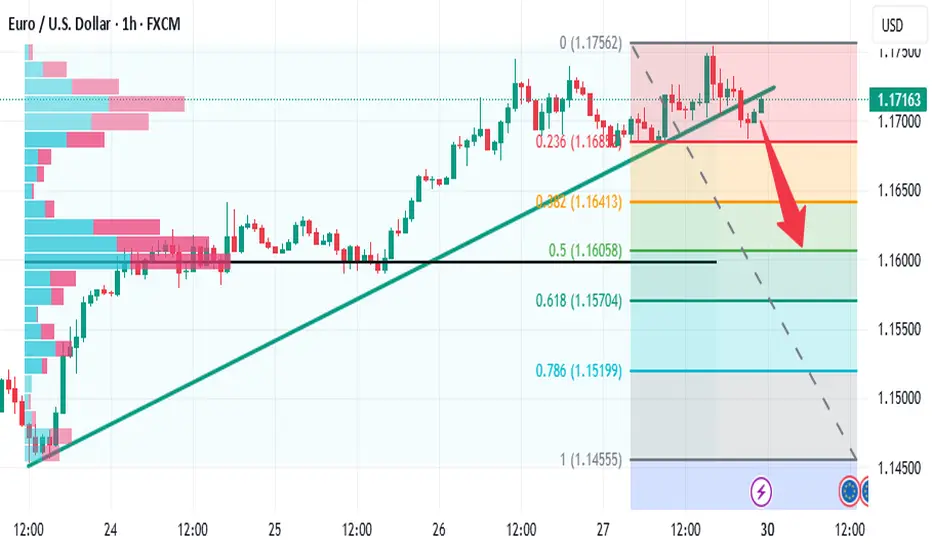
Lingrid | EURUSD Short-Term Correction. Counter Trend SetupThe price perfectly fulfilled my previous idea . FX:EURUSD completed a full impulse move from the bottom, touching the upper resistance line while showing clear bearish divergence at recent highs. Price is now hovering near 1.16450, with early signs of weakness below the ascending blue trendline. A breakdown from this zone could confirm a reversal toward the 1.15585 support and potentially deeper if momentum builds.
📉 Key Levels
Sell zone: 1.1630 – 1.1650
Sell trigger: break below 1.1600
Target: 1.15525
Buy trigger: breakout and hold above 1.1650
⚠️ Risks
Divergence may take time to fully play out
Reclaiming 1.1650 would negate bearish setup
Consolidation near highs may trap early sellers
If this idea resonates with you or you have your own opinion, traders, hit the comments. I’m excited to read your thoughts!

EURUSD next week bearishNext week local bearish correction to area 1.16.
If bears broke that area then next target 1.154 and 1.15
But if bulls push price above 1.175 bullish trend continue to 1.18+
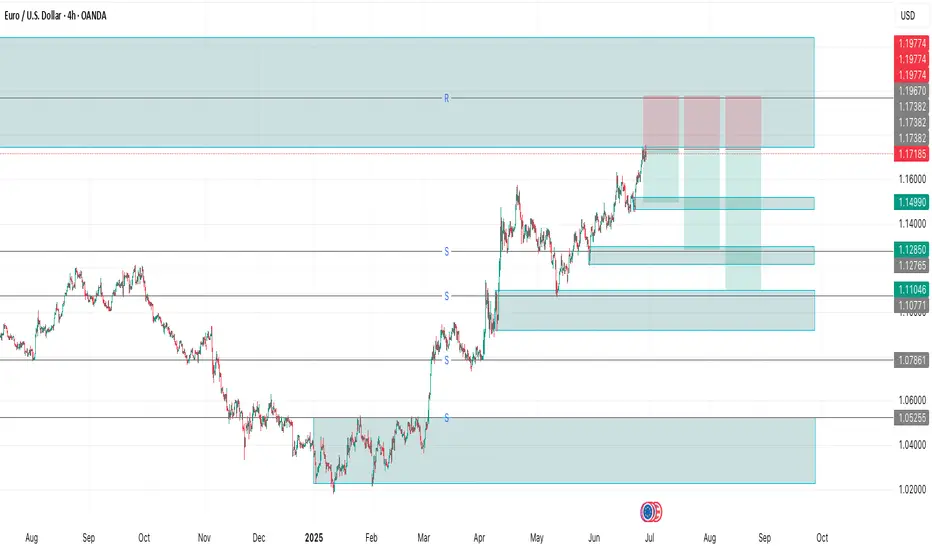
EUR/USD 4H – Approaching Major Supply Zone | Potential Mid-Term EUR/USD 4H – Approaching Major Supply Zone | Potential Mid-Term Reversal
Euro has extended its bullish rally into a historically strong supply/resistance zone around 1.17185 – 1.19774, which aligns with the previous rejection zone from mid-2024. Price is showing signs of slowing down near this upper boundary.
🔍 Key Technical Highlights:
Strong Supply Zone (1.1718 – 1.1977): A major resistance area that previously triggered sharp sell-offs. This zone is now retested after months of bullish recovery.
Momentum Divergence Potential: Price has climbed aggressively, but with signs of exhaustion visible on the lower timeframe candles.
Demand Zones Below:
First support at 1.15998
Followed by deeper demand areas at 1.14990, 1.12850, and 1.11046 – all marking clean reaction zones.
📊 Trade Setup:
Bias: Short (swing position)
Sell Entry Zone: 1.17185 – 1.19774
Stop Loss: Above 1.19800 (above key supply zone)
Take Profit Targets:
TP1: 1.15998
TP2: 1.12850
TP3: 1.11000
🧠 Tactical Note:
Watch for bearish confirmation (engulfing candle / structure break) before executing entries. A clean rejection from the supply zone could provide an attractive swing setup with a favorable risk-reward profile.
Eurusd Reaching physiological level of 1.17200 clear break and retest on the 2hr and 1hr , entering a counter trade to 1.16190

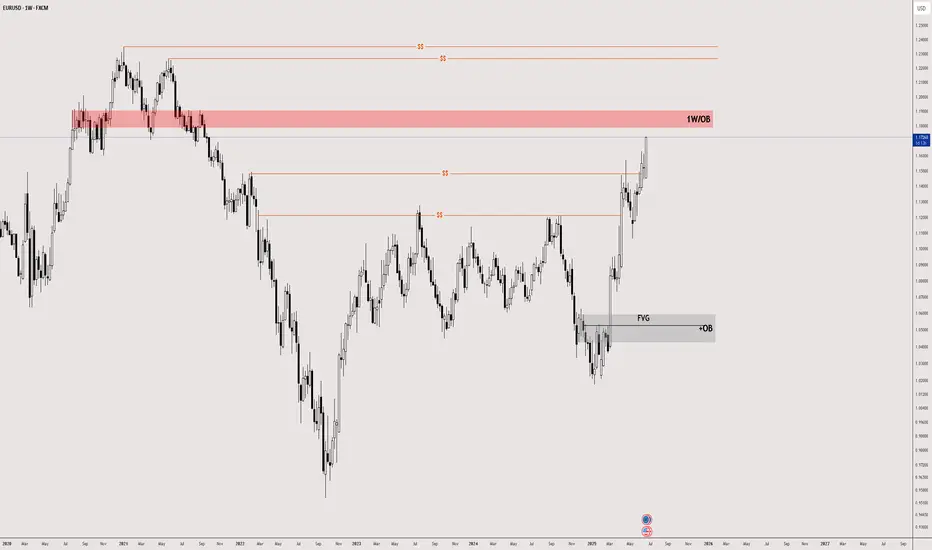
EU Weekly28/06 Narrative:
BSL taken out @ 1.16921
Bearish QT SMT has formed
After long push up, price may retrace to 50% (1.14096)
And continue higher to 1.17527 targeting 1.2200 big figure.

More upside for EUHi traders,
Last week EU started with a gap down. After the fill it swept the lows and after that it made the next impulsive wave up.
So next week after the finish of the correction down we could see more upside.
Let's see what the market does and react.
Trade idea: Wait for the finish of the correction down and a change in orderflow to bullish on a lower time frame. After a small correction down you could trade longs again.
If you want to learn more about trading with FVG's, liquidity sweeps and Wave analysis, then make sure to follow me.
This shared post is only my point of view on what could be the next move in this pair based on my technical analysis.
Don't be emotional, just trade your plan!
Eduwave

EURUSD - Potential buying opportunityLooking at EURUSD
We are still very bullish with no sign of it slowing.
I am aware of a potential weekly liquidity point to the left, however, until EURUSD shows its hand it's important that we still remain bullish.
We have set up a lovely liquidity point before a lovely demand area.
So I will be setting a pending order at the demand area after the New York close and the Asian session begins.

SMC Mechanical Entry Models✅ SMC Checklist:
1. Market Structure
🔹 Identify HTF Trend (H4 or H1): bullish, bearish, or range
🔹 Confirm Break of Structure (BOS) or Change of Character (CHoCH) on M15–M5
🔹 Look for lower highs/lows (downtrend) or higher highs/lows (uptrend)
2. Liquidity Zones
🔹 Look for equal highs/lows (liquidity pools)
🔹 Asian highs/lows — common targets during London/NY session
🔹 Recent internal range liquidity
🔹 Trendline liquidity — fakeouts often occur here
3. Premium & Discount Zones (PD Arrays)
🔹 Use Fibonacci from recent swing high to low
🔹 Look for entries at Discount (Longs) or Premium (Shorts) pricing
🔹 Ideal entries happen between 0.62–0.79 retracement
4. Supply & Demand Zones
🔹 Find fresh OBs (Order Blocks) that caused a break of structure
🔹 Use last bullish candle before strong drop (for short) or last bearish candle before strong rally (for long)
🔹 Confirm zone isn’t mitigated yet
5. Imbalance / Fair Value Gaps (FVG)
🔹 Identify large imbalanced candles (no wick overlap)
🔹 Ideal entries are inside the FVG aligned with direction
🔹 High probability if FVG is within OB or confluence with structure/liquidity
6. Confluences for Entry
🔹 Entry aligns with liquidity sweep or FVG/OB tap
🔹 Volume spike or rejection wick confirms interest
🔹 RSI divergence or exhaustion = bonus confirmation
🔹 Use M1/M5 for entry trigger after setup is formed on M15–H1
7. Entry Trigger
🔹 CHoCH or BOS on lower timeframe (M1-M5)
🔹 Confirmation with engulfing candle, FVG fill, or break/retest
🔹 SL below/above recent swing or OB boundary
8. TP/Exit Zones
🔹 TP1: After BOS/structure shift + partial
🔹 TP2: Next liquidity level (equal high/low or OB)
🔹 TP3: Opposite OB or major FVG
🔹 Adjust SL to breakeven after reaching TP1
9. Session Timing (Important)
🔹 Asian range → look for liquidity setup
🔹 London Open (3PM–6PM PH))→ manipulative move (liquidity grab)
🔹 NY Open (8PM–11PM PH) → continuation or reversal opportunity
🔹 Avoid high-impact news releases unless breakout
🔹 Use Forex Factory / MyFXBook for news calendar
10. Post-Trade Journaling:
🔹Screenshot HTF → LTF Setup (H4 > M15 > M1)
🔹Don’t skip journaling — it’s your #1 improvement tool.

EURUSD – Short-Term Top Signal, Sellers Getting ReadyEURUSD has reached the upper boundary of the ascending channel around 1.17190 and immediately faced selling pressure. This zone previously acted as a strong reversal area, and with a rejection candlestick and a forming FVG, the risk of a downward correction is increasing.
Currently, the price is moving sideways just below the high, forming lower highs — suggesting a possible distribution pattern before breaking the bullish structure. If price breaks below the FVG zone near 1.165–1.166, the move could extend toward the technical target at 1.15900 — aligning with the channel bottom and a historical liquidity area.
Recent fundamental drivers:
U.S. economic data remains strong (Jobless Claims, Core PCE) → supports USD strength
The ECB remains cautious and hasn’t committed to further rate hikes → slightly weakens the euro

Should we wait for a drop?Hello friends...
In the currency pair (EUR to USD), the price has experienced good growth.
As you can see, this growth has been sharp and there has been no significant correction to continue the trend. Perhaps we can expect the price to start correcting itself from the range specified in the image.
But due to the trend change, the price has to correct and continue its upward trend again (the trend is still upward in the upper time frame).
So in the coming weeks, you should expect a decline in the lower time frame.
.
I hope you have used our team's analysis well.
You can follow our page to see more analysis.

EURUSD: Strong Growth Ahead! Long!
My dear friends,
Today we will analyse EURUSD together☺️
The recent price action suggests a shift in mid-term momentum. A break above the current local range around 1.17284 will confirm the new direction upwards with the target being the next key level of 1.17538 and a reconvened placement of a stop-loss beyond the range.
❤️Sending you lots of Love and Hugs❤️


EURUSD Sell, June 27HTF shows reaction from W/D Orderblocks with multiple Daily imbalances below as downside targets. While GBPUSD is also at a valid D OB, EU gives clearer confirmation on LTF.
On LTF, price opened London above Asia highs (ideal for short setups) and showed 15m BOS into a 15m POI.
We've tapped into a 5m Orderblock inside the 15m zone, followed by a clean 1m BOS.
📍Entry: 5m OB with SL above highs (tight 10 pip risk)
🎯 TP1: 1:3 (75% off)
🎯 Final TP: Below Asia low & Daily imbalance
📉 Risk: 0.25% (reduced it for more consistency)
Confident setup — but if price rallies to the upper 5m OB and leaves without us, that’s part of the plan. No chasing.

EURUSD BuyExternal structure is bullish and the continuation structure failed to make the high. Price came lower and during Asia session it took out the low(inducement) and mitigated an Order Block. Price taking out the internal low that failed to create the higher high is the fuel to push upward. we need to wait and see how Frankfurt and London open play out. It is Friday so I'm not going to be surprised if it does some weird moves.

EURUSDShorting EUR/USD means you expect the euro to weaken against the U.S. dollar. In other words, you believe the dollar will gain strength or the euro will lose value — or both.
Reasons traders might short EUR/USD:
• The U.S. economy is performing better than the eurozone.
• Interest rates are rising faster in the U.S. than in Europe.
• Political or economic instability in the eurozone.
• Investors seeking safety in the dollar during global uncertainty.
How it works:
You sell the pair (EUR/USD) first, aiming to buy it back later at a lower price — profiting from the drop in the euro’s value versus the dollar.

EURUSD: Will Go Down! Short!
My dear friends,
Today we will analyse EURUSD together☺️
The recent price action suggests a shift in mid-term momentum. A break below the current local range around 1.17225 will confirm the new direction downwards with the target being the next key level of 1.17114.and a reconvened placement of a stop-loss beyond the range.
❤️Sending you lots of Love and Hugs❤️


EURUSD H4 I Bullish BounceBased on the H4 chart analysis, the price is falling toward our buy entry level at 1.1631, a pullback support.
Our take profit is set at 1.1745, a swing high resistance that aligns with the 161.8% Fib extension.
The stop loss is placed at 1.1582, an overlap support.
High Risk Investment Warning
Trading Forex/CFDs on margin carries a high level of risk and may not be suitable for all investors. Leverage can work against you.
Stratos Markets Limited (tradu.com ):
CFDs are complex instruments and come with a high risk of losing money rapidly due to leverage. 63% of retail investor accounts lose money when trading CFDs with this provider. You should consider whether you understand how CFDs work and whether you can afford to take the high risk of losing your money.
Stratos Europe Ltd (tradu.com ):
CFDs are complex instruments and come with a high risk of losing money rapidly due to leverage. 63% of retail investor accounts lose money when trading CFDs with this provider. You should consider whether you understand how CFDs work and whether you can afford to take the high risk of losing your money.
Stratos Global LLC (tradu.com ):
Losses can exceed deposits.
Please be advised that the information presented on TradingView is provided to Tradu (‘Company’, ‘we’) by a third-party provider (‘TFA Global Pte Ltd’). Please be reminded that you are solely responsible for the trading decisions on your account. There is a very high degree of risk involved in trading. Any information and/or content is intended entirely for research, educational and informational purposes only and does not constitute investment or consultation advice or investment strategy. The information is not tailored to the investment needs of any specific person and therefore does not involve a consideration of any of the investment objectives, financial situation or needs of any viewer that may receive it. Kindly also note that past performance is not a reliable indicator of future results. Actual results may differ materially from those anticipated in forward-looking or past performance statements. We assume no liability as to the accuracy or completeness of any of the information and/or content provided herein and the Company cannot be held responsible for any omission, mistake nor for any loss or damage including without limitation to any loss of profit which may arise from reliance on any information supplied by TFA Global Pte Ltd.
The speaker(s) is neither an employee, agent nor representative of Tradu and is therefore acting independently. The opinions given are their own, constitute general market commentary, and do not constitute the opinion or advice of Tradu or any form of personal or investment advice. Tradu neither endorses nor guarantees offerings of third-party speakers, nor is Tradu responsible for the content, veracity or opinions of third-party speakers, presenters or participants.

EUR/USD Biases (Long, Short, and Today’s View)EUR/USD Trading Biases: Navigating Bullish Momentum and Key Resistance Zones
This will be a concise market analysis essay (around 600–700 words) suitable for a financial audience, such as forex traders or analysts. Let me begin:
EUR/USD Trading Biases: Navigating Bullish Momentum and Key Resistance Zones
The EUR/USD pair, one of the most actively traded currency pairs in the forex market, has exhibited strong bullish momentum in recent sessions. As of June 26, 2025, the euro’s ascent against the dollar has brought it to a critical juncture, testing significant technical and psychological resistance levels. Traders are now weighing the potential for continued upside against growing signals of exhaustion and looming fundamental catalysts.
Bullish Outlook: A Technically Supported Advance
From a technical perspective, the bullish case for EUR/USD remains compelling. The pair is entrenched in a sustained uptrend, marked by successive breakouts above prior resistance levels and validated by daily and weekly closes above 1.1600. The current price action is converging on a crucial supply zone located between 1.1700 and 1.1900—an area historically known for triggering reversals but also pivotal in confirming trend continuation if broken convincingly.
Technical indicators further bolster the bullish narrative. The Relative Strength Index (RSI), while approaching overbought territory, is still supportive of higher prices. The Moving Average Convergence Divergence (MACD) displays a widening bullish histogram, and the Average Directional Index (ADX) confirms trend strength. Near-term resistance lies between 1.1680 and 1.1730, with potential for an extension to 1.1800 should the pair breach this upper band.
On the fundamental front, improved German Ifo business sentiment data has injected optimism into the eurozone outlook. Additionally, easing geopolitical tensions and a broader risk-on sentiment in global markets have undercut the dollar's safe-haven appeal. Speculation over potential Federal Reserve rate cuts further dampens dollar strength, creating tailwinds for EUR/USD.
Bearish Considerations: Resistance and Reversal Risks
Despite the encouraging trend, caution is warranted. The area between 1.1700 and 1.1900 represents a major weekly order block (OB) resistance—territory where several past rallies have lost steam. Oscillators such as the Commodity Channel Index (CCI) and RSI are showing signs of overextension, and the market is now vigilant for reversal patterns or signs of exhaustion.
Fundamentally, while the recent Ifo data is encouraging, it remains below the key threshold of 100, reflecting lingering skepticism about the eurozone's full recovery. Moreover, upcoming U.S. economic releases, particularly GDP figures and jobless claims, could act as potential catalysts for a dollar rebound. Hawkish commentary from Federal Reserve officials could also tilt sentiment, especially if it dampens expectations of rate cuts.
If EUR/USD fails to hold above the 1.1700–1.1730 resistance zone, a corrective move toward 1.1530–1.1500 becomes plausible. Deeper pullbacks could extend toward 1.1470 and 1.1390, especially if risk sentiment reverses or economic data surprises in favor of the dollar.
Today’s View: Bullish with a Note of Caution
For today, June 26, the prevailing bias remains bullish, yet increasingly cautious. The pair is testing the lower end of the 1.1700 OB zone. A decisive break and hold above this level would likely unleash further upside toward 1.1730 and 1.1800. However, overbought conditions and proximity to a known resistance zone suggest that traders should remain alert to potential rejection.
Intraday strategies favor buying on dips above 1.1600–1.1635, with stops placed just below 1.1600 and targets set at 1.1700–1.1730. Conversely, short positions should only be considered if there is a clear rejection from the 1.1700–1.1730 area, with downside targets at 1.1530–1.1500 and stops above 1.1800.
Conclusion
The EUR/USD is currently at a pivotal inflection point. While the bullish trend is intact and supported by both technical and fundamental factors, the proximity to a major resistance zone introduces a layer of complexity. Traders must remain agile—ready to ride a breakout higher if confirmed, but equally prepared to pivot if the pair falters and signals a reversal. In markets like these, timing and confirmation are everything.