Trading a Significant Divergence on EURUSDI saw a huge bearish divergence in EURUSD as the price moving up without backed up by volume. And also its MACD showing lower high vs the price making a higher high.
I am selling EURUSD for correction or trend reversal, both are possible from this level.
EURUSDTDTM trade ideas

EURUSD facing resistance at upper channel lineEURUSD facing resistance at upper channel line. It may retrace from here before upward momentum continues.

EUR/USD Weekly Technical Analysis – Testing Major Resistance📊 EUR/USD Weekly Technical Analysis – Testing Major Resistance 🔥📈
The EUR/USD pair is exhibiting a strong bullish momentum on the weekly timeframe, currently trading at 1.16562, and fast approaching a key resistance zone.
🔵 Key Observations:
📌 Resistance Zone:
Blue shaded area between ~1.16500 - 1.19000 is a major resistance level, historically tested in mid-2021.
A breakout above this zone could trigger a long-term bullish reversal toward 1.22793 (next major resistance marked by red arrow 🔴).
📌 Support Levels (Yellow Lines):
1.12821 🟡 – Previous minor resistance, could act as immediate support.
1.10543 🟡 – Key support from consolidation zone.
1.06775 & 1.04733 🟡 – Strong support levels during 2023-2024.
1.02063 & 0.96960 🟡 – Long-term base zones (2022 lows), showing double bottom formation (green arrows 🟢).
📌 Structure:
Formation of higher lows and higher highs, indicating bullish structure.
Recent breakout above consolidation range confirms momentum strength.
📌 Indicators (Bottom Right):
Suggest volatility and possible impact of economic or geopolitical events. ⚠️📅📌
⚠️ What to Watch For:
Rejection from Resistance could trigger a correction toward 1.12821 or lower.
Breakout above Resistance would expose 1.19000 → then 1.22793 (major target 🎯).
Weekly Close Above Resistance will be crucial to confirm the breakout.
📈 Bias: Bullish (Short to Mid-Term)
🧠 Strategy Tip: Traders may look for bullish continuation on breakout and retest above resistance, or short-term pullback entries around support if rejection occurs.

No change in EURUSDYesterday, EURUSD held above 1,1600 and maintained its bullish momentum.
Keep an eye out for a continuation of the trend and potential new highs.
New buying opportunities may arise after a pullback or on a breakout and retest.
Next target: 1,1706!

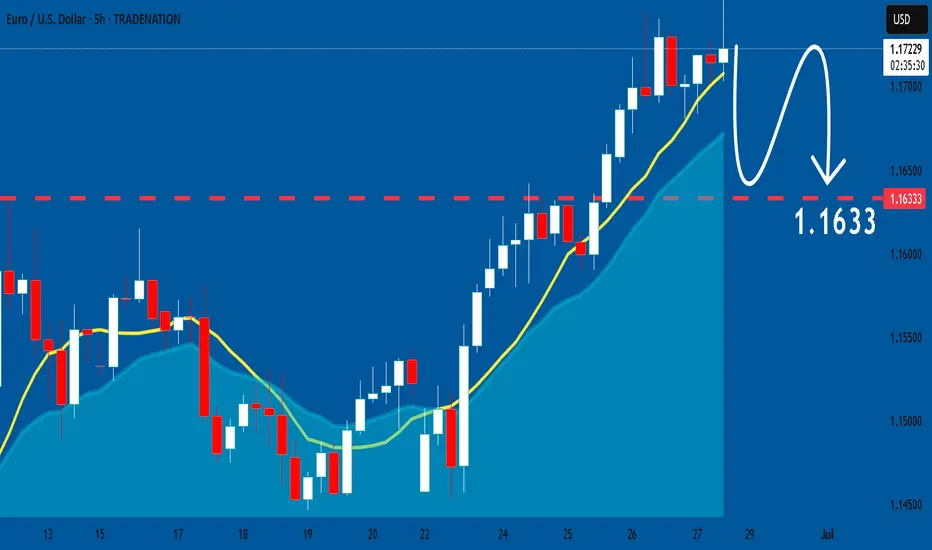
EURUSD Will Collapse! SELL!
My dear subscribers,
My technical analysis for EURUSD is below:
The price is coiling around a solid key level - 1.1716
Bias - Bearish
Technical Indicators: Pivot Points Low anticipates a potential price reversal.
Super trend shows a clear sell, giving a perfect indicators' convergence.
Goal - 1.1644
About Used Indicators:
By the very nature of the supertrend indicator, it offers firm support and resistance levels for traders to enter and exit trades. Additionally, it also provides signals for setting stop losses
Disclosure: I am part of Trade Nation's Influencer program and receive a monthly fee for using their TradingView charts in my analysis.
———————————
WISH YOU ALL LUCK

EURUSD - Shifting from Bearish to Bullish Soon!Hello TradingView Family / Fellow Traders. This is Richard, also known as theSignalyst.
📈EURUSD has been overall bullish trading within the rising wedge marked in blue.
Moreover, the orange zone is a strong support!
🏹 Thus, the highlighted blue circle is a strong area to look for buy setups as it is the intersection of support and lower blue trendline acting as a non-horizontal support.
📚 As per my trading style:
As #EURUSD approaches the blue circle zone, I will be looking for bullish reversal setups (like a double bottom pattern, trendline break , and so on...)
📚 Always follow your trading plan regarding entry, risk management, and trade management.
Good luck!
All Strategies Are Good; If Managed Properly!
~Rich
Disclosure: I am part of Trade Nation's Influencer program and receive a monthly fee for using their TradingView charts in my analysis.

EURUSD: Will Keep Falling! Here is Why:
Balance of buyers and sellers on the EURUSD pair, that is best felt when all the timeframes are analyzed properly is shifting in favor of the sellers, therefore is it only natural that we go short on the pair.
Disclosure: I am part of Trade Nation's Influencer program and receive a monthly fee for using their TradingView charts in my analysis.
❤️ Please, support our work with like & comment! ❤️
EURUSD – 2 Potential Intraday Setups (5-Min Chart)Chart Overview:
This 5-min EURUSD chart shows two example trade setups aligned with the main uptrend. These are shared purely for learning how to recognize and plan structured entries.
(Details are being shown in m5 chart- if this in not working for you please follow to be able to see it- as it is a private idea)
🔹 Example Trade 1 – 3rd Touch of Triangle Support
✅ Context:
Price retested the lower boundary of a broad triangle/wedge for the third time—often a strong area for reactive buys in an uptrend.
✅ Plan Concept:
Entry: Reversal signal on the 3rd touch.
Stop: Below the signal bar low.
Target: Mid to upper wedge area (or TP2).
🔹 Example Trade 2 – Breakout of Descending Flag
✅ Context:
After bouncing off trendline support, price formed a descending flag consolidation.
✅ Plan Concept:
Entry: Break and close above flag resistance.
Stop: Below the strong breakout candle.
Target: Extension toward recent highs (or TP2).
💡 Important:
These examples are not signals and not executed trades—they illustrate a possible planning process for traders studying price action strategies.
💡 Why These Matter:
Both setups align with the primary uptrend, use clear structure for risk placement, and rely on confirmation before entry.
🔹 Note:
These are educational examples only, not trade signals.
💬 Do you study similar setups? Share your charts and thoughts!
Thanks for your attention and your time...
Follow for more setups
#EURUSD #Forex #TradingEducation #PriceAction #IntradayTrading #BreakoutTrading #TechnicalAnalysis #LearnTrading #TradingView

PO3 (Manipulation spike into Premium → Distribution)Price swept liquidity above the recent high → tapped into FVG at a premium
BOS and CHOCH are already present earlier → confirming the reversal structure
Expecting a bearish reaction from this imbalance zone
📉 EUR/USD Short Setup – June 27
🔹 Entry: 1.17380
🔹 SL: 1.17510
🔹 TP1: 1.17080 | TP2: 1.16800
🔻 PO3 bearish reaction from FVG at Premium zone + prior liquidity sweep
pls let me know your opinion am open to let from anyone and everyone, pls

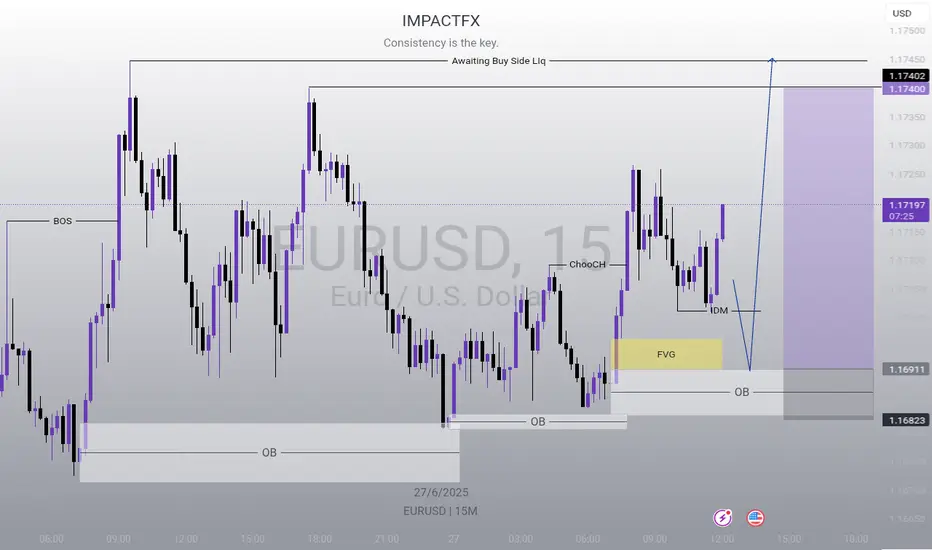
EUR/USD - Potential Long Continuation.Most of the OB are being respected in the 15 minute time frame.
Now price is retracing to the downside after touching the bearish POI (15m) and I am anticipationg that price will retrace back to the bullish OB (15m) and start pushing higher during NY Session.
I believe the latest OB created should be a high probability OB as it has swept Asian Low and start displacing further , showing sign of bullish momentum.

EURUSD – Waiting for Deeper Liquidity Sweep into Extreme POIExpecting EURUSD to sweep liquidity below 1.1660 and drop into the Extreme POI (~1.1600–1.1640). Watching for lower timeframe reversal signals to go long. Targeting 1.1732 initially, extended target near 1.1790. Invalidation below 1.1580.

EURUSD : Not yetSeems like it is very tempted to SELL now.
I do not think today is the day.
Maybe next Monday.

EURUSD Technical Breakdown | Bearish Reversal Ahead?The Euro is showing signs of a potential major trend reversal after completing a strong rally within an ascending channel.
🔎 Chart Analysis:
Price surged out of a long consolidation range and followed a parabolic curve.
The pair reached the upper boundary of the ascending channel and started stalling.
Early signs of a distribution phase are visible, hinting at possible downside momentum.
📉 Bearish Scenario In Play:
A break below 1.1600 could accelerate the sell-off.
Key support zone at 1.14526 — potential first reaction level.
If momentum continues, next major support rests at 1.12329.
Short-Term Outlook:
Watch for breakdown confirmation below the channel.
Risk management is key; consider short entries on bearish candle confirmation.
💬 What’s your view? Are the bears finally taking over EUR/USD? Drop your thoughts below! 👇
#EURUSD #Forex #TechnicalAnalysis #PriceAction

EURUSD Buy SetupI'm expecting a buy from that zone, all other zones are mitigated except from that zone marked on my chart to move price to the buy side LIq.
EURUSD short to 1.56Currently testing 1M resistance area and 1D downtrend line.
Expecting retracement to 1D up trendline.
DXY is also testing 1W uptrend line

EUR/USD Short Idea Analysis EUR/USD exhibits bearish potential on the daily timeframe, with the 1.17160–1.18070 zone acting as a key resistance area for a short setup.
Technical Analysis:
Price Action: Price is testing the 1.17160–1.18070 resistance zone, which aligns with prior highs and a rejection area. A bearish reversal pattern (e.g., shooting star or engulfing) could confirm the short.
Support/Target: Initial support at 1.1600, with a deeper target at 1.1500 if selling pressure accelerates.
Indicators: RSI is nearing overbought levels (above 65), suggesting a potential reversal. MACD shows weakening bullish momentum, supporting a bearish bias.
Fibonacci: The 1.17160–1.18070 zone aligns with the 78.6% Fibonacci retracement of the prior downmove, reinforcing resistance.
Risks: A break above 1.1820 could invalidate the setup. Watch for ECB policy updates or unexpected US data shifts.
Conclusion: The 1.17160–1.18070 resistance zone offers a compelling short opportunity for EUR/USD, backed by technical and fundamental factors. Use tight risk management due to potential volatility.


Profit TakingYesterday, EURUSD continued its bullish move and reached 1,1747.
Currently, we focus more on reducing risk and taking profits rather than entering new positions.
We’re approaching the final days of the quarter, and next week brings key economic events.
New entries will be considered only if a favorable risk-reward setup presents itself.
The next resistance remains at 1,1778!

EUR/USD BEARS WILL DOMINATE THE MARKET|SHORT
EUR/USD SIGNAL
Trade Direction: short
Entry Level: 1.161
Target Level: 1.141
Stop Loss: 1.174
RISK PROFILE
Risk level: medium
Suggested risk: 1%
Timeframe: 10h
Disclosure: I am part of Trade Nation's Influencer program and receive a monthly fee for using their TradingView charts in my analysis.
✅LIKE AND COMMENT MY IDEAS✅

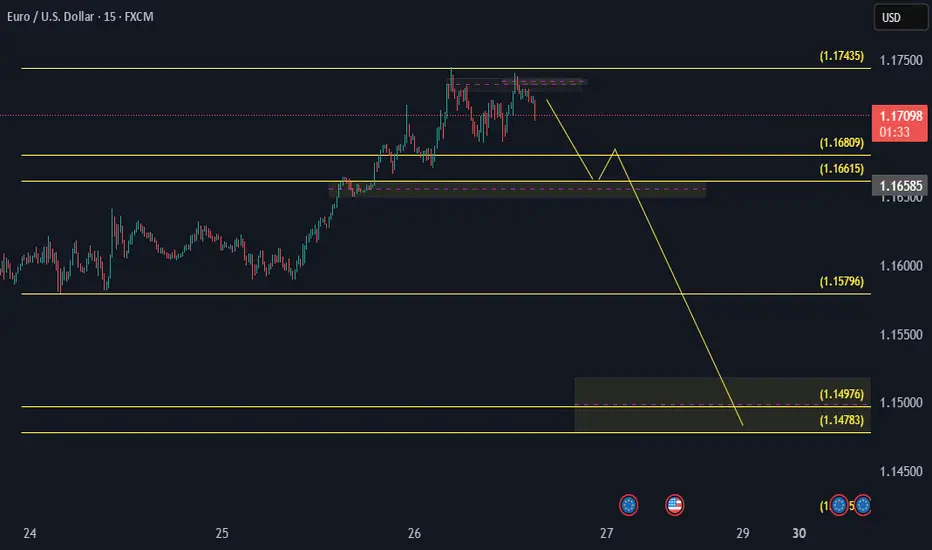
BSL (Buy-side Liquidity):Symbol: EUR/USD
Timeframe: 1 hour
Price Range Displayed: ~1.15300 to ~1.17500
Current Price: 1.16935
🔍
Key Chart Markings
BSL (Buy-side Liquidity):
Marked at the top in the yellow zone (~1.17250–1.17500).
Indicates where buy-side liquidity was likely taken—suggesting liquidity grab or stop hunt.
SSL (Sell-side Liquidity):
Marked at the bottom yellow zone (~1.15700–1.15900).
Indicates a potential drawdown area—price may seek this liquidity next.
Price Action:
The price recently made a higher high into the BSL zone, followed by a bearish rejection.
A projected path is shown: short-term retracement upward, followed by a larger move downward toward the SSL zone.
📉
Potential Outlook (Bearish Bias)
The chart suggests a bearish move is anticipated:
BSL has been swept, signaling a reversal point.
Target: Sell-side liquidity around 1.15800, possibly lower.
⚙️
Technical Implication
This setup follows Smart Money Concepts (SMC) or Liquidity Engineering:
Liquidity is taken from one side of the market (BSL), and price is expected to move to the other (SSL).
Possible setup for a short trade after confirmation of the retracement.

EURUSD: Pullback From Resistance Confirmed📉 The EURUSD could retreat from the highlighted resistance today.
I've identified a cup and handle pattern following a test of significant intraday resistance and a breach of its neckline, accompanied by strong bearish momentum.
Target - 1.1575.

EURUSD @ MAJOR SUPPLY ZONE, IS IT TIME FOR SELLERS TO TAKE OVERIn this 15m chart we have MAJOR SUPPLY AREA around 1.1723
SMALL TIME FRAME we can see heavily been REJECTED @ this SUPPLY AREA & now we kinda form DOUBLE TOP FORMATION (keep in mind DOUBLE TOP not Valid till we BREAK NECK around 1.169)
My plan to take this in once we BREAK DOUBLE TOP NECK LINE AND RETESTED, OR EVEN BETTER GO IN AFTER UP WARD TREND BROKEN
Still i have my eye on 1.113 but as usual will close some along the way
I will update once im in
Thanks

EURUSD SHORT TIME O LOSS TIMEI opened a long position on the EURUSD pair at 1.17195 with 10 lots.
Target: 1.174 – If the target is reached, I will take profit and open a short position.
At the same time, expecting USD weakness, I also opened a short position at 1.17200 with 20 lots.
1.168 to 1.166 is a strong support zone.
If price reaches 1.174 and I have an active short, I will close the 1.17200 short and keep the other one.
Targets and support levels are marked on the chart – I plan to close the positions gradually.
I will close 75% of the position at the 1.149 support level.
This is a demo account – I’m practicing in order to qualify for a funded trading account.
Depending on my success rate, I plan to start trading live on Forex.