EURUSD Sell SetupBy: MJTrading:
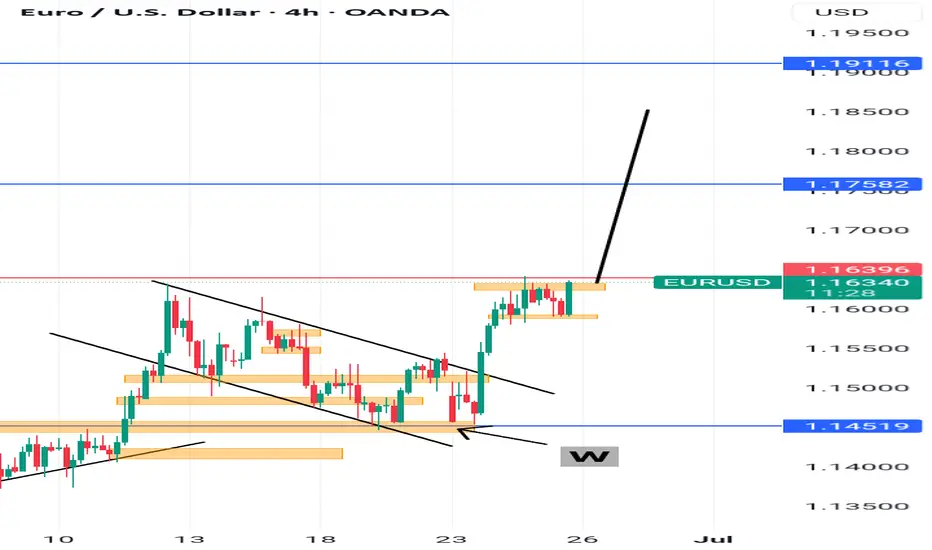
EUR/USD has rallied into a significant resistance zone, approaching the upper boundary of a rising wedge/channel pattern. The price is now hovering around a key confluence zone, where trendline resistance and horizontal supply intersect ( 1.16300 —1.16500 )
There are to possible scenarios:
1) If the price Rejects directly from previous High
🔹 Position 1: Sell Stop @ 1.15915
🛑 Stop Loss: 1.6375
🎯 Take Profit: 1.5454
R/R:1
isk Level: Medium
2) If price tries to reach the boundary of the wedge or make a Fake breakout:
🔹🔹 Position 2: Sell Limit @ 1.16300
🛑 Stop Loss: 1.6930
🎯 Take Profit: 1.5000
R/R:2
Risk Level: Low
📌 This zone offers a high-probability reversal setup
📉 Why it Matters:
Price action shows signs of exhaustion after a parabolic move.
EMA structure is stretched, hinting at a potential pullback.
Lets ZOOM OUT:
Daily Chart:
ZOOM IN:
Stay disciplined, let price come to you, and manage risk.
—
#EURUSD #ForexSetup #TradingStrategy #TechnicalAnalysis #ChartPattern #FXTrading #ShortTrade #MJTrading #BearishReversal #PriceAction #SwingTrade #ForexIdeas #Trendlines #BreakoutOrFakeout #RiskReward
EURUSDTDTM trade ideas

Euro's Surge on USD Weakness – Is 1.20 the Next Stop?EURUSD: Euro's Surge on USD Weakness – Is 1.20 the Next Stop?
Hello TradingView Community!
The EURUSD pair is currently commanding significant attention with its strong upward momentum.
🌍 Fundamental Highlights: Euro's Tailwinds & USD's Headwinds
The Euro has demonstrated notable strength, recently breaching the 1.17 mark to hit its highest level in over 3.5 years. According to ING, if this momentum holds, the next target could be 1.20, contingent on continued USD weakness.
The US Dollar faces considerable pressure following news that President Trump intends to name a successor to Fed Chair Powell soon, sparking concerns about the Fed's independence. Such speculation often leads to expectations of a more 'dovish' monetary policy, weakening the USD.
Adding to the Euro's support are the NATO agreement to increase defense spending targets to 5% and President Trump's seemingly "less aggressive" stance towards the EU.
In summary: Should USD depreciation persist, not only the Euro but other asset classes might also attract capital inflows, particularly given the ongoing uncertainties surrounding inflation risks and monetary policy.
📊 EURUSD Technical Outlook (H4/M30 Chart):
Our technical analysis of the EURUSD chart (image_b73298.png) confirms a clear and robust uptrend, characterized by successive higher highs and higher lows. The EMAs are in a bullish alignment, reinforcing this upward trajectory.
Upside Targets (Potential BUY Zones):
1.17807: The initial potential target if the bullish momentum continues.
1.18458: A higher target representing the next potential resistance zone.
Key Support Levels (Potential BUY Zones for pullbacks):
1.16070: A strong support level where demand could emerge after a correction.
An implied intermediate support around 1.166xx (visually suggested by price action between current levels and 1.16070) could also offer buying opportunities after minor pullbacks.
🎯 EURUSD Trading Plan:
BUY Zone 1 (Intermediate Pullback):
Entry: 1.16600 - 1.16700
SL: 1.16450
TP: 1.16800 - 1.17000 - 1.17200 - 1.17500 - 1.17807 - 1.18000 - 1.18300 - 1.18458
BUY Zone 2 (Strong Support):
Entry: 1.16070
SL: 1.15900
TP: 1.16200 - 1.16400 - 1.16600 - 1.16800 - 1.17000 - 1.17300 - 1.17600 - 1.17807 - 1.18458
SELL Zone (Consider only at upside targets with clear reversal signals):
Entry: 1.18458 (This is an upside target, but also a potential resistance for selling if strong reversal signals appear).
SL: 1.18600
TP: 1.18300 - 1.18000 - 1.17807 - 1.17500 - 1.17200 - 1.17000 - 1.16800
⚠️ Key Factors to Monitor:
Fed Leadership News: Any official announcements regarding the Fed Chair succession will trigger significant USD volatility.
Eurozone Economic Data: Upcoming inflation, GDP, and employment reports.
ECB Statements: The European Central Bank's stance on monetary policy.
Geopolitical Developments: Major tensions or agreements can influence market sentiment.
Trade smart and always manage your risk effectively! Wishing everyone a profitable trading day!

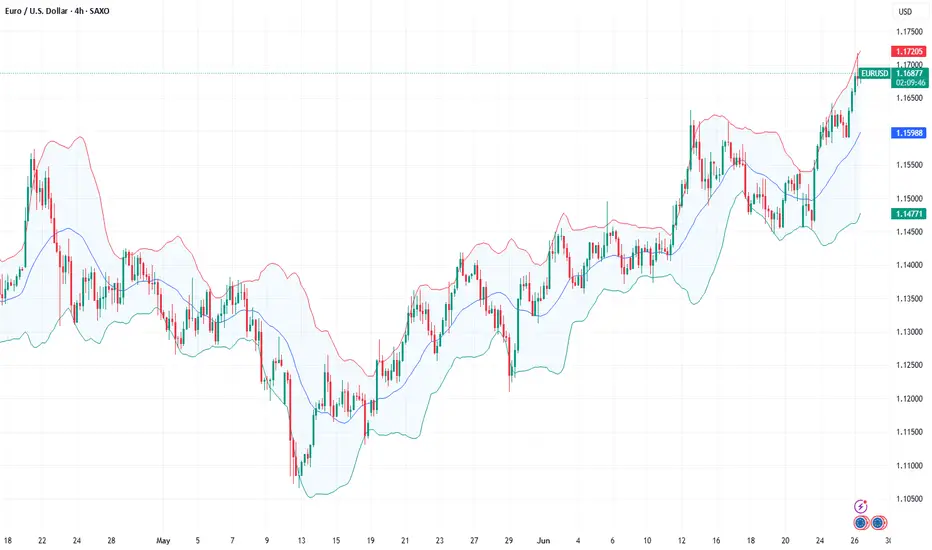
Overextended Rally into Resistance ZoneEUR/USD has pushed into the upper boundary of the Keltner Channel on the 4H timeframe, indicating a potential exhaustion of bullish momentum. Price is showing signs of overextension with Heikin Ashi candles losing strength near a key resistance zone.
📉 Short Position Setup:
Entry: 1.17220 (near upper Keltner resistance)
SL: 1.17581 (above recent highs and volatility buffer)
TP: 1.15220 (targeting mid-channel and previous structure support)
🔻 Bearish Confluence:
Price rejecting upper Keltner band
Potential for mean reversion after strong rally
Weakening bullish momentum in candle structure
Confirmation with further bearish price action or divergence signals would strengthen the case for downside continuation.

EURUSD Jun 26 The information and publications are not meant to be, and do not constitute, financial, investment, trading, or other types of advice or recommendations.
Have a nice day ahead.

I'm selling EURUSD, TOP is in!EURUSD is bearish now. Yes the trend is bullish, I know but I'm entering base on 15 mins BOS.
If you can gamble, this is a beautiful trade. When we see confirmation on a 4hrs timeframe, we enter more

Eurusd 4hr Chart Analaysis EUR/USD is entering a mild bearish correction or pullback phase, which may continue until it reaches the key support levels around 1.14272 – 1.13693. From this zone, there is a strong possibility that the pair could resume its bullish trend. Good luck!

SELL EURUSDIn todays session we are actively monitoring EURUSD for selling opportunity. Our entry is at the current high price of 1.16600 our target is below 1.15800 and stops above 1.16900 (to be adjusted accordingly). Use proper risk management and cheers to you all.


Fundamental Market Analysis for June 26, 2025 EURUSDThe EUR/USD pair continues to rise to 1.16800 during Thursday's Asian session. The US dollar (USD) is weakening against the euro (EUR) as investors worry about the future independence of the US Federal Reserve (Fed). Final data on US GDP growth for the first quarter will be in focus later on Thursday.
US President Donald Trump said on Wednesday that he is considering three or four potential candidates to replace Fed Chairman Jerome Powell. According to the Wall Street Journal, Trump may consider former Fed Governor Kevin Warsh, National Economic Council Director Kevin Hassett, and Treasury Secretary Scott Bessent. Other candidates include former World Bank President David Malpass and Fed Governor Christopher Waller.
This raises questions about a potential weakening of the Fed's independence and a possible decline in its authority, which undermines the dollar and creates favorable conditions for the major currency pair.
Across the Atlantic, European Central Bank (ECB) policymakers are concerned about the economic outlook due to Trump's tariff policy and geopolitical risks. Earlier this week, ECB policymaker François Villeroy de Galhau said that despite current conditions, further rate cuts are still possible. Statements by ECB policymakers may put pressure on the single currency in the near term.
Trading recommendation: BUY 1.16750, SL 1.16300, TP 1.17500
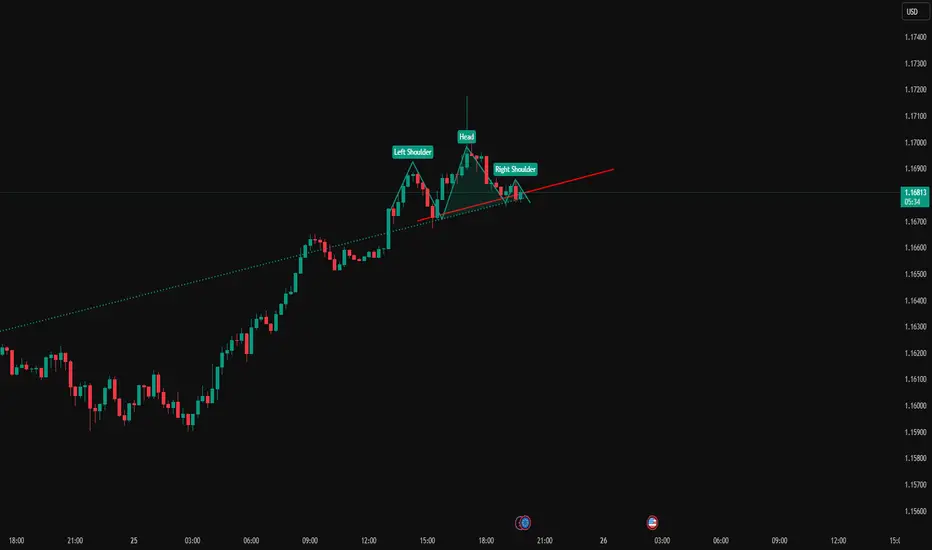
EURUSD Head And ShouldersEURUSD has created a normal head and shoulders pattern while reaching a HTF resistance on the weekly/daily. I expect this pattern to be a catalyst to a bearish movement.
EUR/USD 30-MIN ANALYSISThis EURUSD setup showcases a clean bullish continuation scenario following a confirmed Break of Structure (BOS) and a sharp rally driven by momentum and liquidity imbalance.
After sweeping a key low (XXX), price impulsively broke structure to the upside, confirming a potential shift in market intent. A retracement is now expected to mitigate the Buy-Side Imbalance (BISI) zone.
BOS & SSS (Short-Term Structural Shift): Confirmed bullish intent.
Imbalance (BISI): Price left behind an unfilled imbalance zone a likely magnet for a pullback.
Re-Entry Zone: (BISI) provides a high probability area for long re-entry.
Upside Targets:
Target 1: 1.15483 – intermediate structural level.
Target 2: 1.16158 – premium supply / liquidity target.
#EURUSD 30M Technical Analysis Expected Move.

Target achievedThe impulsive rise in EURUSD continues.
This morning, it reached 1,1717 — our first projected target.
This is a good level to take profits.
Now, watch for a pullback and the potential for another move up.
Most of the move should already be captured by this point.
Reduce your risk and avoid using large position sizes.
If the price moves higher again, the next target is 1,1778!
EUR_USD BULLISH BREAKOUT|LONG|
✅EUR_USD is going up
Now and the pair made a bullish
Breakout of the key horizontal
Level of 1.1630 and the breakout
Is confirmed so we are bullish
Biased and we will be expecting
A further bullish move up
LONG🚀
✅Like and subscribe to never miss a new idea!✅
Disclosure: I am part of Trade Nation's Influencer program and receive a monthly fee for using their TradingView charts in my analysis.

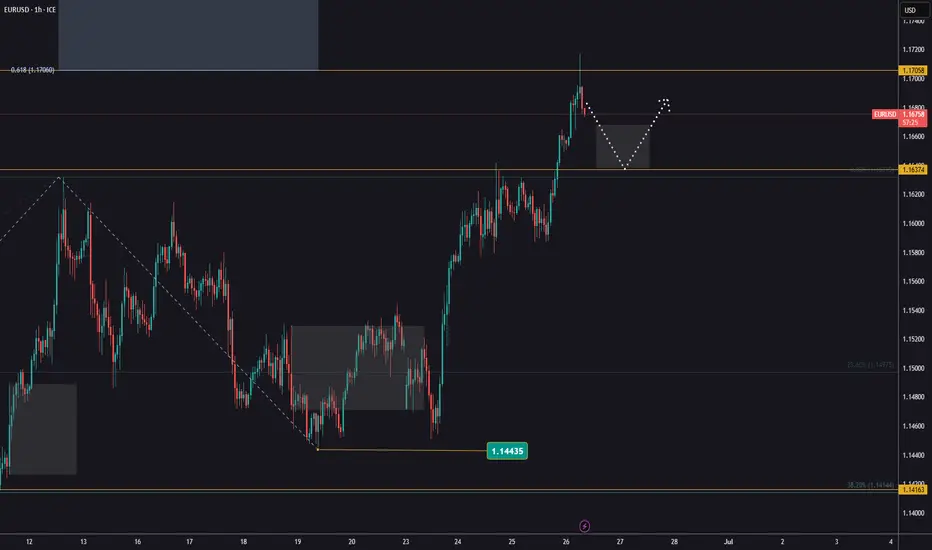
EUR/USD Ready to Explode or Collapse? All Eyes on June 26 🔺 Gann Trend Analysis
The red upward sloping line is a long-term Gann trendline connecting major swing lows since late May.
According to Gann principles, trendlines from major pivots are often tested again before a major reversal.
The annotation “a trend should be tested again” aligns with the Gann philosophy: after price rallies away, it often returns to test the base trendline.
The cluster of vertical blue time cycle lines (June 26) implies an important Gann time window, potentially a reversal point.
📐 Channel & Price Structure
A small ascending wedge/channel is drawn in red, signaling rising but weakening momentum.
Price is now approaching key resistance zones marked in yellow and green (1.1640, 1.1650, 1.1660, 1.1683).
These resistance zones suggest potential exhaustion, making the upper boundary of the channel a sell zone.
🔻 Bearish Scenario & Projections
Blue arrows indicate the expected bearish path after hitting resistance.
The reversal target is the Gann trendline retest zone around 1.1500–1.1520.
A break below this Gann trendline could trigger deeper drops in alignment with time-based cycles.
⚠️ Conclusion
This setup implies:
Bearish divergence between price action and time cycles.
Resistance clusters = likely reversal point.
Retest of the long-term Gann trendline is highly probable.

EURUSD | 24.06.2025SELL 1.16100 | STOP 1.16600 | TAKE 1.15400 | Double top pattern (H4) and strong resistance range. The price is expected to decline and consolidate below the level of 1.16100.

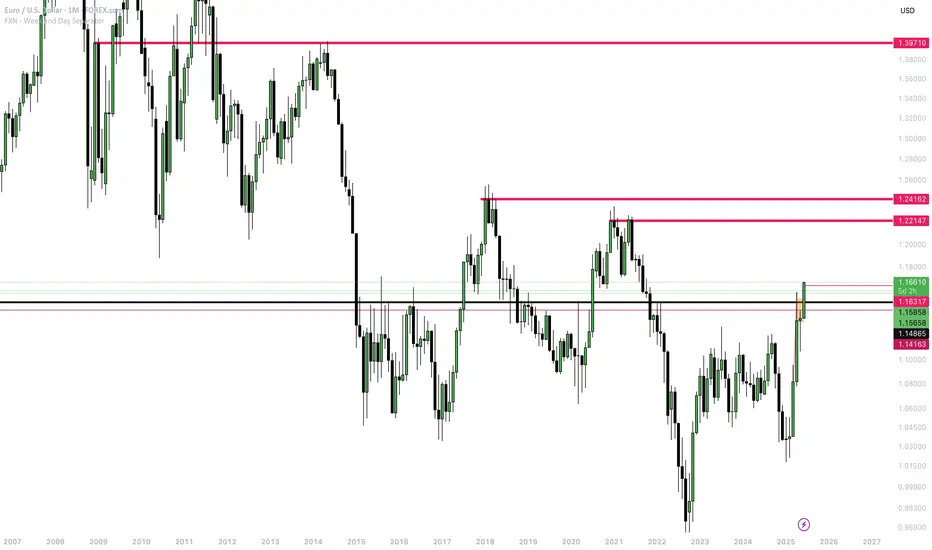
EURUSD For A Long BuyThe EURUSD broke out to the previous resistance level of 1.16317
The next resistance level is 1.22147. weaknesses and instability in the US Economy and its involvement in the Iran-Israeli war, which has resulted in uncertainty (geopolitical risk) among investors.
A Bullish flag pattern on the Daily Timeframe confirmed the break from the previous support, and fueled by the statement above, the Bullish flag pattern will continue to the resistance level 1.22147.
The 1.24162 level could serve as a resistance level if 1.22147 were to turn into support.
The highest level, 1.39710, is a level to watch out for, in the long term, if buying continues.
Conclusion: Current objective is a Buy to 1.22147.
EUR/USD 3-Year Highs Nears Fibo ResistanceThe Fibonacci retracement drawn from the 2021-2022 move in EUR/USD has continued to produce inflections in the pair. It caught the high in 2023 at the 61.8% retracement of 1.1275. And then last year, it set the low in April that led into a vigorous bounce into the end of Q3. Along the way, the 50% marker of that major move was a sticking point producing multiple inflections on both sides of the pair.
And then as EUR/USD came into 2025 sliding lower, it was the 23.6% retracement that came into play to catch the lows at the 1.0200 handle in January. In February, bulls held a higher-low just above that price and by March, prices were ready to jump-higher.
More recently it was the 61.8% retracement at 1.1275 that was back in the picture and with EUR/USD breaking out now to fresh three-year-highs, the look goes up to the next level in the Fibonacci sequence at 1.1686, which is the 76.4% retracement from that same major move.
Notably, EUR/USD is back into overbought territory on weekly RSI and there's also a rising wedge here, often approached with aim of bearish reversal. All that said, bulls are still making the push but if we do see a USD turn stage around quarter-end or the start of Q3, I think EUR/USD remains one of the more attractive venues to seek that out. Meanwhile, both GBP/USD and USD/CAD remain of attraction for USD-weakness to continue. - js

EURUSD 15M READY FOR CRASH TO 1.113???At the moment the price action show BEARISH SIGN (MAKING HH/HL) and trade below SUPPORT turn RESISTANCE @ around 1.1542
Market open with the GAP DOWN today, which as you can see we already fill it
One can go in @ the GAP (AGGRESIVE ENTRY)
Or wait till 1.4874 SUPPORT taken away (MUCH SAFER ENTRY)
All and all im very BEARISH WITH EURUSD THIS WEEK
All the best trader

Eurusd Fall ContinuesThe EURUSD extended its recent uptrend yesterday, briefly pushing to the highest level since October 2021, but the move stalled just above 1.16297, the June high and the high for the year. Today’s price action again approached that high but was unable to break above, turning the market lower and back toward a familiar swing area that has defined recent resistance.

EURUSD LAST LIQUIDITY GRAB BEFORE WE CRUSH :))Take 15m SELL as seen on the chart, with help of DIVENGANCE @ LIQUIDITY AREA give me more reason to take this SELL
I can see all the way to 1.113 but we will take profit along the way till final destination
Monday was horrible but Tuesday can be our start of the week :)
Thats trading for you :))

Bullish moveEurusd had a consolidation phase or a bullish flag and there is already a breakout to the upside.
You can be aggressive and enter or wait for a retest and then enter
Perfect Elliot Wave Count on EURUSD and repeating pattern..I found a potential drop on EURUSD based on Elliot Wave Count, as the consolidation move should be end soon or later, and downward continuation will follow.
SEE THE REPEATING PATTERN AS A SIGNAL OF REVERSAL..
SELL EURUSD!

EUR/USD at resistanceAs you can see this trend line on the weekly goes back quite a ways, it was supported by and now has become resistance. Unless it closes above on the weekly timeframe, this area is a good short zone
