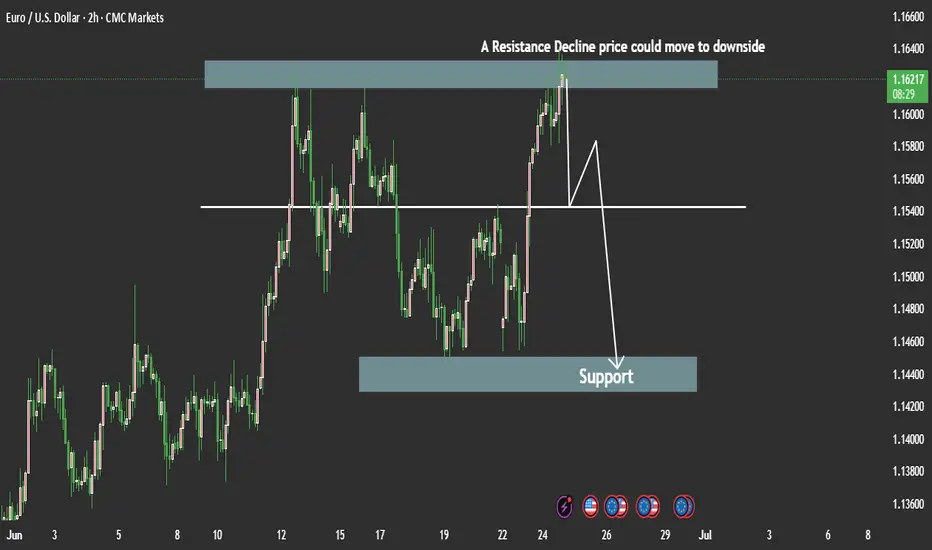
EURUSD | 24.06.2025SELL 1.16100 | STOP 1.16600 | TAKE 1.15400 | Double top pattern (H4) and strong resistance range. The price is expected to decline and consolidate below the level of 1.16100.
EURUSDTDTM trade ideas

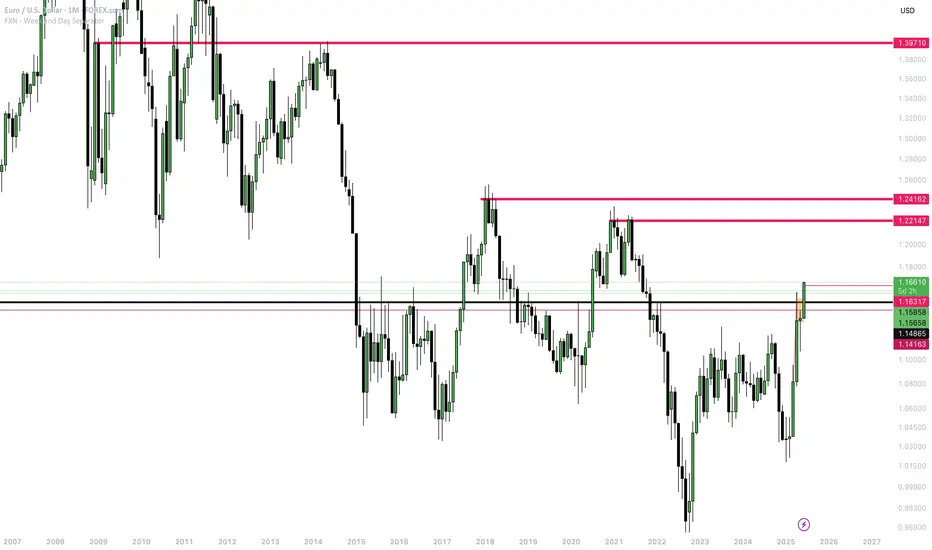
EURUSD For A Long BuyThe EURUSD broke out to the previous resistance level of 1.16317
The next resistance level is 1.22147. weaknesses and instability in the US Economy and its involvement in the Iran-Israeli war, which has resulted in uncertainty (geopolitical risk) among investors.
A Bullish flag pattern on the Daily Timeframe confirmed the break from the previous support, and fueled by the statement above, the Bullish flag pattern will continue to the resistance level 1.22147.
The 1.24162 level could serve as a resistance level if 1.22147 were to turn into support.
The highest level, 1.39710, is a level to watch out for, in the long term, if buying continues.
Conclusion: Current objective is a Buy to 1.22147.
EUR/USD 3-Year Highs Nears Fibo ResistanceThe Fibonacci retracement drawn from the 2021-2022 move in EUR/USD has continued to produce inflections in the pair. It caught the high in 2023 at the 61.8% retracement of 1.1275. And then last year, it set the low in April that led into a vigorous bounce into the end of Q3. Along the way, the 50% marker of that major move was a sticking point producing multiple inflections on both sides of the pair.
And then as EUR/USD came into 2025 sliding lower, it was the 23.6% retracement that came into play to catch the lows at the 1.0200 handle in January. In February, bulls held a higher-low just above that price and by March, prices were ready to jump-higher.
More recently it was the 61.8% retracement at 1.1275 that was back in the picture and with EUR/USD breaking out now to fresh three-year-highs, the look goes up to the next level in the Fibonacci sequence at 1.1686, which is the 76.4% retracement from that same major move.
Notably, EUR/USD is back into overbought territory on weekly RSI and there's also a rising wedge here, often approached with aim of bearish reversal. All that said, bulls are still making the push but if we do see a USD turn stage around quarter-end or the start of Q3, I think EUR/USD remains one of the more attractive venues to seek that out. Meanwhile, both GBP/USD and USD/CAD remain of attraction for USD-weakness to continue. - js

Eurusd Fall ContinuesThe EURUSD extended its recent uptrend yesterday, briefly pushing to the highest level since October 2021, but the move stalled just above 1.16297, the June high and the high for the year. Today’s price action again approached that high but was unable to break above, turning the market lower and back toward a familiar swing area that has defined recent resistance.

EURUSD LAST LIQUIDITY GRAB BEFORE WE CRUSH :))Take 15m SELL as seen on the chart, with help of DIVENGANCE @ LIQUIDITY AREA give me more reason to take this SELL
I can see all the way to 1.113 but we will take profit along the way till final destination
Monday was horrible but Tuesday can be our start of the week :)
Thats trading for you :))

Bullish moveEurusd had a consolidation phase or a bullish flag and there is already a breakout to the upside.
You can be aggressive and enter or wait for a retest and then enter
Perfect Elliot Wave Count on EURUSD and repeating pattern..I found a potential drop on EURUSD based on Elliot Wave Count, as the consolidation move should be end soon or later, and downward continuation will follow.
SEE THE REPEATING PATTERN AS A SIGNAL OF REVERSAL..
SELL EURUSD!

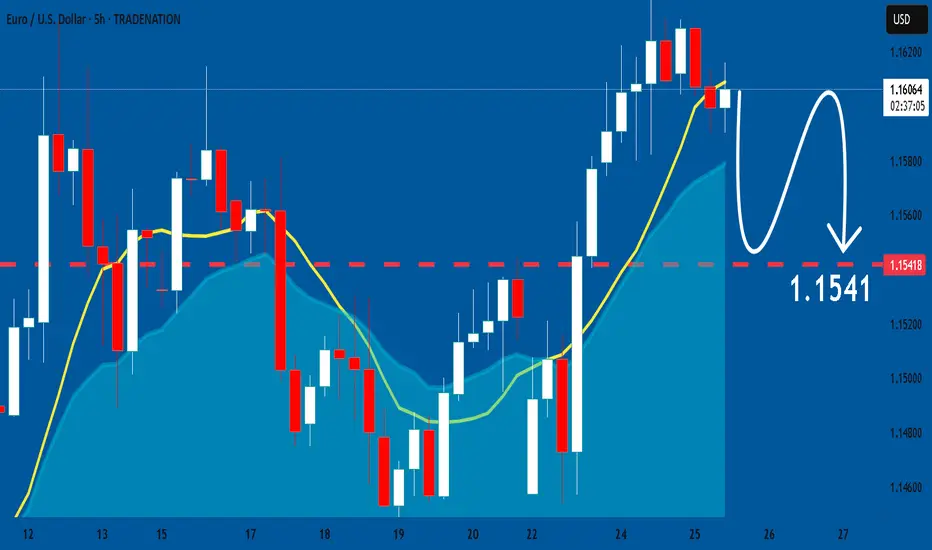
EURUSD: Expecting Bearish Continuation! Here is Why:
The recent price action on the EURUSD pair was keeping me on the fence, however, my bias is slowly but surely changing into the bearish one and I think we will see the price go down.
Disclosure: I am part of Trade Nation's Influencer program and receive a monthly fee for using their TradingView charts in my analysis.
❤️ Please, support our work with like & comment! ❤️
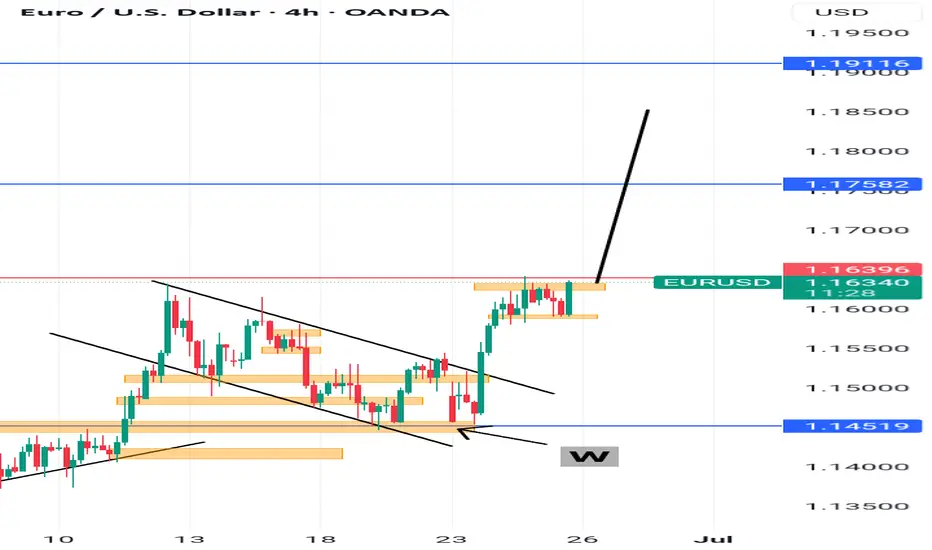
EURUSD – Breakout Confirmed, Now Watching for Retest or 4hr ClosEURUSD has officially broken above the key 1.16020 resistance level on the 4hr chart, but price action has since gone stagnant. No strong bullish momentum has followed the break so far — a sign we may be due for a deeper pullback.
I remain bullish overall, but I'm watching for two potential scenarios:
✅ Safe Buy: Clean 4hr bullish close above 1.16020
🎯 HRHR Buy: Pullback to the former level of interest at 1.14149 if structure holds
Until one of those triggers, I’ll be patient. Let the setup come to you. Overall target remains the 1.18791 zone before reassessing.

EUR/USD Ready to Explode or Collapse? All Eyes on June 26 🔺 Gann Trend Analysis
The red upward sloping line is a long-term Gann trendline connecting major swing lows since late May.
According to Gann principles, trendlines from major pivots are often tested again before a major reversal.
The annotation “a trend should be tested again” aligns with the Gann philosophy: after price rallies away, it often returns to test the base trendline.
The cluster of vertical blue time cycle lines (June 26) implies an important Gann time window, potentially a reversal point.
📐 Channel & Price Structure
A small ascending wedge/channel is drawn in red, signaling rising but weakening momentum.
Price is now approaching key resistance zones marked in yellow and green (1.1640, 1.1650, 1.1660, 1.1683).
These resistance zones suggest potential exhaustion, making the upper boundary of the channel a sell zone.
🔻 Bearish Scenario & Projections
Blue arrows indicate the expected bearish path after hitting resistance.
The reversal target is the Gann trendline retest zone around 1.1500–1.1520.
A break below this Gann trendline could trigger deeper drops in alignment with time-based cycles.
⚠️ Conclusion
This setup implies:
Bearish divergence between price action and time cycles.
Resistance clusters = likely reversal point.
Retest of the long-term Gann trendline is highly probable.

EURUSD Technical Outlook Bearish TrendEURUSD Technical Outlook – 4H Timeframe
EURUSD has been pushing higher over the past few sessions, reaching a key liquidity zone. On the 4-hour chart, we’ve observed a clean sweep of previous highs, indicating a potential liquidity grab.
From this zone, there's a high probability of a downside move, especially if the price fails to sustain above this level. Any bounce from this zone that lacks momentum may signal bullish exhaustion, opening the door for sellers to step in.
Resistance zone 1.16500
Support zone 1.14500
You may find more details in the chart Ps Support with like and comments for more analysis Thanks.
Can it Reach New Highs as USD Weakens?EUR/USD: Euro's Resilience Holds Strong – Can it Reach New Highs as USD Weakens?
🌍 Macro Landscape: EUR/USD Rides Risk-On Sentiment and Fed Cut Hopes
The Euro (EUR) is showing significant strength, maintaining its position near a three-year high against the US Dollar (USD). This resilience is largely fueled by a moderately positive risk appetite in the market.
Simultaneously, the US Dollar is facing considerable downward pressure. This weakness stems from recent weaker-than-expected economic data from the United States and increasing market expectations for the Federal Reserve (Fed) to implement interest rate cuts. If US economic indicators continue to soften, it could solidify the case for earlier Fed rate cuts, further undermining the USD and potentially boosting EUR/USD.
🏦 Central Bank Policy: Diverging Paths for ECB and Fed
Federal Reserve (Fed): The market is increasingly pricing in the likelihood of Fed interest rate cuts. Weaker US data strengthens this narrative, as the Fed might be compelled to ease monetary policy to support economic growth. This dovish outlook for the Fed is a key driver of USD weakness.
European Central Bank (ECB): While the provided information focuses on the EUR's strength due to broader market sentiment and USD weakness, the ECB's more measured approach to monetary policy compared to the Fed's potential easing can create a favorable interest rate differential for the Euro, attracting capital flows.
This divergence in central bank policy expectations—with the Fed leaning towards cuts and the ECB maintaining a more cautious stance—creates a tailwind for the EUR/USD pair.
🌐 Capital Flows: Money Favors Euro Amidst USD Softness
Global capital flow models suggest that funds are increasingly moving towards assets perceived as offering better relative value or stability. As US yields become less attractive due to anticipated Fed rate cuts, capital may flow out of USD-denominated assets.
This outflow from the USD naturally benefits currencies like the Euro, especially given its current positive momentum driven by a moderate risk-on environment. The re-pricing of Fed policy risk directly influences these capital movements, contributing to the upward trajectory of EUR/USD.
📊 Technical Structure (H4 Chart Analysis): EUR/USD Eyes Key Resistance Levels
Based on the provided EUR/USD H4 chart:
Uptrend intact: The pair continues to exhibit a positive trend, characterized by higher lows and higher highs within an ascending channel.
Key Resistance Levels:
Initial Resistance: 1.16330. This level aligns with recent highs and the top of the minor channel. A break above this suggests further bullish momentum.
Major Resistance Zone: 1.17031. This is indicated as a significant resistance area, potentially a long-term target or a reversal point. A break here would confirm strong bullish conviction.
Key Support Levels:
Immediate Support: 1.15470. This level has acted as a support point, aligning with the EMA 200 and a Fibonacci retracement level, indicating a potential bounce area.
Strong Support Zone: 1.15249. This zone represents a robust demand area, aligning with previous price action and serving as a crucial level for bulls to defend.
Moving Averages (EMA 13-34-89-200): The price is trading above the short-term and long-term EMAs, suggesting strong bullish momentum. The EMAs are fanning out and showing a bullish alignment, reinforcing the uptrend.
Projected Price Action: The chart suggests that the price might retrace towards the 1.15470 or 1.15249 support zones before resuming its upward trajectory towards the 1.16330 and potentially 1.17031 resistance levels.
🎯 Trade Strategy Recommendations:
Scenario 1 – BUY the Dip:
Entry: Look for bullish confirmation around 1.15470 - 1.15249.
Stop-Loss: Below 1.15100 (or a level below the 1.15249 support for risk management).
Take-Profit:
TP1: 1.15600
TP2: 1.15800
TP3: 1.16000
TP4: 1.16200
TP5: 1.16330 (Targeting the immediate resistance)
TP6: 1.16500
TP7: 1.16800
TP8: 1.17031 (Targeting the major resistance)
Scenario 2 – SELL the Rally (Counter-trend/Reversal):
Entry: Look for bearish confirmation around 1.16330 - 1.16400 or higher near 1.17031.
Stop-Loss: Above 1.16500 (or above 1.17100 if selling at higher resistance).
Take-Profit:
TP1: 1.16200
TP2: 1.16000
TP3: 1.15800
TP4: 1.15600
TP5: 1.15470 (Targeting the immediate support)
TP6: 1.15249 (Targeting the strong support zone)
⚠️ Key Events to Watch:
Upcoming US Economic Data: Any further weak data could solidify Fed rate cut expectations and weigh on the USD.
ECB Official Statements: Comments from ECB members on inflation or monetary policy could impact EUR's strength.
Global Risk Sentiment: A continued moderate risk-on environment will generally support the EUR against the USD.
Trade smart and stay informed! Wishing everyone a successful trading day!
EUR/USD 30-MIN ANALYSISThis EURUSD setup showcases a clean bullish continuation scenario following a confirmed Break of Structure (BOS) and a sharp rally driven by momentum and liquidity imbalance.
After sweeping a key low (XXX), price impulsively broke structure to the upside, confirming a potential shift in market intent. A retracement is now expected to mitigate the Buy-Side Imbalance (BISI) zone.
BOS & SSS (Short-Term Structural Shift): Confirmed bullish intent.
Imbalance (BISI): Price left behind an unfilled imbalance zone a likely magnet for a pullback.
Re-Entry Zone: (BISI) provides a high probability area for long re-entry.
Upside Targets:
Target 1: 1.15483 – intermediate structural level.
Target 2: 1.16158 – premium supply / liquidity target.
#EURUSD 30M Technical Analysis Expected Move.

EURUSD 15M READY FOR CRASH TO 1.113???At the moment the price action show BEARISH SIGN (MAKING HH/HL) and trade below SUPPORT turn RESISTANCE @ around 1.1542
Market open with the GAP DOWN today, which as you can see we already fill it
One can go in @ the GAP (AGGRESIVE ENTRY)
Or wait till 1.4874 SUPPORT taken away (MUCH SAFER ENTRY)
All and all im very BEARISH WITH EURUSD THIS WEEK
All the best trader

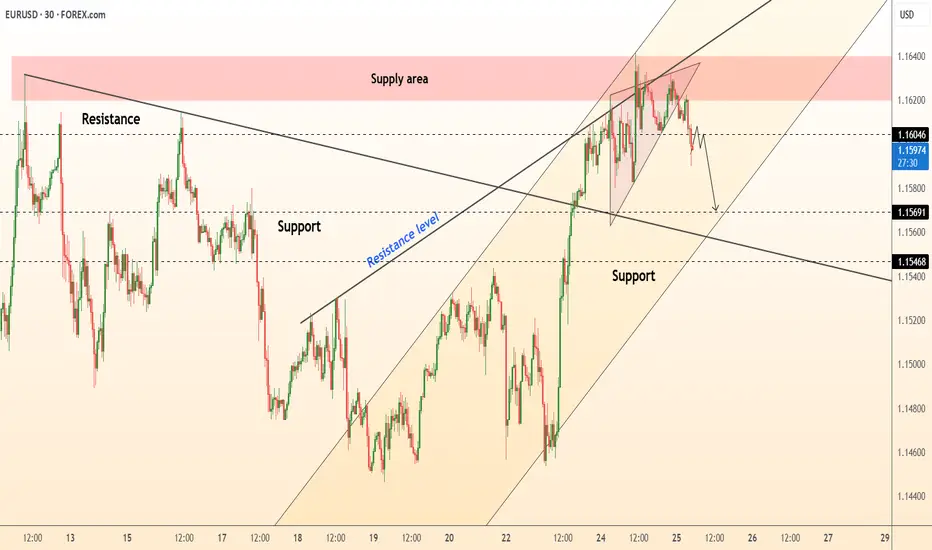
DeGRAM | EURUSD reached the supply area📊 Technical Analysis
● Price formed an intraday rising wedge right inside the 1.1615-1.1635 supply band; the wedge has broken lower and the last two candles closed back under the long-term trendline retest.
● Bearish follow-through is favoured while price stays below 1.1604; first magnet is the confluence of former breakout base and inner channel support at 1.1569, with 1.1547 (mid-June pivot) the next objective.
💡 Fundamental Analysis
● Fresh Euro-area PMIs dipped below consensus while U.S. consumer-confidence beat, widening the short-rate gap and reviving USD bids.
✨ Summary
Sell rallies ≤1.1600; targets 1.1569 → 1.1547. Bias invalid if 30-min candle closes above 1.1635.
-------------------
Share your opinion in the comments and support the idea with a like. Thanks for your support
EURUSD Approaching Liquidity Shelf — Watch for Reaction at 1.164EURUSD remains firmly bullish on all major timeframes, respecting the internal structure of an ascending channel.
• Daily: Price continues to respect both the red trendline and broader purple bullish channel. Buyers are defending the mid-line and pushing toward the upper boundary.
• 4H: Clear higher highs and higher lows. Price recently revisited and bounced off a 4H demand zone (1.14750–1.15000), and is now testing the liquidity zone at 1.16400.
• 1H: Microstructure shows consolidation and possible absorption of liquidity just beneath the 1.16415 high. A clean break and retest of this level may confirm continuation.
Key Levels:
• Resistance: 1.16415 (previous high and liquidity trap)
• Support: 1.14900 (4H demand zone)
• Daily trendline holding as dynamic support
Trade Plan:
• Longs: Await a break and retest of 1.16415 or a retracement to 1.15600 for a more discounted entry.
• Shorts: Not favored unless a strong bearish engulfing forms below 1.1600 with structure shift on the 1H.

EURUSD Short Part IIEURUSD Analysis
On EURUSD daily chart from CMC Markets quota, indicates a bullish trend with a symmetrical triangle pattern forming. The price has recently broken above a key resistance level, suggesting potential for continued upward movement.
Key Price Levels
Current Price: 1.16932
Stop Loss (SL): 1.16549
Take Profit 1 (TP1): 1.12003
Take Profit 2 (TP2): 1.09318
Trend Analysis
EURUSD shows clear signs on an ascending trend supported by higher lows and higher highs since early 2025. Both orange trend-lines which I created form a symmetrical triangle, with the price nearing the apex, hinting at a potential breakout or reversal which I have been looking for a reversal bearish breakout.
The upward momentum is strong, but the proximity to the upper trend-line and set take-profit levels indicates preparation for a possible correction. I still believe in shorts on EURUSD.
Conclusion
Traders and investors should monitor the price action near the triangle apex for breakout confirmation. The set stop loss and take-profit levels provide a structured approach to managing the trade, balancing potential gains with risk mitigation. Stay tuned for more updates on the trade.

EURUSD Sell Channel Strong Selling From Key Resistance 1.15200EURUSD Technical Update
Pair is respecting the descending channel and showing strong selling pressure from key resistance at 1.15200.
1H Time Frame Outlook
🔻 Target 1: 1.14700
🔻 Target 2: 1.14000
Momentum favors the bears as long as price remains below resistance.
💬 Drop your thoughts below,
📈 Like, follow, and join us for more real-time updates and insights!
— Livia 😜

Lingrid | EURUSD Pullback - Awaiting Trend Continuation SignalFX:EURUSD is consolidating above the upward trendline after forming a triangle within the broader ascending channel. The recent pullback tested the 1.1444 support zone, with a rebound hinting at renewed bullish pressure. A push beyond 1.1620 could unlock upside toward the 1.1700 resistance mark.
📈 Key Levels
Buy zone: 1.1444–1.1470
Sell trigger: breakdown below 1.1444
Target: 1.16200
Buy trigger: breakout above 1.1523 resistance
💡 Risks
Triangle breakdown could shift the short-term bias bearish
Failure to reclaim 1.1620 may stall bullish momentum
A sharp drop below the black trendline would invalidate the structure
If this idea resonates with you or you have your own opinion, traders, hit the comments. I’m excited to read your thoughts!

eurusd short and then long idea short idea price should come to support zone and retest then it can go high maybe . but for now its a good time to catch up the short

Smart Money Concepts (SMC) principles.Smart Money Concepts (SMC) principles. Here’s a full breakdown of the chart and its annotations:
📊
Chart Details:
Pair: EUR/USD
Timeframe: 4-hour (H4)
Current Price: Around 1.16093 USD
🔍
Key Annotations & Zones:
🟫
Pink Zone (Supply/Resistance Area):
This area includes:
Accumulation
FVG (Fair Value Gap)
Price has recently entered and reacted from this zone.
🔼
Buy Side Liquidity:
Highlighted at the top of the range.
Price swept above recent highs to trigger buy stops (liquidity grab), possibly setting up for a reversal.
🔽
Sell Side Liquidity:
Marked below the previous consolidation range.
Price had previously dipped to collect sell-side liquidity before moving upward.
📈
Accumulation:
This phase occurred before the bullish breakout.
Suggests institutional buying or smart money positioning.
📉
FVG (Fair Value Gap):
Imbalance between buying and selling, typically gets filled.
Marked in the pink zone where price may return before continuing its move.
📌
Price Structure Analysis:
The chart shows a classic liquidity sweep setup:
Price grabs buy-side liquidity.
Enters a supply zone.
May return to fill the FVG.
Potential reversal or bearish reaction from this zone.
✅
Trading Implications:
Bearish Scenario:
Price may reject from the pink supply zone after the buy-side liquidity sweep, filling the FVG and possibly heading toward previous lows.
Bullish Scenario (less likely immediately):
If price holds above the pink zone, it could continue trending upward.

Fed speak - Not broken, not cutting “Don’t fix what isn’t broken” seems to be the Fed’s current stance. Two Fed officials made that clear over the last 24 hours.
Vice Chair for Supervision Michael Barr warned that tariffs could fuel inflation by lifting short-term expectations, triggering second-round effects, and making inflation more persistent.
New York Fed President John Williams echoed that view, noting that tariff-driven inflation is “likely to get stronger in the months ahead.” He also called policy “well positioned” and said the Fed needs more data before making any move.
EUR/USD has formed a rising wedge pattern on the daily chart—typically a bearish structure that warns of a potential reversal. Price action has narrowed, building two clear tops. The downside target from the wedge could potentially be 1.1066 initially, and possibly down to 1.0732 if bearish momentum accelerates.

EURUSD Midweek Outlook | 3H - 15M Dual ViewLeft side chart shows the 3H Bird’s Eye structure — price swept the recent highs but failed to follow through, signaling external bull weakness. That shift in narrative tells me price may be prepping to drop, potentially targeting the SSL below before gathering fuel to attack major highs.
Right side zooms in on the 15M — I’m patiently watching for a clean lower high to break (CHoCH) followed by a pullback to confirm a sell entry. Until I get that proper LTF trigger, I stay on the sidelines. Execution always follows alignment.
Bias: Short
HTF Structure: 3H sweep of highs, showing weakness
LTF View: Waiting for 15M confirmation (break + retest)
Target: SSL below
Mindset Note: Trade what’s shown, not what’s felt. Stay sharp, stay patient.
Bless Trading!
