EURUSD: Can it reach 1.1900?EURUSD is bullish on its 1D technical outlook (RSI = 65.234, MACD = 0.006, ADX = 20.419) and is going for a 3 week high. This is technically a long term bullish wave (since the January 13th 2025 low) on the 3 year Channel Up. We anticipate that this wave will go for the pattern's high by the end of the year, and being limited by the 7 year LH trendline, we expect to aim for at least 1.1900. The 1W RSI has started to post a sequence that resembles the last 3 major ones.
## If you like our free content follow our profile to get more daily ideas. ##
## Comments and likes are greatly appreciated. ##
EURUSDTDTM trade ideas

EURUSD A Fall Expected! SELL!
My dear friends,
Please, find my technical outlook for EURUSD below:
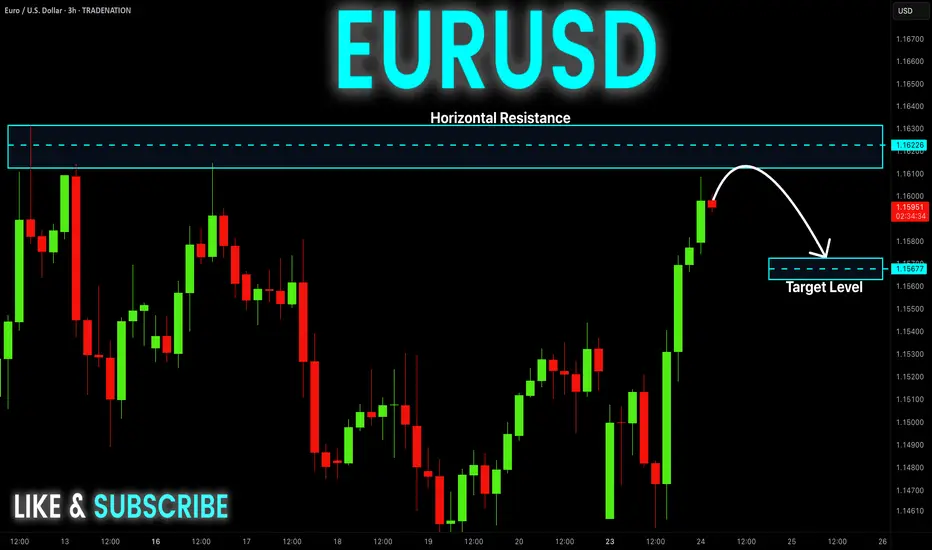
The price is coiling around a solid key level - 1.1609
Bias - Bearish
Technical Indicators: Pivot Points Low anticipates a potential price reversal.
Super trend shows a clear sell, giving a perfect indicators' convergence.
Goal - 1.1532
About Used Indicators:
The pivot point itself is simply the average of the high, low and closing prices from the previous trading day.
Disclosure: I am part of Trade Nation's Influencer program and receive a monthly fee for using their TradingView charts in my analysis.
———————————
WISH YOU ALL LUCK

EURUSD Sell/ShortFundamental Analysis
EURUSD rates is being influenced by the current Eurozone's economic performance, driven by key economies like Germany and France, continues to be shaped by industrial output, consumer confidence, and inflation trends. The European Central Bank (ECB) has likely maintained a cautious monetary policy, with interest rates possibly held steady or adjusted slightly to combat inflation while supporting growth. On the U.S. side, the Federal Reserve's stance on interest rates, potentially in a tightening phase to address persistent inflation plays a critical role. Recent U.S. economic data, including GDP growth, employment figures, and consumer spending, may indicate a robust dollar, putting downward pressure on EURUSD. Additionally, geopolitical tensions, energy prices (affecting Eurozone energy imports), and trade balances between the U.S. and EU are likely contributing to volatility. Given the current date, recent ECB and Fed statements or data releases for June 2025 inflation reports.
Technical Analysis:
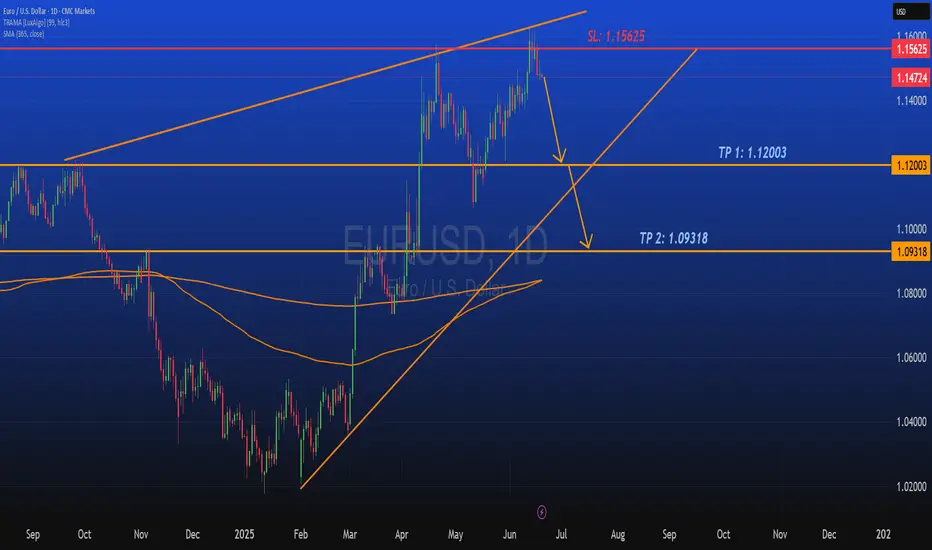
Based on the provided EURUSD 1D chart (covering mid-2024 to mid-2025), the following technical observations can be made:
Trend and Moving Averages:
For EURUSD it shows a descending trend from a peak around 1.48 in mid-2024, with a potential reversal or consolidation forming in mid-2025. The 50-day and 200-day moving averages (depicted as orange lines) are sloping downward, with the price recently testing these levels around 1.12-1.13. A break above the shorter-term moving average could signal bullish momentum, while a failure to hold might confirm a continuation of the downtrend. Looking for key support levels here are identified at 1.09318 (TP 2) and 1.08000, with the current price hovering near 1.12003 (TP 1). Resistance is notable at 1.15625 (SL) and the previous high near 1.4800. The price action suggests a potential bounce from the recent low, with the next target being the resistance zone around 1.15625 if bullish momentum persists. Candlesticks and volume patterns are showing a recent green candlesticks indicate buying pressure, potentially forming a reversal pattern near the 1.12 level. Volume analysis would confirm the strength of this move, with higher volume on upticks supporting a breakout.
Overall Bias:
The technical setup suggests a short-term bullish correction within a broader bearish trend, contingent on breaking and holding above 1.15625. A drop below 1.09318 would invalidate the bullish case and resume the downtrend toward 1.08000 or lower.
Sentiment Analysis
Market sentiment as of June 2025 likely reflects heightened interest in EUR/USD due to recent economic data and central bank policies. Traders and analysts are closely watching for signs of ECB rate cuts or Fed rate hikes, which could sway the pair. On social platforms and financial forums, there may be a mix of caution and optimism looking out for caution due to the Eurozone's economic challenges (energy costs, political uncertainty), and optimism if U.S. data softens, weakening the dollar. The chart's visibility on trading platforms suggests retail and institutional traders are actively monitoring this pair, with a focus on the 1.12-1.16 range as a critical decision point. Sentiment could shift rapidly based on upcoming economic releases or geopolitical developments.
Conclusion
The EUR/USD pair is at a pivotal juncture, with fundamentals pointing to a stronger USD due to Fed policy, while from a technical standpoint suggest a short-term bounce toward 1.15625 if support at 1.12003 holds. Sentiment indicates active trader interest, with eyes on central bank moves. A break above resistance could target 1.4800 (long-term), while a failure might see a decline to 1.08000. Monitor upcoming data for confirmation.
EURUSDThis levels is for reactions to support and resistace.
Price can now in Bull-trend if keep 1.145$ in sypport and breaked trendline.
⚠️Control risk management for positions.

How do you eat an elephant? Small pieces at a time (EURUSD)I know we all are anticipating huge bearish moves from this pair. Some of us sold early and got kicked out. Other sellers have turned bullish. I believe we have found a top here. Sell and take all profit at 1,15765

DeGRAM | EURUSD reached the resistance level📊 Technical Analysis
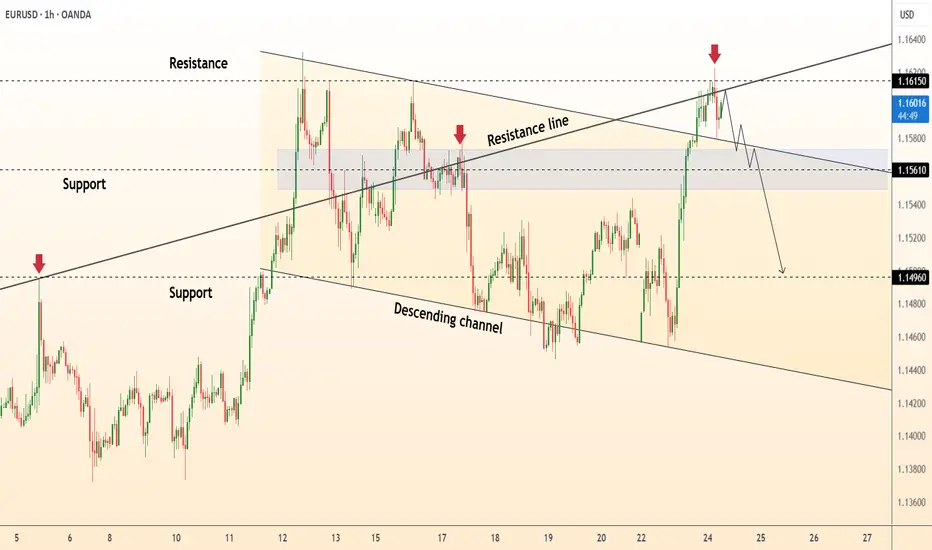
● Price has spiked into the confluence of the long-term channel roof (≈1.1615) and a steeper resistance line, printing a rejection candle and bearish divergence on the 1 h RSI.
● The move leaves a lower high versus 13 Jun and snaps the micro up-sloper; a slide back inside the grey 1.1560-1.1520 supply should accelerate toward the mid-June swing floor at 1.1490.
💡 Fundamental Analysis
● Hotter US S&P-global PMIs rekindled Fed “higher-for-longer” chatter, lifting two-year yields and the DXY, while French election uncertainty widens Bund-Treasury spreads—both pressuring EUR.
✨ Summary
Fade rallies 1.1580-1.1610; sustained trade beneath 1.1560 targets 1.1520 ➜ 1.1490. Bearish view void on an hourly close above 1.1630.
-------------------
Share your opinion in the comments and support the idea with a like. Thanks for your support
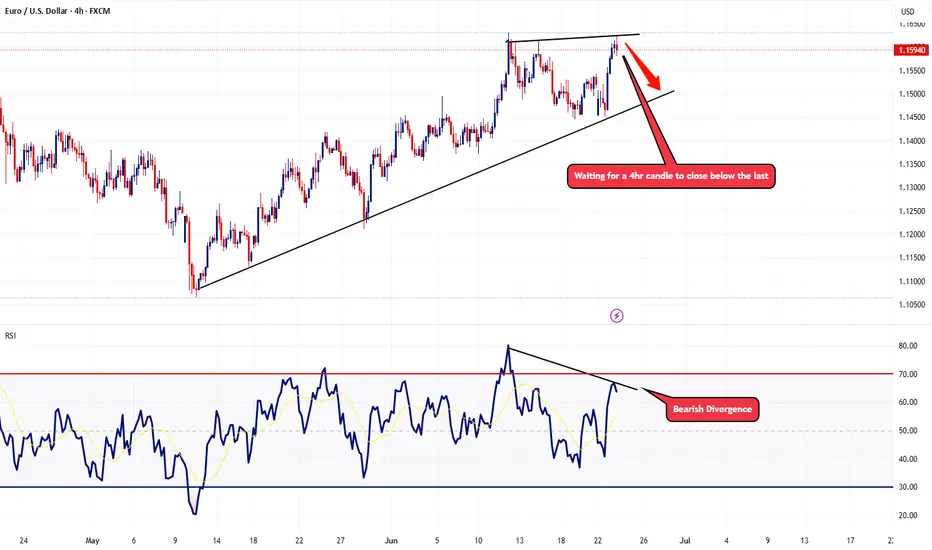
EURUSD Potential Topping ActionTaking a look at the 4hr chart, RSI is showing signs that the bullish momentum is starting to fade with the bearish divergence. In the event we get a 4hr candle that closes below the last, I'll be looking to start scaling some short positions with this pair.
Trade Safe - Trade Well.

EURUSD shortIn my previous analysis in Friday, June 20, I had short pending order on this pair.
Due to US attack on Iran base's over the weekend, I closed it and put another pending short position visible here.
SL: 1.1582
Entry: 1.1550
TP: 1.1357
I expect higher volatility today, but don't expect bigger jump to the upside, so my risk:reward is bigger now.
I expect the price to clean Friday high's and go down again.

EURUSD entering the Bear Zone ...Have an eye on the Orange Circle for a possible short position...
Stay tuned for the comprehensive analysis in next IDEA...
Thank you for your attention and support...
#EURUSD #MJTRADING #FOREX

Uptrend on EURUSDEURUSD has moved higher and is now testing the previous high.
This confirms the analysis and opens up additional buying opportunities.
Reduce the risk on all active buy positions as the analysis plays out.
Additional entries can be considered after a pullback or a breakout followed by a retest.
The next target is 1,1706!

EURUSD Potential UpsidesHey Traders, in the coming week we are monitoring EURUSD for a buying opportunity around 1.14500 zone, EURUSD is trading in an uptrend and currently is in a correction phase in which it is approaching the trend at 1.14500 support and resistance area.
Trade safe, Joe.

EUR-USD Risky Short! Sell!
Hello,Traders!
EUR-USD made a nice bullish
Move up and has almost reached
A horizontal resistance level
Of 1.1631 and the pair is locally
Overbought so after the retest
A local bearish correction
Is to be expected
Sell!
Comment and subscribe to help us grow!
Check out other forecasts below too!
Disclosure: I am part of Trade Nation's Influencer program and receive a monthly fee for using their TradingView charts in my analysis.
Bullish rise?The Fiber (EUR/USD) has broken out of the pivot and could rise to the 1st resistance.
Pivot: 1.1569
1st Support: 1.1530
1st Resistance: 1.1631
Risk Warning:
Trading Forex and CFDs carries a high level of risk to your capital and you should only trade with money you can afford to lose. Trading Forex and CFDs may not be suitable for all investors, so please ensure that you fully understand the risks involved and seek independent advice if necessary.
Disclaimer:
The above opinions given constitute general market commentary, and do not constitute the opinion or advice of IC Markets or any form of personal or investment advice.
Any opinions, news, research, analyses, prices, other information, or links to third-party sites contained on this website are provided on an "as-is" basis, are intended only to be informative, is not an advice nor a recommendation, nor research, or a record of our trading prices, or an offer of, or solicitation for a transaction in any financial instrument and thus should not be treated as such. The information provided does not involve any specific investment objectives, financial situation and needs of any specific person who may receive it. Please be aware, that past performance is not a reliable indicator of future performance and/or results. Past Performance or Forward-looking scenarios based upon the reasonable beliefs of the third-party provider are not a guarantee of future performance. Actual results may differ materially from those anticipated in forward-looking or past performance statements. IC Markets makes no representation or warranty and assumes no liability as to the accuracy or completeness of the information provided, nor any loss arising from any investment based on a recommendation, forecast or any information supplied by any third-party.

eurusd my vison for long time daily tie frameeurusd my vison for long time daily tie frame
i am try to be dicipline with big time frame that gives me good vision with spesific analaysis

EUR/USD 2-Hour Chart - OANDA2-hour performance of the Euro/U.S. Dollar (EUR/USD) currency pair on the OANDA platform as of July 08, 2025. The current exchange rate is 1.17365, reflecting a 0.24% increase (+0.00279). The chart includes a recent sharp decline highlighted in a shaded area, with buy and sell signals at 1.17375 and 1.17357 respectively. Key price levels are marked, ranging from 1.1500 to 1.1850, with a focus on the recent market movement.

EURUSD BUYI’m buying based on rejection of candle closure thus it didn’t confirm downside change . The market makers are still long on the euro and have been closing off their positions it swept early buyers so it should be smooth running from now .

EURUSD 1:15 RR LONG TRADE IDEAEUR/USD – Long Bias
• Drivers: U.S. dollar weakness—from tariffs, rising debt, and anticipation of Fed cuts—has pushed DXY to multi-year lows  . Euro/USD is trading near 1.1775 and holding firm .
• Outlook: Forecasts project a range of ~1.17–1.19 through July .
• Bias: 🔼 Long EUR / Short USD — buy dips, target upside extension before any reversal.

EUR/USD Reversal Ahead? COT + DXY Strength Signal Price has broken below the ascending channel that started in mid-May.
The current candle is rejecting the weekly supply zone (1.17566–1.18319), leaving a significant upper wick.
Daily RSI is losing strength but has not yet reached extreme levels.
A key daily Fair Value Gap (FVG) lies between 1.1600 and 1.1480, with the first potential downside target at 1.14802, which aligns with support and the FVG zone.
A deeper bearish continuation could push price towards 1.1350, but only if the FVG lows are clearly broken.
📊 COT Data (CME - Euro FX & USD Index)
Euro FX
Net long: +15,334
Commercials increased both longs (+13,550) and shorts (+9,913) → mild divergence.
Non-Commercials (speculators) increased shorts (+4,786) more than longs (+1,188) → speculative bias tilting bearish.
USD Index
Strong net long accumulation across all trader types: +4,597 net.
Non-Commercials added +3,590 longs, with only a minor increase in shorts.
→ USD strength continues, reinforcing potential weakness in EUR/USD.
🧠 Retail Sentiment
67% of retail traders are short EUR/USD → typically a contrarian bullish signal.
However, the price is already showing distribution, not accumulation, so we may see price push lower first to trap remaining retail longs, invalidating the contrarian signal in the short term.
📅 Seasonality
July is historically bullish, especially on the 2Y (+0.0142) and 10Y (+0.0106) averages.
However, the 15Y and 20Y averages show a much more moderate performance (+0.007 / +0.0025).
Based on current price action, the seasonal rally may have already played out with the run-up to 1.1830. A correction now seems likely, even if the broader macro remains supportive mid-term.
🧩 Conclusion
Despite historically bullish seasonality for July, both price action and COT data indicate distribution with early signs of reversal.
Retail sentiment is too skewed short for a major breakdown just yet, but the technicals support a short-term pullback toward more balanced levels.
USD strength from COT and DXY structure reinforces a corrective short bias for now.

EURUSD OUTLOOK 8 - 11 JULYNFP and unemployment rate came out bullish for the dollar which caused that big push to the down side. The job market is still holding well thus we are less likely to see the FED cut rates.
Other economic data is still showing that the dollar is weaker against the euro so I'm not going to change my direction bias just yet. Technical analysis also clearly shows that we are still bullish on EURUSD.
We don't have much fundamental data coming out this week so I'm anticipating price to continue lower to give a deeper pullback off of last weeks data, Then next week depending how CPI, PPI and Retails sales go we will get a clearer picture on how to trade the pair.
Last week's 4H outlook is still valid and is more useful when looking to execute trades. This daily Analysis just gives the bigger picture for more of a swing setup analysis

Dollar firms as tariff tensions resurface | FX ResearchAs US traders return from the Independence Day holiday, they'll find a stronger dollar supported by renewed trade tensions and geopolitical noise. Tariffs are back in focus ahead of Wednesday's deadline, with President Trump warning that countries aligning with BRICS policies contrary to US interests will face a 10% tariff.
Markets remain frustrated by shifting timelines as reciprocal tariffs are now pushed to August 1st. China has also announced retaliatory curbs on EU medical device imports, complicating its outreach to the Eurozone.
In Japan, real wages slumped 2.9% in May, underscoring inflation pressures ahead of key elections later this month. On a more positive note, Germany's May industrial production jumped 1.2% and the Eurozone Sentix survey beat expectations, though ECB's Centeno warned of downside risks to inflation and potential euro weakness.
In Sweden, faster-than-expected CPI data has cast doubt on near-term rate cuts from the Riksbank. Today is quiet on the data front in North America, but attention turns to ECB’s Holzmann for further policy clues.
Exclusive FX research from LMAX Group Market Strategist, Joel Kruger

I see a great buying opportunity in this chart.As you can see, the price has entered a suitable buying range after an appropriate correction.Stop loss and target have been set. Enjoy!

eur/usd 07.07The information and publications are not meant to be, and do not constitute, financial, investment, trading, or other types of advice or recommendations.
Have a nice evening ahead.
