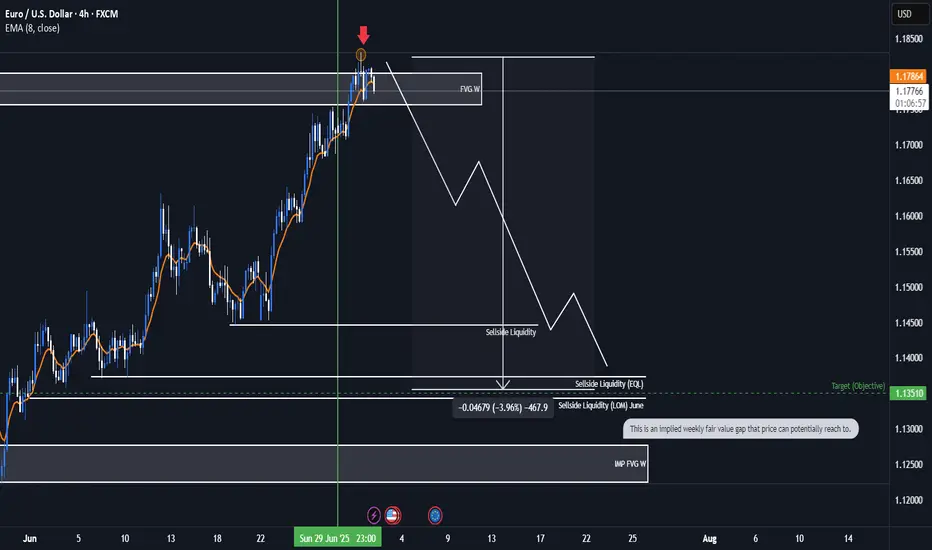
EURUSD Bearish ideaWe are in a weekly fair value gap that we have balance and potentially collected orders to prepare for a potential drop in price. We are anticipating a quarterly shift for the month of July were we could be targeting downside liquidity that is in open float.
* Fundamentals:
-Interest rate differentials shows us that USD interest rate of 4.5 is higher than the interest rate EUR 2.15 which lead to the longer fundamental frame work of price correcting to the higher dollar rate to the euro.
-The COT report also indicates to us that there is huge buying of Dollar by the commercials and a huge amount of selling of the EUR by commercials which can lead us to assume potential weaker dollar.
*Targeting:
-We are looking for the low of last month (June) to be taken out as well as even potentially reaching to the implied weekly fair value gap.
EURUSDTDTM trade ideas
EURUSDEUR/USD Exchange Rate
EUR/USD: 1.17735
The euro has strengthened against the US dollar, trading near its highest level since early 2024, supported by a softer DXY and stable Eurozone outlook.
10-Year Government Bond Yields
Region 10-Year Yield Date
Eurozone 2.560% July 5, 2025
United States 4.348% July 5, 2025
The US 10-year Treasury yield remains above the Eurozone’s, but the gap has narrowed in recent months.
Central Bank Policy Rates
Central Bank Policy Rate Last Change/Status
ECB 2.00% (Deposit Rate) Cut by 25 bps in June 2025
Federal Reserve 4.25%–4.50% Unchanged since Dec 2024
The ECB recently cut its deposit rate to 2.00% RFR 2.15% MLF 2.4%, its lowest in over two years, as inflation nears target and growth remains subdued.
The Fed has held its target range steady at 4.25%–4.50% since December 2024, with markets expecting possible cuts later in 2025 on cautious wait and see approach by feds
Rate and Yield Differentials
Metric US Eurozone Differential (US - Eurozone)
Policy Rate 4.25–4.50% 2.00% 2.25–2.50%
10-Year Bond Yield 4.35% 2.560% 1.79%
Yield Differential: The US 10-year yield exceeds the Eurozone’s by 1.79 percentage points, a key driver for capital flows and EUR/USD direction ,but strong euro zone economic outlook offset the yield and bond advantage giving the euro buy advantage .
Policy Rate Differential: The Fed’s policy rate is 2.25–2.50 percentage points higher than the ECB’s, though the gap is expected to narrow if the Fed cuts rates later this year.
Market Implications
EUR/USD: The narrowing yield and rate differentials have supported euro strength in recent weeks.
Bond Markets: US yields remain higher, but the Eurozone’s 10-year yield is at a multi-year high, reflecting persistent inflation and reduced ECB accommodation.
Central Bank Outlook: Both the Fed and ECB are expected to remain data-dependent, with further easing possible if economic conditions warrant.
The euro is currently strong against the dollar, with narrowing rate and yield differentials reflecting shifting monetary policy expectations and global economic condition.
#eurusd

EURUSD Selling from Resistance at 1.17500 EURUSD Analysis –
4H Timeframe
The pair continues to respect its ascending channel, but current price action suggests a potential sell opportunity from the 1.17500 resistance zone.
🎯 Technical Targets:
🔻 1st Target – 1.16000 (Key demand zone)
🔻 2nd Target – 1.14500 (Deeper support area)
🔻 3rd Target – 1.12500 (Bullish Order Block)
💡 Watch for confirmation signals near resistance before entering shorts.
💬 Like, follow, comment, and join us for more real-time trade ideas and updates!
📲 Let’s grow and trade smart together 💼✨
— Livia 😜

#EURUSD: +770 Pips Swing Move, DXY to Plumment! EURUSD is extremely bullish and is on track to cross the 1.21 area in our long-term swing plan. Based on recent price action, we have set two targets. As DXY continues to drop, the price is likely to remain bullish in the coming days or weeks. Please use accurate risk management while trading and consider this analysis.
Good luck and trade safely!
-Like
-Comment
-Share
Team Setupsfx_

EUR/USD Overview - June 25: Why Did the Dollar Fall Again ?The EUR/USD currency pair continued its upward movement on Tuesday, which had stated on Monday. Let us recall that on Monday, everyone expected a "rollercoaster" right at the market open, i.e., during the night. However, the real action came closer to the evening. The first two trading days of the week were packed with events-of various kinds-capable of supporting both the dollar and the euro. So why did the U.S. currency fall out of favor with the market once again?
If we were to list all the reasons, one article certainly wouldn't be enough. so, let's start with the most local and obvious ones. As early as Monday, we mentioned that the dollar might benefit from another escalation in the Middle East, this time initiated by the U.S. But just think: can the dollar even hypothetically be considered a "safe haven" if one of the warring parties is the U.S.?
The second reason is that Trump launched a strike on Iran's nuclear facilities, and the next day, missiles were flying back-toward Qatar, Israel, and U.S. military bases. And. notably, Iran hit the American bases.
The third reason is that Trump thanked Iran for warning Washington in advance about the upcoming strike. Honestly, the only word that comes to mind here is "farce." Can this even be a war if the participants warn each other before launching attacks? Naturally, the market immediately concluded that this was not a war but a performance. That might be better in some ways-since human casualties were avoided, and that is most important. But at the same time, if the dollar had any hopes of strengthening due to a Middle East escalation, the market realized yesterday that this "escalation" was theatrical and staged.
And it gets even more bizarre. On Tuesday morning, Donald Trump announced a ceasefire. The U.S. President was so eager to establish peace somewhere-anywhere-that he declared the war over without waiting for any official statements from Iran or Israel. And just a few hours later, Iranian missiles took to the skies again. Once more, if this weren't about deadly weapons of mass destruction, the whole situation could be considered a comedy
For the res of Tuesday, Trump posted angry messages every half hour on his own social network, expressing his dissatisfaction not only with Iran but also with Israel. In the afternoon, Trump tried to persuade Israeli not to launch retaliatory strikes, and we're left wondering-does the U.S. President believe that Iranian and Israeli leaders check his Twitter feed before initiating missile attacks?
Frankly, we don' even know how to respond to this circus anymore. But the market certainly does. Why should it buy the dollar-even without the caveat "if Donald Trump remains president"? America has turned from a country with the strongest economy and military into a laughingstock. And these are just the reasons the dollar fell on Monday and Tuesday. Should we even bother listing why the U.S. currency has fallen for five months
The average volatility for the EUR/USD currency pair over the last five trading days as of June 25 is 74 pips, which is characterized as. " We expect the pair to move between the levels of 1.1551 and 1.1699 on Wednesday. The long-term regression channel is directed upward, indicating a continued bullish trend. The CCI indicator entered the overbought zone, which triggered only a minor downward correction
Nearest Support Levels:
S1 - 1.1597
S2 - 1.1475
S3 - 1.1353
Nearest Resistance Levels:
R1 - 1.1719
R2 - 1.1841
R3 - 1.1963
Trading Recommendations:
The EUR/USD pair continues its upward trend. Trump's foreign and domestic policies remain the strongest pressure factor on the U.S. dollar. Additionally, the market interprets or ignores much of the incoming data negatively for the dollar. We continue to observe a complete lack of interest in buying the dollar under any circumstances.
If the price is below the moving average, short positions remain relevant with targets at 1.1475 and 1.1353, though a significant decline in the pair is unlikely under current conditions. If the price is above the moving average, long positions can be considered with targets at 1.1699 and 1.1719 in continuation of the trend.
Explanation of Illustrations:
Linear Regression Channels help determine the current trend. If both channels are aligned, it indicates a strong trend.
Moving Average Line (settings: 20,0, smoothed) defines the short-term trend and guides the trading direction.
Murray Levels act as target levels for movements and corrections.
Volatility Levels (red lines) represent the likely price range for the pair over the next 24 hours based on current volatility readings.
CCI Indicator: If it enters the oversold region (below -250), or overbought region (above +250), it signals an impending trend reversal in the opposite direction.

Eurusd Short-term bearish EUR/USD is showing bearish momentum, breaking below key support with lower highs forming. Selling pressure is increasing amid a stronger USD outlook, favoring a short position.

EURUSD 30Min Engaged ( Bullish Entry Detected )➕ Objective: Precision Volume Execution
Time Frame: 30-Minute Warfare
Entry Protocol: Only after volume-verified breakout
🩸 Bullish Wave Coming From : 1.17850
➗ Hanzo Protocol: Volume-Tiered Entry Authority
➕ Zone Activated: Dynamic market pressure detected.
The level isn’t just price — it’s a memory of where they moved size.
Volume is rising beneath the surface — not noise, but preparation.
🔥 Tactical Note:
We wait for the energy signature — when volume betrays intention.
The trap gets set. The weak follow. We execute.
EURUSD 30Min Engaged ( Bullish Entry Detected )
EURUSDEURUSD
30m Time Frame Bullish setup, Candle Stick Pattern
Move SL To Entry once reach first target.

HelenP. I Euro may soon reverse and test support near $1.1655Hi folks today I'm prepared for you Euro analytics. If we look at the chart, EURUSD has been climbing steadily within an uptrend, bouncing multiple times from the trend line and making higher highs. However, despite the recent bullish structure, the pair is now showing signs of slowing momentum. The price is approaching a possible turning point near the top, and the latest candles show hesitation. Now the pair is trading near 1.1790 and still staying above the trend line, but I believe it may rise a bit more and then break down below the trend line. Once this structure is broken, I expect sellers to take control and push EURUSD toward the nearest support zone between 1.1655 and 1.1630 points. This zone acted as a key level in the past and may serve as the next area of interest for buyers. Given the extended movement and potential loss of bullish pressure, I remain bearish and expect EURUSD to move down to retest support. The level of 1.1655 is my current goal. If you like my analytics you may support me with your like/comment ❤️
Disclaimer: As part of ThinkMarkets’ Influencer Program, I am sponsored to share and publish their charts in my analysis.
Eurousdt techinical analysis.Eurousdt techinical analysis next move posibale at h1 time frame.not finchinal advice.

Anatomy of a Breakout: How to Spot It Before It Fakes You OutFew things in trading are as appealing as a breakout. The chart tightens, volume starts to stir, headlines align, your alerts start going off , and suddenly — boom! Price explodes above resistance. Your adrenaline spikes and you pop open that long.
But just as often, that breakout turns out to be nothing more than an expensive head fake. Price stalls. Sellers swoop in. Your stop gets clipped. And now you’re sitting there, blinking at your screen, “Welp… that was quick.”
Welcome to the bittersweet world of breakouts — where opportunity and deception dance like partners at a high-stakes poker table.
📢 What Is a Breakout, Really?
Let’s get the basics out of the way: A breakout happens when price pushes beyond a key support or resistance level that’s been holding for a while.
That level could be a previous high, a consolidation range, a trendline, or a psychological number that traders obsess over because humans love round numbers (did someone say Bitcoin BITSTAMP:BTCUSD at $120,000 ?).
The logic is simple: Once price clears a well-watched level, trapped shorts have to cover, new longs pile in, and momentum feeds on itself. That’s the dream scenario.
But markets aren’t always that generous. For every clean breakout, there are a few fakeouts lurking — luring in overeager traders with the promise of easy money before slamming the door shut.
⚠️ Why Breakouts May Fail
If breakouts were easy, we’d all be rich. The problem is that breakouts attract a special kind of crowd: late-to-the-party momentum chasers, breakout algorithm bots, and retail traders who read one blog post about technical analysis.
The moment price nudges above resistance, FOMO kicks in. Volume surges. But if the move isn’t backed by genuine institutional buying (you need lots of billions to move the needle nowadays), it quickly becomes what seasoned traders call a “liquidity vacuum” — thin air where the only participants are you, a few equally optimistic Reddit threads, and market makers more than happy to take the other side.
Sometimes breakouts fail because:
The move lacked volume confirmation.
Macro headlines shifted mid-breakout.
A key level was front-run, and the real buyers have already taken profit.
It was a deliberate trap set by larger players to hunt stops before reversing.
Or — more often — the market just needed an excuse to shake out weak hands before resuming the actual move later.
🍸 Volume: The Truth Serum
Let’s be very clear: Breakouts without volume are like dating profiles without photos — you should be suspicious.
When real breakouts occur, you’ll usually see strong accompanying volume. That’s your proof that big players — funds, institutions, serious money — are committing to the move. No volume? Maybe the summer vibes are already here .
Smart traders wait for confirmation:
Is volume above average relative to recent sessions?
Is price holding above the breakout level after the initial pop?
Are follow-through candles printing convincingly?
Are we seeing continuation across related sectors or instruments?
Without these signs, that breakout candle may just be a cruel joke.
🤯 Breakout Psychology
Breakouts prey on two of the most dangerous emotions in trading: greed and urgency. The market whispers, “If you don’t get in now, you’ll miss it.”
This is where breakout psychology becomes more dangerous than the chart itself. Once a breakout happens, most traders are no longer analyzing — they’re reacting. They buy late, set tight stops below the breakout level, and become easy prey for stop-hunting algorithms.
✨ Types of Breakouts
Not all breakouts are created equal. Here’s the lineup you should be watching for:
Clean Breakouts:
The rarest and most beautiful. Strong move, high volume, sustained momentum. You’ll know it when you see it — or after you’ve hesitated and missed it.
Fakeouts (a.k.a. False Breakouts):
Price nudges just past resistance, triggers breakout orders, then swiftly reverses. Designed to shake out breakout traders before resuming the original trend.
Break-and-Retest Setups:
Often the highest-probability trades. Price breaks out, then pulls back to retest the former resistance (now support). If buyers defend this retest, you’ve got confirmation.
News-Driven Breakouts:
Triggered by earnings, economic data, or political events. Volatile, fast, and often unsustainable unless backed by real fundamental shifts.
📈 The “Pre-Breakout Tell”: Reading the Tape
Good breakout traders aren’t just watching levels — they’re watching how price behaves near those levels in advance.
Tight consolidation? Lower volatility into resistance? Declining volume as price grinds higher? That often signals an impending breakout as supply dries up.
Conversely, choppy action with large wicks and erratic volume often signals indecision — ripe conditions for failed breakouts and fakeouts.
Tape-reading matters. The cleaner the structure before the breakout, the better your odds.
💰 Breakout Traders Need Thick Skin
Even with perfect analysis, breakout trading requires accepting that many will fail. That’s the game. Your job isn’t to nail every breakout — it’s to size your positions properly , keep losses small when faked out, and let the clean breakouts run when you catch one.
Stop-loss discipline is everything. Breakouts are binary events: you’re either right quickly, or you’re cutting the trade quickly. There’s no room for “maybe it’ll come back.”
The most painful breakouts are the ones that fake out, stop you, then continue in your original direction. Every breakout trader has lived that nightmare. Accept it. Build it into your risk plan.
👉 Takeaway: Prepare the Setup, Anticipate the Fakeout
Breakouts will always be part of every trader’s playbook. But they require discipline, experience, and an iron stomach. The market loves to tempt you with early signals — your job is to separate signal from noise.
Pro tip: Start your day by checking the Economic calendar and browsing the latest news — staying informed (and witty) helps you build better context for smarter decisions.
So before you chase that next breakout candle, ask yourself:
Is volume there?
Is the broader market supportive?
Have I managed my risk before clicking buy?
Because in trading, the only thing worse than missing a breakout… is getting faked out and blowing up your account chasing it.
Now over to you : Are you a breakout trader or a fakeout victim? Share your best (or worst) breakout stories — we’ve all been there.

EURUSD BEARISH REVERSAL At the top 1.1745, we see strong rejection wicks and bearish engulfing candles, hinting at exhaustion of buyers, Market entered sideways consolidation between 1.1680 and 1.1740, Price failed to break out of this range multiple times — forming a range-bound or distribution phase.
The current bullish candle indicates a temporary relief rally after recent bearish pressure, Rejection from 1.1720–1.1740 may send price back to test 1.1690 or lower.

EURUSD📉 EURUSD – 30min Short Plan
📊 Structure: LLs & LHs forming – bearish trend confirmed
🕯️ Pattern: Bearish Engulfing at Lower High
🎯 Entry: instant
📌 Trade 1
– 🎯 TP1: 1:1
– ⚠️ Risk: 1%
📌 Trade 2
– 🎯 TP2: larger reward
🛠️ Execution:
– Place both trades at same entry
– Trail SL after TP1 hit
📎 Bias: Bearish

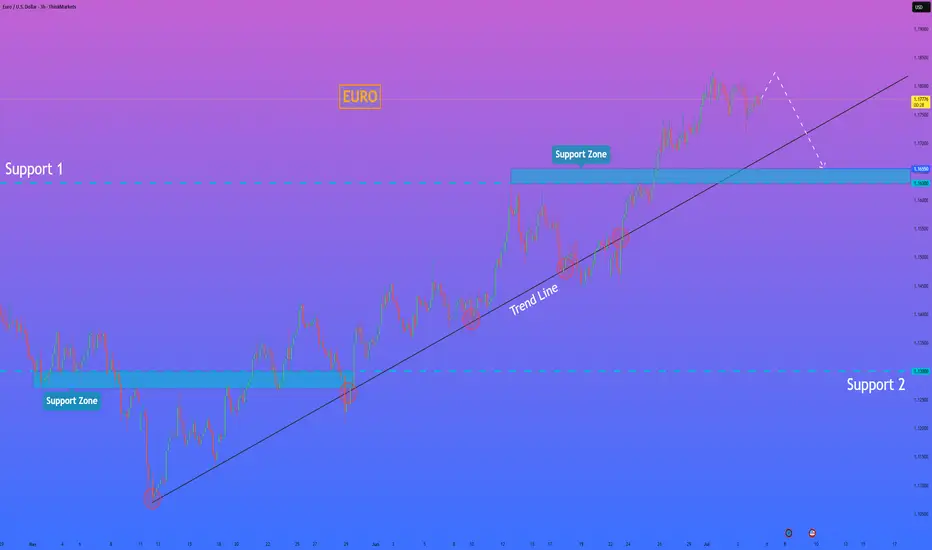
EURO - Price can continue to grow inside rising channelHi guys, this is my overview for EURUSD, feel free to check it and write your feedback in comments👊
The price traded in a flat range between $1.1500 and $1.1750 for an extended period, testing both extremes multiple times with low volatility and indecision.
A breakout above $1.1750 initially looked promising but turned into a fakeout when sellers quickly pushed the price back below $1.1725, trapping aggressive longs.
After that shakeout, buyers regained control and propelled EUR into a rising channel, marked by higher highs and higher lows since the end of June.
Price has since respected the lower boundary of this rising channel near $1.1725–$1.1750, using it as reliable support for continued gains.
With two confirmed breakouts and the channel structure intact, bullish momentum suggests the pair can extend its move higher within the channel.
I expect Euro to continue climbing toward the next key resistance at $1.1980, where the upper channel line and structural supply zone converge.
If this post is useful to you, you can support me with like/boost and advice in comments❤️
Disclaimer: As part of ThinkMarkets’ Influencer Program, I am sponsored to share and publish their charts in my analysis.


EURUSD: Support & Resistance Analysis for Next Week 🇪🇺🇺🇸
Here is my latest structure analysis
and important supports & resistances for EURUSD for next week.
Consider these structures for pullback/breakout trading.
❤️Please, support my work with like, thank you!❤️
I am part of Trade Nation's Influencer program and receive a monthly fee for using their TradingView charts in my analysis.

EURUSD BULISH OR BEARISH DETAILED ANALYSISEURUSD has been playing out exactly as forecasted, now trading confidently above the key 1.17 handle. Price action has respected prior structure levels perfectly, with the recent bullish impulse forming clean higher highs and higher lows. After a minor corrective move and successful retest of the previous breakout zone, we’re now seeing continuation momentum build toward the 1.21 target. This pattern is a textbook bullish flag followed by a clean breakout and retest, confirming the strength behind this current upside leg.
Fundamentally, the euro has gained strength due to growing divergence between the ECB and the Fed. With inflation in the Eurozone stabilizing and recent data indicating a modest recovery in manufacturing and services PMI, there's increasing speculation the ECB may hold rates longer, while the Fed is seen leaning toward eventual rate cuts as US labor data softens. The June NFP miss and downward revisions in prior data have weakened the USD’s position, creating a favorable environment for EURUSD bulls.
The technical confluence with macro fundamentals is striking. Risk sentiment is improving across global markets as inflation fears ease and rate clarity emerges. The euro remains supported by strong capital inflows and demand for yield stability. Additionally, EURUSD has cleared multi-month resistance zones with conviction, signaling institutional interest and momentum-based positioning. The recent candle formations suggest buyers are in firm control.
We remain on track for the 1.21 level, which aligns with prior swing highs and a key Fibonacci extension target. Any pullback toward the 1.16–1.1650 region should be viewed as a high-probability buying opportunity. With the DXY under pressure and euro zone resilience improving, EURUSD continues to be one of the top-performing major pairs heading into Q3. Stay patient and ride the wave—this move has more room to run.

EU on 4HEU on 4H - pretending to be bullish. showing signs to go up but on lower timeframe it shows it can be scalped the way through

EU may stop rising soon. Closes to W1 downtrend!1. Key points for reversal coming:
The bullish wave on the weekly (W1) timeframe has been rising for quite a long time and has extended significantly.
It is approaching the downtrend zone on the weekly/monthly (W1/MN) chart.
There is a twisted Kumo top in the Ichimoku Cloud, indicating potential indecision or reversal.
The current structure may be forming the right shoulder of a Quasimodo pattern.
The TDI (Traders Dynamic Index) momentum indicator is showing a strong overbought condition.
2. Plan: Sell around 1.1950!

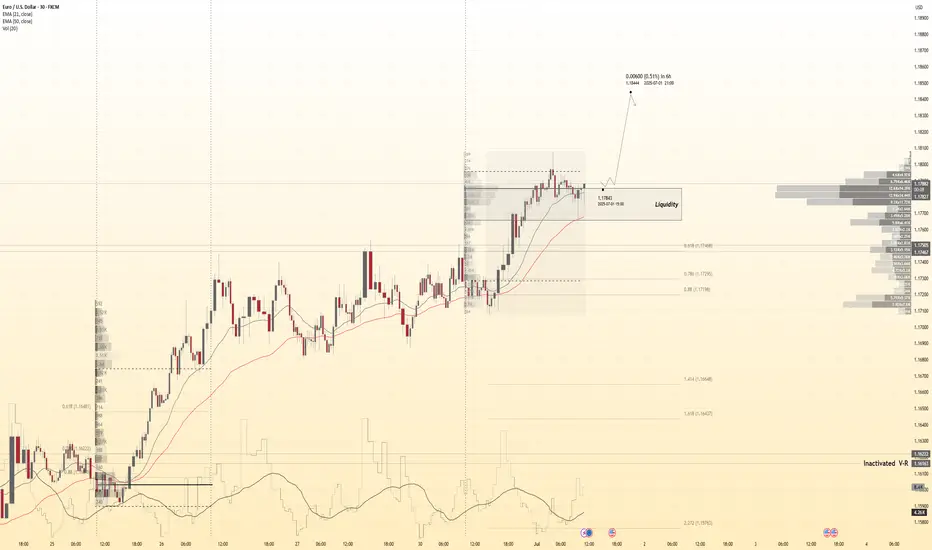
EURUSD BuyExternal structure is bullish. Price took liquidity from a POI. gave a reaction which broke internal structure and came back to mitigate an Order Block.

Bullish bounce off pullback support?EUR/USD is falling towards the support level which is a pullback support that aligns with the 38.2% and the 61.8% Fibonacci retracement and could bounce from this level to our take profit.
Entry: 1.1742
Why we like it:
There is a pullback support level that lines up with the 38.2% and the 61.8% Fibonacci retracement.
Stop loss: 1.1698
Why we like it:
There is a pullback support that is slightly below the 50% Fibonacci retracement.
Take profit: 1.1814
Why we like it:
There is a pullback resistance.
Enjoying your TradingView experience? Review us!
Please be advised that the information presented on TradingView is provided to Vantage (‘Vantage Global Limited’, ‘we’) by a third-party provider (‘Everest Fortune Group’). Please be reminded that you are solely responsible for the trading decisions on your account. There is a very high degree of risk involved in trading. Any information and/or content is intended entirely for research, educational and informational purposes only and does not constitute investment or consultation advice or investment strategy. The information is not tailored to the investment needs of any specific person and therefore does not involve a consideration of any of the investment objectives, financial situation or needs of any viewer that may receive it. Kindly also note that past performance is not a reliable indicator of future results. Actual results may differ materially from those anticipated in forward-looking or past performance statements. We assume no liability as to the accuracy or completeness of any of the information and/or content provided herein and the Company cannot be held responsible for any omission, mistake nor for any loss or damage including without limitation to any loss of profit which may arise from reliance on any information supplied by Everest Fortune Group.

EURUSD 30Min Engaged ( Bullish Entry Detected )➕ Objective: Precision Volume Execution
Time Frame: 30-Minute Warfare
Entry Protocol: Only after volume-verified breakout
🩸 Bullish Wave Coming From : 1.17400
➗ Hanzo Protocol: Volume-Tiered Entry Authority
➕ Zone Activated: Dynamic market pressure detected.
The level isn’t just price — it’s a memory of where they moved size.
Volume is rising beneath the surface — not noise, but preparation.
🔥 Tactical Note:
We wait for the energy signature — when volume betrays intention.
The trap gets set. The weak follow. We execute.
EURUSD 30Min Engaged ( Bullish Entry Detected )

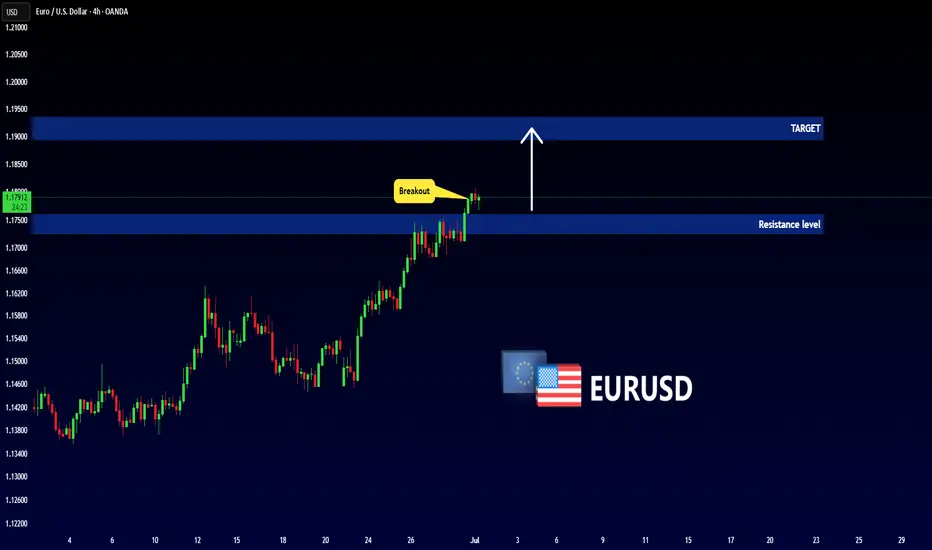
EURUSD - Important Breakout !Hello Traders !
The EURUSD price broke the resistance level (1.17255 - 1.17602).
This key level becomes new support!
So, I expect a bullish move🚀
________________
TARGET: 1.18950🎯