EURUSD looking for rejection for continue BearishAs what I see, the price already touch resistance and make minor rejection.
We can stand by for swing sell, if confirmation occur at Daily timeframe.
For now, I will wait for the price at weekly zone.
EURUSDTDTM trade ideas

EURUSD InsightWelcome, everyone!
Please feel free to share your personal thoughts in the comments. Don’t forget to hit the booster and subscribe!
Key Highlights
- Christopher Waller, a Federal Reserve Governor, stated in a CNBC interview that a rate cut in July should be considered.
- The United States has attacked three Iranian nuclear facilities located in Fordow, Natanz, and Isfahan. In response, Iran has hinted at potentially blocking the Strait of Hormuz and has warned of retaliatory action. The U.S. Department of Defense responded by warning that any retaliation would result in a much stronger counterattack.
- According to The Wall Street Journal, the Trump administration has notified that it plans to restrict the supply of U.S.-made semiconductor equipment to Samsung Electronics and SK Hynix’s factories in China.
This Week’s Key Economic Events
+ June 24: Fed Chair Jerome Powell testimony
+ June 25: Fed Chair Jerome Powell testimony
+ June 26: U.S. Q1 GDP release
+ June 27: U.S. May PCE Price Index release
EURUSD Chart Analysis
The EURUSD pair has shown a downward move after facing resistance at a recent trend high. Although it is currently experiencing a slight rebound around the 1.14500 level, the overall trend remains bearish. The next likely support level is around 1.13000, and a recovery may follow once this area is tested.
If, contrary to expectations, the price breaks above the current trend high, a new strategy will be established accordingly.
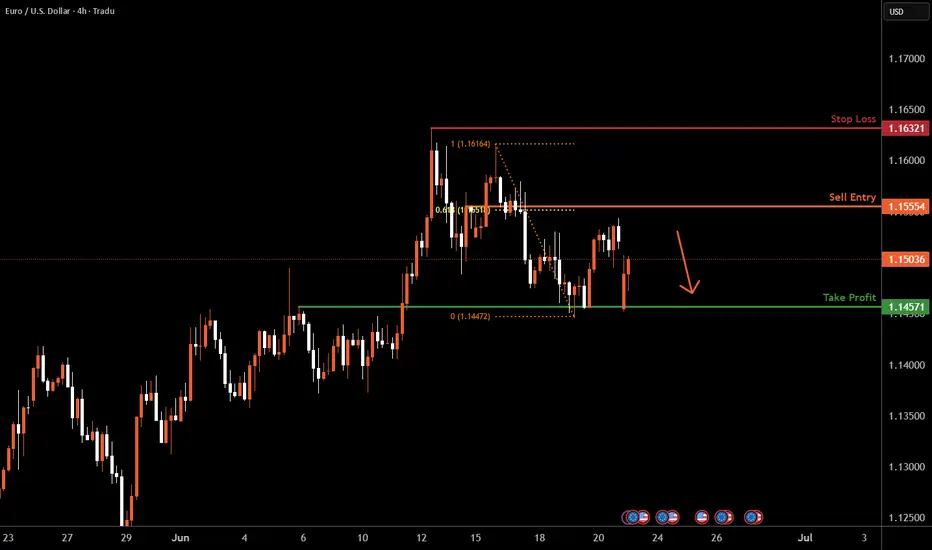
EURUSD H4 I Bearish Reversal Off the 61.8% FibBased on the H4 chart, the price is rising toward our sell entry level at 1.1555, a pullback resistance that aligns with the 61.8% Fib retracement.
Our take profit is set at 1.1457, an overlap support.
The stop loss is set at 1.1632, a swing high resistance.
High Risk Investment Warning
Trading Forex/CFDs on margin carries a high level of risk and may not be suitable for all investors. Leverage can work against you.
Stratos Markets Limited (tradu.com ):
CFDs are complex instruments and come with a high risk of losing money rapidly due to leverage. 63% of retail investor accounts lose money when trading CFDs with this provider. You should consider whether you understand how CFDs work and whether you can afford to take the high risk of losing your money.
Stratos Europe Ltd (tradu.com ):
CFDs are complex instruments and come with a high risk of losing money rapidly due to leverage. 63% of retail investor accounts lose money when trading CFDs with this provider. You should consider whether you understand how CFDs work and whether you can afford to take the high risk of losing your money.
Stratos Global LLC (tradu.com ):
Losses can exceed deposits.
Please be advised that the information presented on TradingView is provided to Tradu (‘Company’, ‘we’) by a third-party provider (‘TFA Global Pte Ltd’). Please be reminded that you are solely responsible for the trading decisions on your account. There is a very high degree of risk involved in trading. Any information and/or content is intended entirely for research, educational and informational purposes only and does not constitute investment or consultation advice or investment strategy. The information is not tailored to the investment needs of any specific person and therefore does not involve a consideration of any of the investment objectives, financial situation or needs of any viewer that may receive it. Kindly also note that past performance is not a reliable indicator of future results. Actual results may differ materially from those anticipated in forward-looking or past performance statements. We assume no liability as to the accuracy or completeness of any of the information and/or content provided herein and the Company cannot be held responsible for any omission, mistake nor for any loss or damage including without limitation to any loss of profit which may arise from reliance on any information supplied by TFA Global Pte Ltd.
The speaker(s) is neither an employee, agent nor representative of Tradu and is therefore acting independently. The opinions given are their own, constitute general market commentary, and do not constitute the opinion or advice of Tradu or any form of personal or investment advice. Tradu neither endorses nor guarantees offerings of third-party speakers, nor is Tradu responsible for the content, veracity or opinions of third-party speakers, presenters or participants.
EUR_USD RISING SUPPORT AHEAD|LONG|
✅EUR_USD is trading along the rising support
And as the pair will soon retest it
I am expecting the price to go up
To retest the supply levels above at 1.1511
LONG🚀
✅Like and subscribe to never miss a new idea!✅
Disclosure: I am part of Trade Nation's Influencer program and receive a monthly fee for using their TradingView charts in my analysis.

EURUSD Stalling—Breakout or Breakdown Next?EURUSD has been trending higher but is now flashing signs of exhaustion. While shorts remain risky without more confirmation, aggressive traders could explore them near the highs. Longs also carry increasing risk at these extended levels. Two idea paths: a cautious long continuation, or a speculative reversal trade. A clean break of key trendlines will likely invalidate short setups and resume the uptrend.

EURUSD H4 AnalysisEURUSD Showing a bullish Flag. If it breaks this zone above, Most probably can fly up to 1.15818 and higher to 1.16322. If no, Can rally between 1.14320, 1.13067 or even lower. Trading Analysis from 23-06-25 to 27-06-25. Take your risk under control and wait for market to break support or resistance on smaller time frame. Best of luck everyone and happy trading.🤗

Buy direction for eurusdEURUSD pullback has come to an end, looking forward for a buy to a new high. more like forming head and shoulder pattern at the bottom of the pullback, trade with caution wait for your setup entry exit if trade go wrong and hold if trade still have momentum

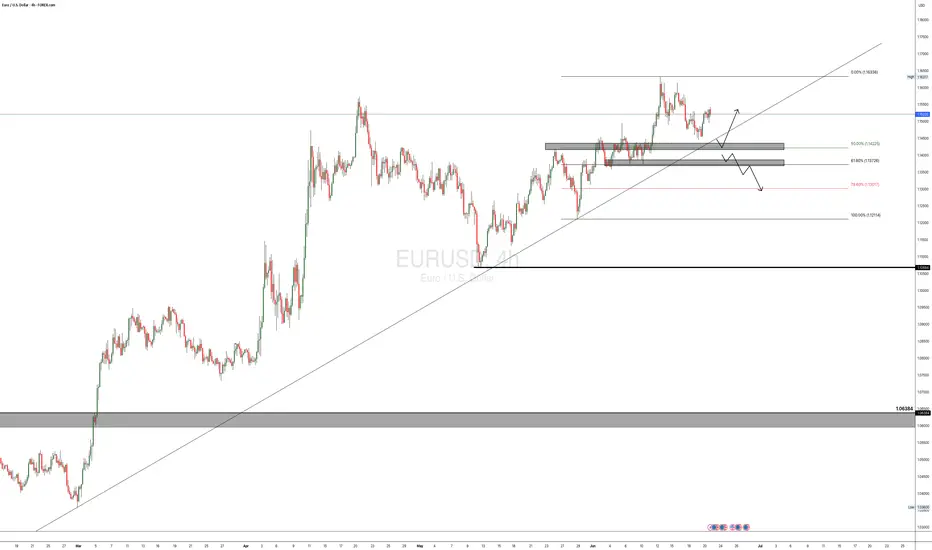
EURUSD – Technical Analysis and Long Position OpportunityIn this pair, there is a possibility to open a long position.
When analyzing the pair on higher timeframes, using a 45-period exponential moving average and two simple moving averages of 70 and 95 periods, supported by a Parabolic SAR, an opportunity for a buy position can be identified.
Although the pair is currently consolidating on lower timeframes, it is showing a strong upward movement on the higher timeframes.
This outlook is based on the fact that, in June, a significant bullish candle was formed, followed this month by a doji candle pattern, which could indicate a continuation of the upward trend.
On the higher timeframes, the technical indicators are also aligning in the correct order and direction, suggesting that this may be the right moment to enter a long position.
However, it is important to emphasize that, despite the technical analysis presented, attention should be given to news, economic data, and other factors that could impact this pair, as this analysis relies solely on technical criteria.
The long position tool shown on the chart serves only as additional support for entering the trade.

Bearish reversal?EUR/USD is rising towards the resistance level which is a pullback resistance that lines up with the 61.8% Fibonacci retracement and could reverse from this level to our take profit.
Entry: 1.1555
Why we like it:
There is a pullback resistance that lines up with the 61.8% Fibonacci retracement.
Stop loss: 1.1608
Why we like it:
There is a pullback resistance.
Take profit: 1.1483
Why we like it:
There is a pullback support level that aligns with the 61.8% Fibonacci retracement.
Enjoying your TradingView experience? Review us!
Please be advised that the information presented on TradingView is provided to Vantage (‘Vantage Global Limited’, ‘we’) by a third-party provider (‘Everest Fortune Group’). Please be reminded that you are solely responsible for the trading decisions on your account. There is a very high degree of risk involved in trading. Any information and/or content is intended entirely for research, educational and informational purposes only and does not constitute investment or consultation advice or investment strategy. The information is not tailored to the investment needs of any specific person and therefore does not involve a consideration of any of the investment objectives, financial situation or needs of any viewer that may receive it. Kindly also note that past performance is not a reliable indicator of future results. Actual results may differ materially from those anticipated in forward-looking or past performance statements. We assume no liability as to the accuracy or completeness of any of the information and/or content provided herein and the Company cannot be held responsible for any omission, mistake nor for any loss or damage including without limitation to any loss of profit which may arise from reliance on any information supplied by Everest Fortune Group.

EURUSD 06/18/25 APre-Analysis
1) Session Break (NY took out L)
2) Expecting? (Trend)
3) High Volume located at (Breach)
4) Leg being traded? (1)
5) Market digestion? (1hr)
6) Edge? (S1) higher TF is (1hr)
7) Edge Specifics? (S1H)
8) Continuation
9) Micro Timeframe 15min)
10) Class (A)

EURUSD -> Bullish Idea 22/06/2025(ICT x Volume Profile)OANDA:EURUSD 🎯 Bias: Bullish
🕒 Timeframe: H1 primary, H15 confirmation
Happy sunday traders!
Following President Trump’s strikes on Iran, I expect an initial bearish reaction in the Asian and London Sessions, then a bullish reaction in the NY sessions as sellers push the USD lower. However, the prevailing trend context remains bullish: the hourly chart has shifted structure (MSS) and broke structure to the upside. I anticipate a liquidity sweep below the recent lows, before a retracement into the 15-minute fair value gap (FVG) which aligns with the volume profile, then continuation higher to target the weak high and into the swing highs marked.

Can the EUR/USD break out of its range-bound trading?The EUR/USD has advanced for the third consecutive trading day, rebounding above the key 1.1500 level and trading around 1.1530 during the European session. US President Trump's statement that it would take two weeks to decide whether to intervene in the Middle East conflict effectively alleviated market concerns over conflict escalation, providing support for the euro. Analysts believe that the exchange rate is likely to remain range-bound between 1.1400 and 1.1600 over the next 1-2 weeks. Any new developments in geopolitical tensions could significantly impact the exchange rate. If positive progress is made in the Iran nuclear talks, the exchange rate is expected to challenge the upper boundary of the range; conversely, if the Middle East situation deteriorates further, the exchange rate may retest the 1.14 support level.
you are currently struggling with losses,or are unsure which of the numerous trading strategies to follow,You have the option to join our VIP program. I will assist you and provide you with accurate trading signals, enabling you to navigate the financial markets with greater confidence and potentially achieve optimal trading results.
Trading Strategy:
buy@1.4500-1.4700
TP:1.5300-1.5500

EURUSDEURUSD have one more down and then go back up if geopolitical situation calms down.
Disclosure: We are part of Trade Nation's Influencer program and receive a monthly fee for using their TradingView charts in our analysis.

HelenP. I Euro will break resistance level and continue to fallHi folks today I'm prepared for you Euro analytics. On this chart, we can see how price initially moved inside a triangle formation, forming higher lows from the trend line and testing the resistance zone multiple times. Eventually, price broke out to the downside, falling sharply and breaking through the lower boundary of the triangle and also the trend line, signaling a shift in market sentiment. After touching the support zone and forming a temporary bottom, the pair started climbing back up, but this movement was more of a correction than a trend reversal. Price respected the trend line from below and followed it upward, but failed to break significantly higher. It managed to push above both support 2 and support 1 levels, which now act as resistance. Currently, EURUSD is trading inside the resistance zone, where previous reactions have led to strong bearish impulses. Given this behavior and the recent false breakout, I expect the price to rebound from this area and break back below support. My goal is set at 1.1350, anticipating further downside movement as the bearish structure remains valid. If you like my analytics you may support me with your like/comment ❤️
Disclaimer: As part of ThinkMarkets’ Influencer Program, I am sponsored to share and publish their charts in my analysis.

#AN009: US attacks IRAN, what will happen?
On June 22, 2025, the United States launched air strikes on three Iranian nuclear sites (Fordow, Natanz, Isfahan), using bunker-buster bombs and Tomahawk missiles, some dropped by B-2 stealth bombers
President Trump declared that the facilities were “completely and totally obliterated”
📈 Tensions and geopolitical context
Tehran responded with missiles aimed at Israel and promised “tough responses”
The UN and key figures such as Guterres and Medvedev have defined the action as a dangerous escalation with the risk of a new conflict on a regional scale.
Israel supported the attacks, while Iran convened the UN Security Council to condemn the aggression.
💥 Market Impact
⚡ Energy Sector
Oil prices jump towards $90–100 per barrel on fears of flows from Iran and potential closures of the Strait of Hormuz.
Investors reacted with a move towards safe haven assets such as the Dollar, Gold and Treasuries.
📊 Equities and sensitive sectors
Starts on an uncertain tone: S&P500 and Nasdaq futures “volatile open”, with penalties on travel and tech, and increases on energy and defense.
Gulf markets open slightly higher (Saudi, Qatar, Bahrain, Kuwait), thanks to the attenuation of initial sell-offs.
🌍 Global economic impact
Weakening predictions from the World Bank, IMF and OECD predict an economic slowdown due to energy shocks and increased global tensions.
📌 Currency and Forex Scenario
USD has gained ground as a safe haven asset, benefiting from Safety flows.
Commodity-linked pairs, such as AUD/USD, NZD/USD and CAD/USD, will be pressured by rallying oil.
Potential increase in volatility on EUR/USD and GBP/USD: they rotate towards safe haven and US/China political risk.
📣 What to watch out for
Daily and H4 candlesticks in EUR/USD and GBP/USD to understand if support holds under geopolitical stress.
Volatility indicators (VIX | MOVE) are rising, it is useful to calibrate the size and prefer structured trades.
In the coming days it will be essential to monitor:
Reuters/Bloomberg for updates on possible sanctions or public retaliation.
ASEAN and Asia for regional reactions on energy supplies.
Central banks on inflation expectations due to high oil.
💡 Conclusions – Market and Forex Impact
This military action represents a classic geopolitical shock: rising dollar and defensive assets, pressure on oil and high volatility on stock markets and exchange rates. Unlike Israeli attacks, the direct entry of the US increases the degree of macro uncertainty.
For Forex traders:
USD Index: potential rebound within the bullish trend channel
Pairs with commodities: activate strategies on breakout key levels (e.g. AUD/USD, CAD/USD)
Anti-USD FX (EUR, GBP, JPY): under pressure and to be used in range rebound.
For the equity sector:
Rotation towards defensive sectors, defense, energy.
Possible entry into government bonds as a high inflation/political hedge.
Overall, the impact is clear: increased geopolitical risk → high volatility → shift towards USD/safe haven asset → penalization of sensitive assets.

EURUSD weekly outlookI’m waiting for price to tap into the bearish FVG and sweep the buyside liquidity around before looking for a sell. If price sweeps the sellside liquidity or the lower FVG around I’ll shift my focus to a buy setup. Trading both sides of the range based on liquidity grabs and reaction.

Bullish EURUSDPRICE IS CURRENTLY ON A STRONG BULLISH MOMENTUM!! . A small bearish trend inside that bullish trend just broke shifting the momentum back to the buyers . Price is currently on a SUPPORT level , hence I will place my orders BUY .

AI Algo Systems vs. Manual Trading: Which Delivers Real Results?AI Algo Systems vs. Manual Trading: Which Delivers Real Results? ⚖️
________________________________________
Introduction
With the explosive rise of artificial intelligence (AI) in financial markets, traders everywhere are asking the million-dollar question:
Should I trust my trades to automation, or keep my hands on the wheel? 🧠🤖
This guide offers a real-world, side-by-side comparison between AI-powered algorithmic trading systems and traditional manual trading. We’ll highlight where each method dominates, when they fail, and how you can combine both to build a system that outperforms the rest. 💡
What Are AI Algo Systems? 🤖
AI trading systems use advanced machine learning models to:
• Analyze huge volumes of historical and real-time data 📈
• Detect patterns and trading opportunities faster than any human
• Automatically execute trades using coded logic, without emotion
🔬 Real-World Examples:
• Neural networks (LSTM, CNN): Predicting EUR/USD direction based on years of tick data
• Reinforcement learning agents: Managing position sizing dynamically in crypto scalping
• Predictive classifiers: Spotting likely trend reversals on S&P 500 based on 20+ indicators
Key Benefits:
• 🔄 Emotionless execution: No fear, no greed, just rules
• ⏱️ Lightning-fast trades: React to price action instantly
• 📊 Pattern recognition: Finds subtle correlations people miss
________________________________________
What Is Manual Trading? 👤
Manual trading is powered by human intelligence and judgment. Traders use:
• Price action and SMC/ICT techniques (e.g., order blocks, BOS)
• Fundamental analysis: News, sentiment, macro reports
• Intuition and experience: Reading between the lines the way only humans can
🧑💼 Real-World Examples:
• A trader spots an untested order block on GBP/JPY and waits for liquidity sweep before entering
• Reading a dovish tone in FOMC minutes and fading the initial spike on DXY
• Using “market structure shifts” after a big news event to catch a reversal
Key Benefits:
• 🔍 Contextual awareness: Understand the full market story
• 🎯 Real-time adaptability: Adjust plans on the fly
• 🧠 Creative edge: Find setups no algorithm can code for
________________________________________
Side-by-Side Comparison Table 📋
Feature AI Algo Trading 🤖 Manual Trading 👤
Execution Speed Instant Slower, can lag
Emotions Involved None Prone to fear/greed
Adaptability Limited (needs retrain) High
Learning Curve High (coding/tech) Medium (market logic)
Strategy Flexibility Pre-coded only Unlimited creativity
Backtesting Automated Manual/semi-auto
Session Monitoring 24/5 via server Human-limited hours
________________________________________
When AI Algo Systems Work Best 💾
AI is unbeatable when you need:
• Scalability: Watching 10, 20, or even 100+ pairs 24/5
• High-frequency execution: Entering/exiting trades within milliseconds
• Repetitive strategies: Like mean reversion, breakout scalps, or arbitrage
📈 Example:
• Strategy: EUR/USD London open breakout
• Process: AI model detects volume and volatility spike, enters trade with 0.3% risk, targets FVG
• Results: 60% win rate, 1.8R average reward over 3 months
________________________________________
When Manual Trading Wins 🧠
Manual skills shine when you need:
• Discretionary entries: Especially with complex SMC/ICT structures
• Adapting to breaking news: Sudden CPI, FOMC shocks, geopolitical headlines
• Making sense of market narrative: When volatility is off the charts and AI gets confused
🗞️ Example:
• News: Surprise ECB rate hike
• Setup: Price sweeps liquidity and forms new order block
• Action: Trader enters based on confluence of structure, sentiment, and news
• Why AI fails: Model trained on normal volatility might get stopped out or miss entry entirely
________________________________________
Hybrid Strategy: The Best of Both Worlds 🌐
Elite traders combine the power of AI with human oversight.
Hybrid Workflow:
1. AI scans markets: Flags setups (order blocks, FVGs, volume spikes)
2. You review: Confirm bias with news, sentiment, or higher time frame
3. Entry:
o Manual (you pull the trigger)
o Semi-automated (AI suggests, you approve)
🔁 You save time, avoid missing setups, but keep critical discretion and control.
________________________________________
Risk Management: Algo vs. Manual 📊
AI:
• Stops, lot size, SL/TP are auto-calculated
• Consistent, never emotional
• Example: EA manages all USD pairs with 0.5% fixed risk per trade
Manual:
• Trader might override risk plan
• Discipline needed—easy to “revenge trade” after a loss
• Example: You up your risk size after a losing streak, breaking your rules
Best Practice:
📌 Let AI calculate risk size. Manually approve or override the entry. Double safety net.
________________________________________
Trader Case Study 👤
Name: Ray – $100K funded prop trader
Style: Hybrid (AI scanner + manual ICT confirmations)
Process:
• Sets HTF bias each morning
• AI scans for OB/BOS setups during NY session
• Manual review before entry
Performance:
• Win rate: 63%
• Avg R: 2.5
• Monthly gain: 9.7%
Ray’s Words:
“AI catches what I can’t see. I catch what it can’t understand.”
________________________________________
Mistakes to Avoid ❌
• 🚫 Blindly trusting black-box AI: Always verify signals
• 🚫 Micromanaging every tick: Let automation work, don’t over-interfere
• 🚫 Running AI during high-impact news: Most bots aren’t built for chaos
• 🚫 Ignoring psychology: Even if AI executes, your mindset impacts risk and management
________________________________________
Conclusion ✅
There’s no one-size-fits-all answer. The best traders in 2025 master both worlds. Here’s the winning formula:
• Harness AI’s speed and pattern recognition
• Lean on manual judgment for narrative and nuance
• Blend them with intention and structure for a trading system that’s fast, flexible, and resilient.
💥 Don’t pick sides. Master both.
That’s how the top 1% trade today—and win. 🚀⚙️📊

EURUSD: Important Supports & Resistances For Next Week 🇪🇺🇺🇸
Here is my latest structure analysis for EURUSD for next week.
Consider these supports and resistances for breakout/pullback trading.
❤️Please, support my work with like, thank you!❤️
I am part of Trade Nation's Influencer program and receive a monthly fee for using their TradingView charts in my analysis.

EURUSD| Weekly OutlookSame story as last week — still patiently waiting for the major engineered liquidity above to get cleared before considering any meaningful longs.
That said, EU is currently offering a clean structure for short setups into the downside order block. Everything is lining up technically, but it’s important to note this is a counter-trend move — and personally, I’m not taking it.
It’s tempting when structure looks this clean, but I know it’s not my proper approach. For me, the real play is still higher — waiting on that bull-side OB mitigation to align with the bigger picture narrative. Until then, I’ll let others chase while I sit on my hands. Pure discipline only.
Bless Trading!

Forex and Gold Market Highlights June 21 2025Forex & Gold Market Highlights – June 21, 2025
🕒 Key Events This Week:
• 🏦 Fed officials signaling possible rate cuts vs. cautious economic tone
• 🌍 Escalating Israel–Iran tensions boosting safe-haven flows
• 🏭 Mixed U.S. macro data (retail sales, Philly Fed, housing) shaping Fed expectations
________________________________________
💶 EUR/USD Nears 1.1520 on Safe-Haven Flows
EUR/USD edged up to about 1.1520 amid weakness in the U.S. dollar, driven by global risk-off sentiment. Mixed signals from the Fed kept traders cautious.
________________________________________
💷 GBP/USD Hovering Around 1.3500 on USD Strength
GBP/USD remains near 1.3500, slipping slightly off highs after weaker UK retail data. The pair faces resistance in the 1.3550–1.3600 zone.
________________________________________
💴 USD/JPY Eyeballing 146 Resistance
USD/JPY climbed toward 146.00, driven by risk-averse USD demand and dovish BOJ stance. The pair is testing key retracement resistance near 146.76.
________________________________________
🥇 Gold Pulls Back but Holds Ground
Spot gold slid to around $3,334 3,381 this week, under pressure from a stronger dollar and diminished Fed rate-cut hopes. Still, geopolitical jitters kept it from falling hard.
• Weekly drop of ~2.5%, trading in a $3,330–$3,400 range.
________________________________________
📈 DXY Index Rallies on Risk Aversion
The U.S. Dollar Index rose ~0.45%, marking its strongest weekly gain in over a month due to heightened safe-haven flows amid Middle East tensions.
________________________________________
📌 Market Outlook:
• EUR/USD: Mixed bias. May test 1.1550–1.1600 if risk-off continues; downside risk near 1.1400 if U.S. data surprises.
• GBP/USD: Expected to stay in the 1.3450–1.3550 range; UK economic data and USD momentum will be key.
• USD/JPY: Bullish tilt remains toward 146.76, but any BOJ hints of policy tightening could shake it.
• Gold: Pressure from a firm dollar is likely to persist. Watch for geopolitical developments and upcoming Fed signals for reversal clues.

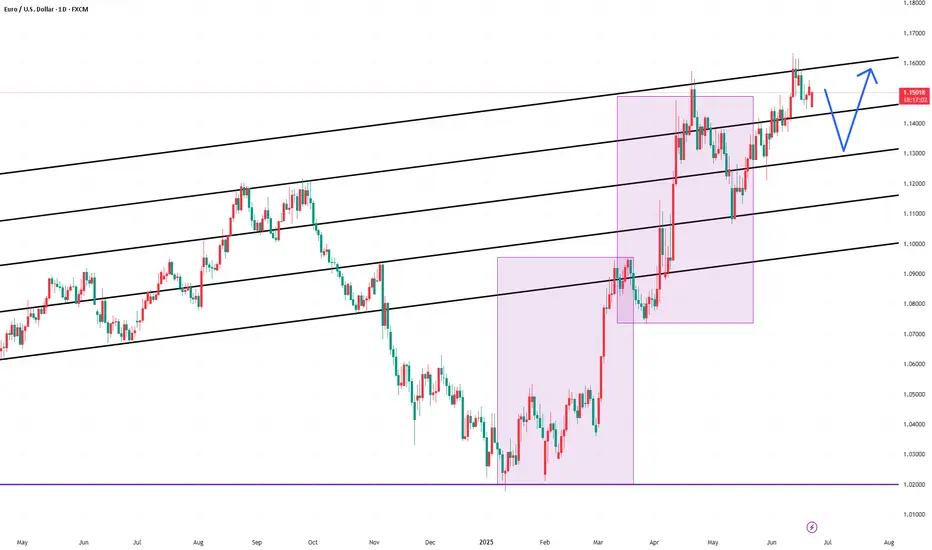
EURUSD POSSIBLE TRADE SETUP💶 Potential Trade Setup on EURUSD
Overview:
Since March, EURUSD has shown consistent bullish momentum, especially after breaking through the key 1.0600 supply zone.
The pair has maintained higher highs and higher lows, suggesting continued strength in the medium term.
That said, I am still quite anticipating for a possible continuation of the bullish momentum that started a long time ago, and moving forward, I will anticipate for a clear retest of the 50% fib at the 1.1425 region, then I go in for the kill.
Alternatively, there is a clear short opportunity, provided that, the bullish trendline is broken and the 1.1370 region is broken to the downside, this is a bit far a stretch, but it is in play. "IF" the DXY keeps the bullish momentum going.
🧭 Trading Plan:
✅ BUY Bias (Primary Plan):
Look for a retest of the 50% Fibonacci retracement zone around 1.1425. This aligns with the ongoing momentum on the 4H timeframe.
🔻 SELL Bias (Alternative Scenario):
If price breaks the bullish trendline and the 1.1370 support zone, a short opportunity opens up.
This is only valid if DXY continues to strengthen, shifting sentiment.
🎯 Targets & Risk Management: Targeting 1:2 R:R on both setups.
Ensure entries are backed by price action signals and confluences.
EURUSD M15 Forecast - Check related IdeaAs explained in previous post we are expecting a pull back down to our order block (H4) then a bullish reversal to retest last weeks highs (1.16) region. If price breaks and closes above the M15 supply zone will have to re-evaluate and potentially take a long position from a retest into a FVG.
