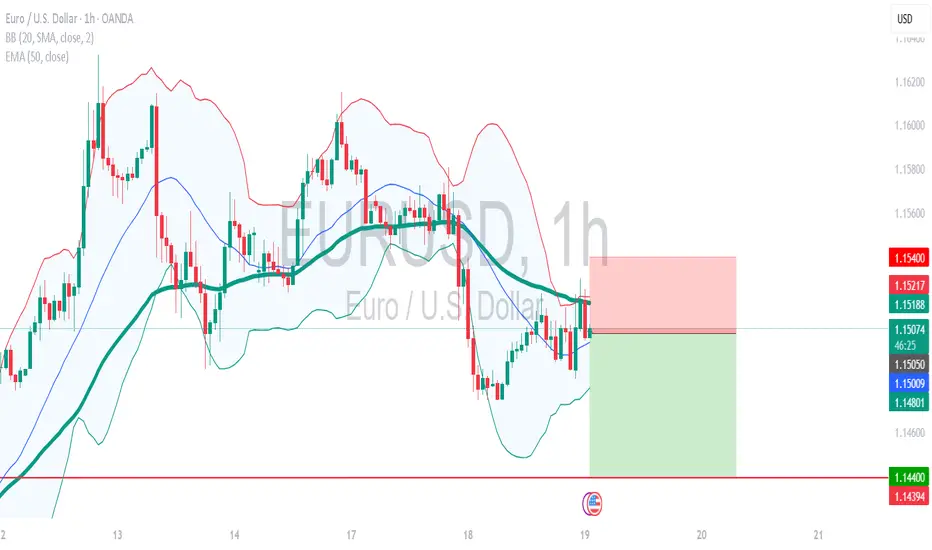
EUR/USD TrendlineEUR/USD broke below its ascending trendline and failed to reclaim resistance at 1.14876. The pair is now showing signs of bearish pressure as it trades below key resistance.
If selling pressure continues, the next supports to watch are 1.14616 and 1.14353.
A confirmed break above 1.15319 would invalidate this bearish outlook.
🔻 Resistance: 1.14876 – 1.15020
🔻 Support 1: 1.14616
🔻 Support 2: 1.14353
🔻 Stop Loss: 1.15319
🔻 Timeframe: 1H
🔻 Bias: Bearish, below 1.14876
This is a technical idea only – not financial advice.
EURUSDTDTM trade ideas

eur/usdTRADE 5 long term i belive we are still bearish but long term retracement has been in order and is still going but it has hit a key resistance level that i dont belive it to break if it does break it we will look for it to hit the surport line and then use it as a entry, as fgor now though a engulfing candle pattern happend and i do belive us to go in the bearish movment back down lets see where it takes us

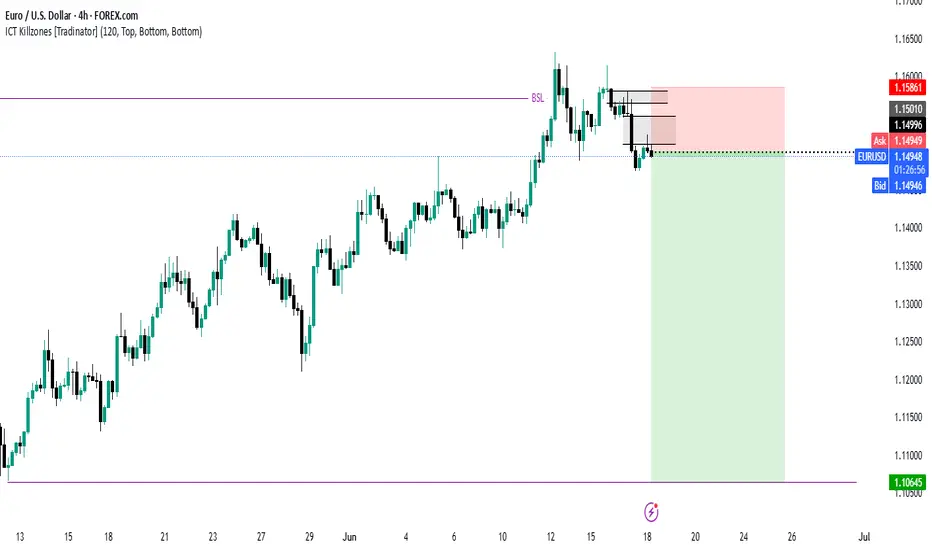
EURUSD - SHORT We have built up quite a lot of liquidity before our major supply zone.
Will give an update in the morning after seeing where price is at

Refined EURUSD setup Saw a 2H choch last night and today we've kept moving lower creating a new internal range.
Going to be waiting for price to shift bullish internally before trying to get into any longs. If I do not see any bullish intention then I will short following the 2H internal structure moving my SL where appropriate
I am still bullish on EURUSD but just waiting on confirmation before taking any longs

EURUSD - Getting Over-Bought?Hello TradingView Family / Fellow Traders. This is Richard, also known as theSignalyst.
📈EURUSD has been overall bullish trading within the rising channels marked in red and blue. However, it is currently retesting the upper bound of the channels.
Moreover, the orange zone is a major daily high.
🏹 Thus, the highlighted red circle is a strong area to look for sell setups as it is the intersection of the upper blue/red trendlines and daily high.
📚 As per my trading style:
As #EURUSD approaches the red circle zone, I will be looking for bearish reversal setups (like a double top pattern, trendline break , and so on...)
📚 Always follow your trading plan regarding entry, risk management, and trade management.
Good luck!
All Strategies Are Good; If Managed Properly!
~Rich
Disclosure: I am part of Trade Nation's Influencer program and receive a monthly fee for using their TradingView charts in my analysis.

Potential bullish rise?The Fiber (EUR/USD) is reacting off the pivot and could drop to the 1st support.
Pivot: 1.1525
1st Support: 1.1455
1st Resistance: 1.1569
Risk Warning:
Trading Forex and CFDs carries a high level of risk to your capital and you should only trade with money you can afford to lose. Trading Forex and CFDs may not be suitable for all investors, so please ensure that you fully understand the risks involved and seek independent advice if necessary.
Disclaimer:
The above opinions given constitute general market commentary, and do not constitute the opinion or advice of IC Markets or any form of personal or investment advice.
Any opinions, news, research, analyses, prices, other information, or links to third-party sites contained on this website are provided on an "as-is" basis, are intended only to be informative, is not an advice nor a recommendation, nor research, or a record of our trading prices, or an offer of, or solicitation for a transaction in any financial instrument and thus should not be treated as such. The information provided does not involve any specific investment objectives, financial situation and needs of any specific person who may receive it. Please be aware, that past performance is not a reliable indicator of future performance and/or results. Past Performance or Forward-looking scenarios based upon the reasonable beliefs of the third-party provider are not a guarantee of future performance. Actual results may differ materially from those anticipated in forward-looking or past performance statements. IC Markets makes no representation or warranty and assumes no liability as to the accuracy or completeness of the information provided, nor any loss arising from any investment based on a recommendation, forecast or any information supplied by any third-party.

Core Impact Logic of the Middle East Situation on EURUSD(I) Energy Transmission Chain: Oil Price Fluctuations → Eurozone Inflation and Economy
The escalation of the Middle East situation (the Iran - Israel conflict, risks in the Strait of Hormuz) directly impacts the global energy supply chain:
If the conflict expands to block the Strait of Hormuz (transports ~20% of global crude oil 🛢️), Brent crude has already soared from recent lows—spiking over 5% on June 17 amid tensions ⛽️. This pushes up imported inflation in the Eurozone.
As a net energy - importing region 🌍, prolonged high oil prices will squeeze corporate profits, suppress consumption, and drag Eurozone economic recovery (German/French manufacturing is acutely energy - cost - sensitive 🏭). This weakens the euro’s fundamental support.
(II) Geopolitical Safe - Haven Sentiment: The "Safe - Haven Balance" Between USD & EUR
Amid Middle East tensions, the US dollar’s traditional safe - haven status competes with Eurozone havens like German bonds 📈:
If the US (e.g., the Trump administration) intervenes militarily 💥, market fears of "America mired in war" rise. USD safe - haven demand may temporarily weaken ⬇️, and the euro benefits as funds shift 🔄
⚡️⚡️⚡️ EURUSD ⚡️⚡️⚡️
🚀 Buy@ 1.14500 - 1.15000
🚀 TP 1.15500 - 1.15600
Accurate signals are updated every day 📈 If you encounter any problems during trading, these signals can serve as your reliable guide 🧭 Feel free to refer to them! I sincerely hope they'll be of great help to you 🌟 👇

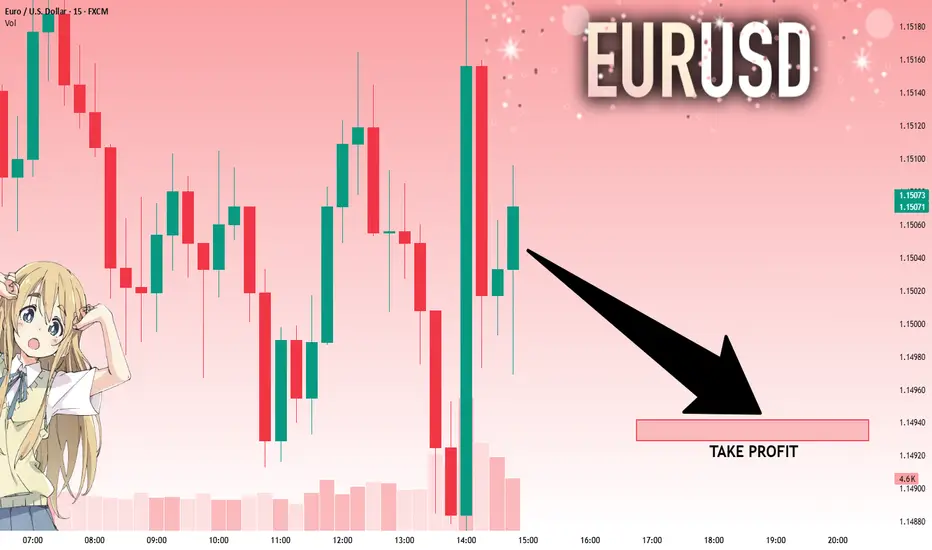
EURUSD Sell at current market priceBased on Daily/ H4 & H1 price action, current market price is the best price to enter sell in my opinion. I'm predicted that price will close below 1.15 level at the daily close.
This is my analysis, please calculate your own risk & reward.
Good Luck & happy trading.
Potential bearish drop?EUR/USD has rejected off the resistance level which is a pullback resistance that aligns with the 38.2% Fibonacci retracement and could drop from this level to our take profit.
Entry: 1.1524
Why we like it:
There is a pullback resistance level that align with the 38.2% Fibonacci retracement.
Stop loss: 1.1572
Why we like it:
There is a pullback resistance level that is slightly above the 61.8% Fibonacci retracement.
Take profit: 1.1452
Why we like it:
There is a pullback support level that lines up with the 127.2% Fibonacci extension.
Enjoying your TradingView experience? Review us!
Please be advised that the information presented on TradingView is provided to Vantage (‘Vantage Global Limited’, ‘we’) by a third-party provider (‘Everest Fortune Group’). Please be reminded that you are solely responsible for the trading decisions on your account. There is a very high degree of risk involved in trading. Any information and/or content is intended entirely for research, educational and informational purposes only and does not constitute investment or consultation advice or investment strategy. The information is not tailored to the investment needs of any specific person and therefore does not involve a consideration of any of the investment objectives, financial situation or needs of any viewer that may receive it. Kindly also note that past performance is not a reliable indicator of future results. Actual results may differ materially from those anticipated in forward-looking or past performance statements. We assume no liability as to the accuracy or completeness of any of the information and/or content provided herein and the Company cannot be held responsible for any omission, mistake nor for any loss or damage including without limitation to any loss of profit which may arise from reliance on any information supplied by Everest Fortune Group.

EUR/USD Holds Neutral Tone Ahead of Fed DecisionIn recent hours, the pair has shown limited movement of just 0.5%, reflecting a neutral bias as the market prepares for the upcoming Federal Reserve policy announcement. At this point, expectations suggest that the U.S. central bank will maintain a neutral stance, keeping the interest rate steady at 4.5% in the short term.
However, the key focus will be on the Fed’s accompanying statement, where the greatest uncertainty lies. If the tone remains hawkish, it's likely that demand for the U.S. dollar will strengthen, potentially adding downward pressure to EUR/USD.
Uptrend Remains Intact
Since early March, the pair has maintained a steady bullish trend, without any major corrections that would threaten the current structure. That said, the price has once again approached key resistance zones, but has yet to break through them in a sustained manner—opening the door for range-bound movement if this pattern continues.
Technical Indicators
RSI: The Relative Strength Index has begun to show lower highs, while EUR/USD continues to print higher highs. This bearish divergence indicates an imbalance in market forces, potentially signaling room for a short-term correction.
MACD: The MACD histogram is fluctuating near the zero line, reflecting a technically neutral environment. As long as this behavior continues, the pair may enter a consolidation phase, awaiting a clearer directional signal.
Key Levels to Watch:
1.15443 – Current Resistance: Marks the multi-month high. A sustained move above this level could revive the bullish momentum.
1.13177 – Intermediate Support: Aligns with a recent neutral zone and the 50-period moving average. It acts as a technical support in the event of short-term pullbacks.
1.10428 – Key Support: Represents the lowest level of recent months. A break below this area could trigger a stronger bearish bias, putting the current uptrend at risk.
Written by Julian Pineda, CFA – Market Analyst
Follow him at: @julianpineda25

long on EURUSD 15m*The content on this analysis is subject to change at any time without notice, and is provided for the sole purpose of assisting traders to make independent investment decisions.

EURUSD: 4H MA50 may start aggressive rally to 1.17900.EURUSD is bullish on its 1D technical outlook (RSI = 58.513, MACD = 0.005, ADX = 36.044), trading inside a Channel Up for the past 5 weeks. Yesterday it made contact with its 4H MA50, which is the most common level of support inside this pattern. Based on that, we find highly probable for the pair to start the new bullish wave. A HH on the 2.0 Fibonacci extension has been a common feature of this Channel Up, hence we are turning bullish here with TP = 1.17900.
## If you like our free content follow our profile to get more daily ideas. ##
## Comments and likes are greatly appreciated. ##

EURUSD: Move Down Expected! Short!
My dear friends,
Today we will analyse EURUSD together☺️
The price is near a wide key level
and the pair is approaching a significant decision level of 1.15043 Therefore, a strong bearish reaction here could determine the next move down.We will watch for a confirmation candle, and then target the next key level of 1.14942..Recommend Stop-loss is beyond the current level.
❤️Sending you lots of Love and Hugs❤️
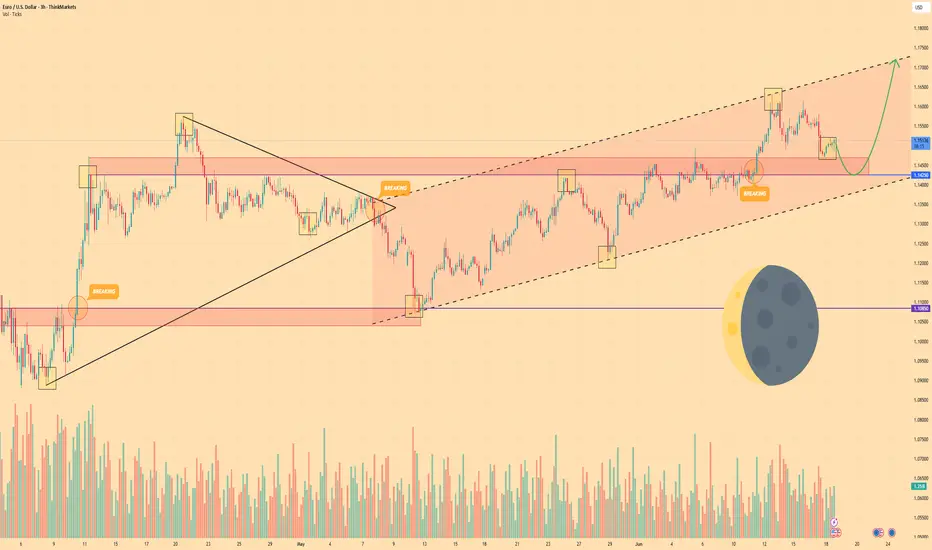
EURO - Price can correct to support area and then continue riseHi guys, this is my overview for EURUSD, feel free to check it and write your feedback in comments👊
Some days ago, price declined below support level and then started to grow inside a triangle pattern.
In this pattern, Euro broke $1.1085 level and even rose higher than $1.1425 level, but soon made a correction.
Later price exited from triangle and fell to support level, after which it started to grow inside rising channel.
Inside channel, price rose near support line and later reached $1.1425 level one more time, and some time traded close.
Soon, Euro broke this level and rose to resistance line of channel and then started to move down.
In my opinion, EUR can fall to support area and then continue to grow in channel to $1.1720 resistance line.
If this post is useful to you, you can support me with like/boost and advice in comments❤️
Disclaimer: As part of ThinkMarkets’ Influencer Program, I am sponsored to share and publish their charts in my analysis.
fomc or fomo? crash or rally? let us know! free transparentfomc or fomo?
crash or rally?
let us know!
free transparent no edit no delete
🐉We value full transparency. All wins and fails fully publicized, zero edit, zero delete, zero fakes.🐉
🐉Check out our socials for some nice insights.🐉
information created and published doesn't constitute investment advice!
NOT financial advice

EURUSD broke the Support level 1.14865👀 Possible scenario:
The euro (EUR) rose 0.07% on June 16, supported by safe-haven flows as geopolitical tensions escalated. The move followed U.S. calls for evacuation from Tehran after intensified Israeli strikes, with former President Trump blaming Iran for rejecting a nuclear deal.
Markets now eye the Fed’s upcoming policy decision and June 17’s U.S. Retail Sales report at 12:30 p.m. UTC. Strong data may push EURUSD down toward 1.15000, while weaker numbers could lift it back to 1.16300. Peace talk updates between Israel and Iran may also impact sentiment.
✅ Support and Resistance Levels
Now, the support level is located at 1.14740
Resistance level is located at 1.16330

EURUSD The Target Is UP! BUY!
My dear friends,
Please, find my technical outlook for EURUSD below:
The instrument tests an important psychological level 1.1504
Bias - Bullish
Technical Indicators: Supper Trend gives a precise Bullish signal, while Pivot Point HL predicts price changes and potential reversals in the market.
Target - 1.1544
About Used Indicators:
Super-trend indicator is more useful in trending markets where there are clear uptrends and downtrends in price.
Disclosure: I am part of Trade Nation's Influencer program and receive a monthly fee for using their TradingView charts in my analysis.
———————————
WISH YOU ALL LUCK

EUR/USD Potential Reversal from Resistance Zone –Bearish OutlookThe EUR/USD pair has been trading within a well-defined ascending channel for several weeks. Price recently tested a strong resistance zone near 1.15850 – 1.16000, which aligns with the upper boundary of the channel and a previously marked supply area.
Key observations:
The price action shows signs of rejection from the resistance zone with a potential double-top or fakeout pattern forming.
A projected bearish trajectory is marked, suggesting a possible break below the channel support.
Immediate bearish targets are set at key demand zones around 1.14500, 1.12500, and further down to 1.10500.
A large red arrow indicates the strong downside bias if the price confirms the breakdown.
Conclusion:
If EUR/USD fails to sustain above the 1.15850 resistance zone and breaks below the ascending channel, a strong bearish correction is anticipated. Traders should watch for confirmation of the breakdown before entering short positions.

EUR/USD.1h chart pattern.Based on My target EUR/USD 1H, the price has broken down from the ascending channel and formed a Double Top, confirming a bearish structure. Here's the analysis based on the marked zones:
Bearish Targets:
1. First Support / Target 1: Around 1.13500
This aligns with a previous structure level and is the first potential bounce zone.
2. Second Support / Target 2: Around 1.12000
This is a deeper support zone where price may head if the bearish momentum continues.
The structure also shows a clear CHoCH (Change of Character) which supports the downside bias.
Let me know if you want entry and stop-loss suggestions for this setup.

EUR/USD Long-Term Trade Idea (Bullish to Bearish Transition)The EUR/USD pair is expected to enter a bullish phase in the near term, potentially rising toward the key resistance zones between 1.18616 and 1.20143. These levels are likely to act as strong reversal points, where the pair could encounter significant selling pressure.
Once price reaches this zone, a bearish reversal is anticipated, aligning with broader technical signals and long-term resistance structures.
This setup presents an opportunity to ride the bullish momentum toward these levels, then potentially shift to a sell bias upon confirmation of rejection or reversal patterns within that zone.
“Buy the strength, sell the exhaustion — let the market come to you.”

EURUSD,GBPUSD and USDJPY Analysis todayHello traders, this is a complete multiple timeframe analysis of this pair. We see could find significant trading opportunities as per analysis upon price action confirmation we may take this trade. Smash the like button if you find value in this analysis and drop a comment if you have any questions or let me know which pair to cover in my next analysis.

Trading balanceTrading balance The price of the asset has rebounded from the balance zone. With the prospect of growth into the resistance zone.
