#AN014: Ursula von der Leyen No Confidence Motion, Market Crisis
Hello, I am Andrea Russo, a Forex trader and today I want to focus on an explosive news that has hit Brussels in the last 24 hours: the motion of no confidence against the President of the European Commission Ursula von der Leyen. I thank in advance the Official Broker Partner PEPPERSTONE for the support in carrying out this analysis.
The fact: Motion of No Confidence in the European Parliament
On July 1st, several MEPs from both conservative right and far left groups formally presented a motion of no confidence against Ursula von der Leyen, accusing her of: Non-transparent agreements with Emmanuel Macron, Opaque management of the new “Pact for Europe”, Conditioning of key appointments within the Commission and the Council and above all the violation of the democratic principle of balance of powers.
Although the motion does not seem to have the numbers to pass, it represents a direct attack on the political legitimacy of the outgoing president, just when she is trying to obtain a second term.
The suspicion is that this move is not so much to bring down von der Leyen, but to: Weaken her negotiating position, Force her to make political concessions and reopen the game on the strategic EU appointments 2024–2029.
This internal crisis comes at the worst possible time. A crisis of internal legitimacy in this context can undermine institutional stability and slow down all the economic reforms expected by the markets.
Impact on Forex
1. EUR under pressure
European political risk is back in the spotlight. Even if there was no immediate shock to the euro, institutional trading rooms are already pricing in more internal instability. This translates into:
Downward pressure on EUR/USD, especially if the motion receives more votes than expected (even if it does not pass).
EUR/CHF at risk of retracement, as the Swiss franc is seen as a safe haven currency in the event of EU institutional crises.
EUR/GBP with potential loss of strength, especially if London takes advantage of the crisis to relaunch bilateral agreements.
2. Push for safe haven currencies
JPY, USD and CHF have shown anomalous movements in the last few hours: political uncertainty is pushing traders to seek safe havens. The EUR/USD futures curve also shows a slight downward revaluation.
3. Upcoming events to monitor
The real threat will be if the number of votes in favor of the no-confidence motion exceeds 30–35% of Parliament → in that case, even if the motion does not pass, von der Leyen will be delegitimized.
The euro, in this case, could undergo a technical correction extended up to 1.0650, especially if accompanied by weak macro data.
Follow me, if you like, for other updates.
EURUSDTDTM trade ideas
EUR/USD sell limitThe pair's growth may stop at the level of 1.19
There is potential to go to 1.24, but it is impossible without a rollback

New rise in EURUSDYesterday, EURUSD continued its bullish movement, reaching 1,1807.
At current levels, all open buy positions should have their risk removed (e.g. stop loss at breakeven).
New buy entries are recommended only after a pullback with a favorable risk-reward setup.
Important news is expected later this week, which may lead to misleading price moves.
Reduce your risk and stay patient!

Prediction for EUR/USD Sell Setup (Short from 1.1825–1.1830)
Why?
• Price recently broke down from an ascending channel (seen on your TradingView screenshot).
• Confirmed lower high structure (bearish).
• Rejection from previous resistance near 1.1830 is likely.
• Fibonacci retracement shows 1.1830 aligns with key 78.6% reversal zone.
• DXY (USD Index) strength supports EUR/USD downside pressure.
• Clean downside liquidity resting near 1.1700 and possibly 1.1630.
⚠️ Buy Setup (Long from 1.1745–1.1750)
• Confidence: ⚪ 78%
• Why Lower?
• Although 1.1745 is solid support, it is being retested too frequently.
• Momentum is weakening.
• If price stalls and fails to bounce strongly off 1.1750, it risks collapsing to 1.1700 or lower.
• MACD/Volume divergence showing early bearish bias on M15/M30 timeframes.
⸻
🧠 Verdict:
• Short trade from 1.1825–1.1830 has higher probability based on current structure and momentum.
• This would be a sell-the-retest opportunity of the broken ascending channel.
• Hold to TP1 = 1.1745, and TP2 = 1.1700, with clean smart trail logic activated after TP1.
Then wait for reversal triggers and initiate sell long setup

Eurusd techinical analysis.Eurusd techinical analysis next move posibale at h1 time frame.not finchinal advice.

EU on 4HEU on 4H - pretending to be bullish. showing signs to go up but on lower timeframe it shows it can be scalped the way through

HelenP. I Euro will drop to trend line, after movement upHi folks today I'm prepared for you Euro analytics. If we look at the chart, we can see that EURUSD has been moving in a stable upward trend, supported by a clear ascending trend line. Each time the price approached this line, it rebounded and continued to grow, respecting the bullish structure. After the recent breakout from the support zone around 1.1500, the market made a strong impulse to the upside and reached a local high. Now, the momentum seems to be slowing down, which opens the possibility for a corrective movement. Given this setup, I expect that the price could first make a small upward push to trap late buyers, and then turn around to begin a decline. The trend line remains a critical technical level, and I anticipate the price will revisit it soon. For this reason, I’ve placed my goal at 1.1575 points — this area aligns with the trend line and can serve as the next support if a pullback occurs. As long as this level holds, the market remains in a bullish structure, but a correction seems likely before further growth. If you like my analytics you may support me with your like/comment.
Disclaimer: As part of ThinkMarkets’ Influencer Program, I am sponsored to share and publish their charts in my analysis.

Lingrid | EURUSD Bullish Trend ContinuesFX:EURUSD is holding a bullish structure inside an upward channel after bouncing from the 1.1670 demand zone. The current retracement appears corrective, and buyers may step in again near the confluence of the trendline and horizontal support. If confirmed, the price is expected to push toward the 1.1885 resistance and the upper channel target at 1.1900.
📈 Key Levels
Buy zone: 1.1650–1.1680 (trendline + key support)
Sell trigger: break below 1.1600
Target: 1.1885 – 1.1900 zone
Buy trigger: bullish reversal candle near 1.1700
💡 Risks
Failure to hold trendline support could lead to deeper retracement
1.1885 may cap upside if momentum fades
Bearish divergence could emerge if price surges too fast
If this idea resonates with you or you have your own opinion, traders, hit the comments. I’m excited to read your thoughts!

EURUSD ADP Report (Today):
-33,000 jobs in manufacturing & goods-producing sectors
Overall ADP employment report: weaker than expected
➡️ Normally, that would imply a soft NFP tomorrow.
⸻
So Why Are People Saying NFP Will Be “Hot”?
There are 3 key reasons why some traders are still expecting a strong NFP despite a weak ADP:
⸻
1. ADP ≠ NFP
• ADP is NOT a reliable predictor of NFP.
• Historically, ADP and NFP often diverge widely — especially in months with:
• Revisions
• Government hiring
• Seasonal distortions
Example: In several past months, ADP missed badly while NFP was strong.
⸻
2. Other Labor Indicators Are Still Strong
• The JOLTS report this week showed job openings holding up
• Weekly jobless claims remain near historic lows
• Wages are still growing at 4%+
So markets may believe the labor market is stronger than ADP suggests.
⸻
3. Positioning & Speculation
• Traders often “fade” the ADP number, expecting NFP to surprise the opposite way.
• Some are just betting on momentum or trying to trap weak hands.

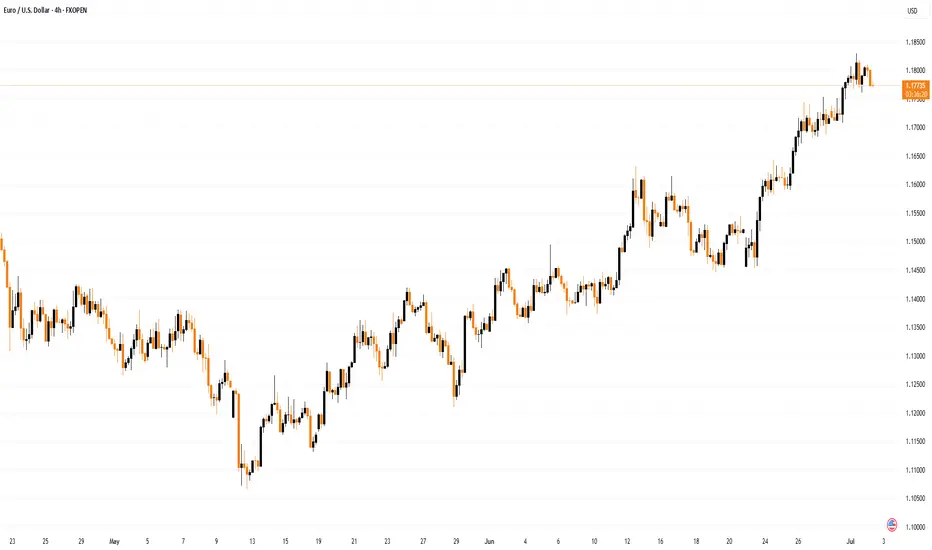
EUR/USD Analysis: Rally May Be Under ThreatEUR/USD Analysis: Rally May Be Under Threat
The euro has appreciated by approximately 15% against the US dollar this year, as confidence in the United States continues to wane. As ECB Chief Economist Philip Lane noted in an interview at CNBC: “There is a degree of reorientation by global investors towards the euro.”
At the same time, officials at the European Central Bank have expressed concern that the rapid strengthening of the euro could undermine efforts to stabilise inflation at 2%. They warn that a move above $1.20 may pose risks for inflation and the competitiveness of export-oriented firms — an issue raised during the ECB’s ongoing ECB Forum on Central Banking in Portugal.
Could EUR/USD Reach the $1.20 Level?
From a technical analysis perspective, EUR/USD is showing bearish signals:
→ If the early April rally (coinciding with Trump’s announcement of new tariffs) is taken as the initial impulse wave A→B, and the May low is interpreted as the end of the B→C corrective move, then, according to Fibonacci Extensions, the pair has now risen to a key resistance zone around 1.1850 (as indicated by the arrow on the chart).
→ In addition, the RSI indicator signals strong overbought conditions, while the price is hovering near the upper boundary of the ascending channel — a level that typically acts as resistance.
Given these factors, we could assume that EUR/USD may be in a vulnerable position, potentially facing a short-term correction — possibly towards the lower boundary of the channel, reinforced by support at the 1.1620 level. However, this does not negate the longer-term bullish outlook for the euro amid prevailing fundamental conditions.
This article represents the opinion of the Companies operating under the FXOpen brand only. It is not to be construed as an offer, solicitation, or recommendation with respect to products and services provided by the Companies operating under the FXOpen brand, nor is it to be considered financial advice.
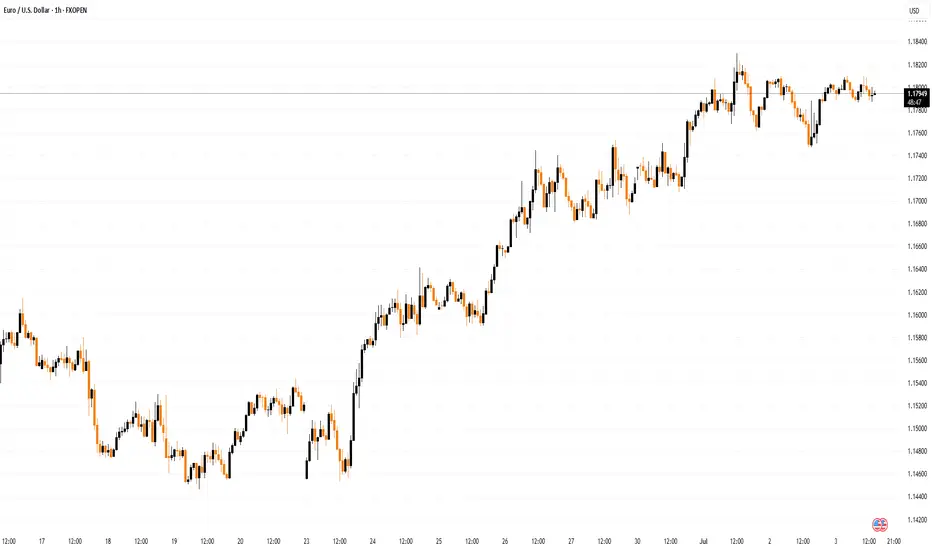
EUR/USD Rallies on Broad Dollar WeaknessEUR/USD Rallies on Broad Dollar Weakness
EUR/USD started a fresh increase above the 1.1750 resistance.
Important Takeaways for EUR/USD Analysis Today
- The Euro started a decent increase from the 1.1600 zone against the US Dollar.
- There is a connecting bullish trend line forming with support near 1.1770 on the hourly chart of EUR/USD at FXOpen.
EUR/USD Technical Analysis
On the hourly chart of EUR/USD at FXOpen, the pair started a fresh increase from the 1.1600 zone. The Euro cleared the 1.1650 resistance to move into a bullish zone against the US Dollar.
The bulls pushed the pair above the 50-hour simple moving average and 1.1750. Finally, the pair tested the 1.1830 resistance. A high was formed near 1.1829 and the pair is now consolidating gains above the 23.6% Fib retracement level of the upward wave from the 1.1590 swing low to the 1.1830 high.
Immediate support on the downside is near a connecting bullish trend line at 1.1770. The next major support is the 1.1710 level. A downside break below the 1.1710 support could send the pair toward the 1.1680 level and the 61.8% Fib retracement level of the upward wave from the 1.1590 swing low to the 1.1830 high.
Any more losses might send the pair into a bearish zone toward 1.1645. Immediate resistance on the EUR/USD chart is near the 1.1830 zone. The first major resistance is near the 1.1850 level. An upside break above the 1.1850 level might send the pair toward the 1.1920 resistance.
The next major resistance is near the 1.1950 level. Any more gains might open the doors for a move toward the 1.2000 level.
This article represents the opinion of the Companies operating under the FXOpen brand only. It is not to be construed as an offer, solicitation, or recommendation with respect to products and services provided by the Companies operating under the FXOpen brand, nor is it to be considered financial advice.
EURUSD 30Min Engaged ( Bearish Entry Detected )➕ Objective: Precision Volume Execution
Time Frame: 30-Minute Warfare
Entry Protocol: Only after volume-verified breakout
🩸 Bearish Wave Coming From : 1.17750
➗ Hanzo Protocol: Volume-Tiered Entry Authority
➕ Zone Activated: Dynamic market pressure detected.
The level isn’t just price — it’s a memory of where they moved size.
Volume is rising beneath the surface — not noise, but preparation.
🔥 Tactical Note:
We wait for the energy signature — when volume betrays intention.
The trap gets set. The weak follow. We execute.
EURUSD 30Min Engaged ( Bullish Entry Detected )


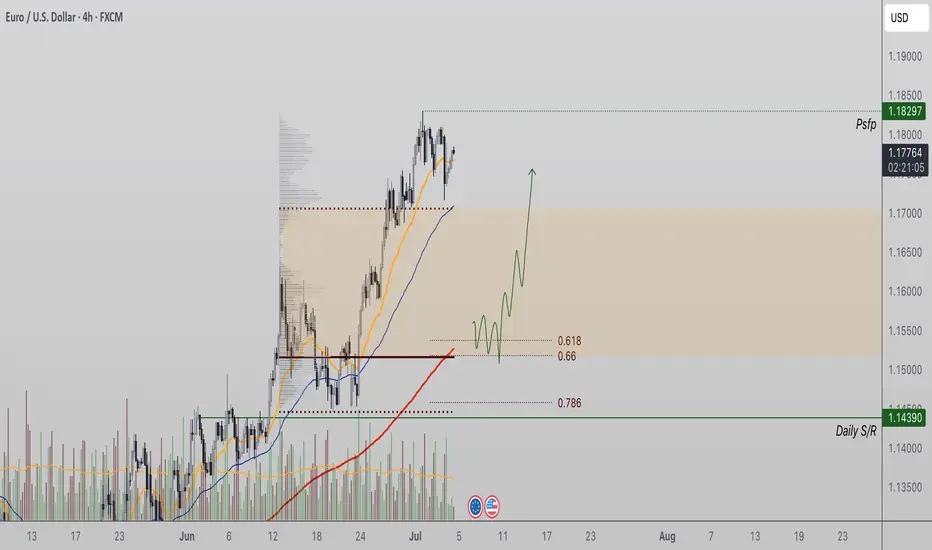
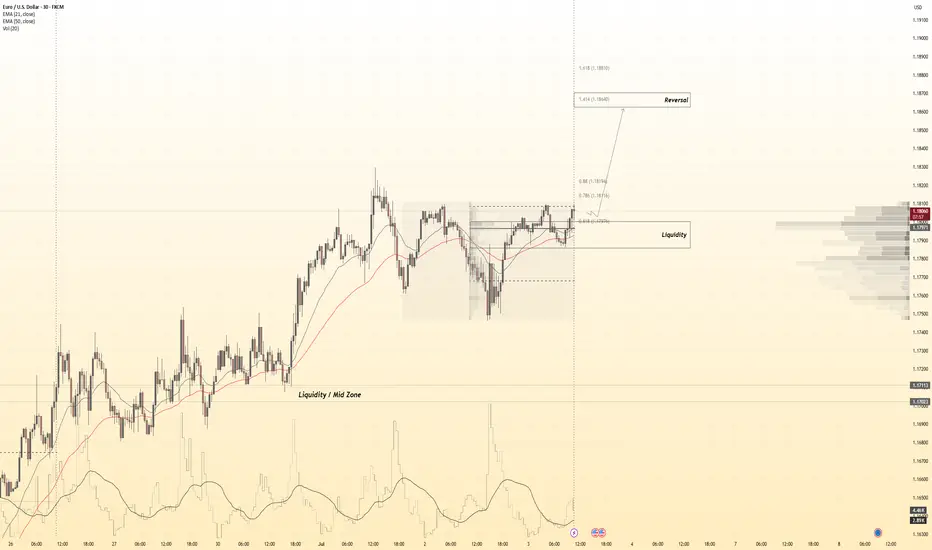
EURUSD Healthy Correction Could Set Up Next Bullish LegEURUSD continues to trade within a strong bullish structure, marked by a consistent sequence of higher highs and higher lows across multiple timeframes. The pair recently tested a significant resistance zone around $1.18, which acted as a swing high and has since been defended by sellers. This rejection has led to a short-term pause in the uptrend, with price now consolidating around the value area high, a critical area on the volume profile that typically precedes either continuation or a corrective move.
From a technical standpoint, a pullback from the current level would be healthy, especially given the extended nature of the recent move. The ideal retracement zone lies between the 0.618 Fibonacci level, the point of control (POC), and the 200-period moving average — all of which converge to form a strong demand region. A revisit of this zone would offer a textbook opportunity for the formation of a higher low, which would preserve the existing bullish structure and invite renewed buying interest.
A correction into this region would not indicate weakness but rather reinforce the strength of the trend. It allows for momentum reset and offers a more sustainable base for the next potential move higher, potentially targeting a breakout above the $1.18 swing high.
As long as price action remains above the previous higher low and these key support zones hold, the bullish bias remains intact, and traders may look for long opportunities on signs of a reversal within the corrective zone.
EUR/USD Analysis: US Dollar Strengthens at the Start of the WeekEUR/USD Analysis: US Dollar Strengthens at the Start of the Week
On 2 July, on the EUR/USD chart, we noted that the rally—during which the pair had gained more than 6% since mid-May—was under threat, citing several technical signals, including:
→ proximity of the price to the upper boundary of the ascending channel;
→ overbought conditions on the RSI indicator;
→ nearby resistance from the Fibonacci Extension levels, around 1.18500.
Trading at the start of the week points to renewed US dollar strength. This became particularly evident with the opening of the European session, which triggered a decline in EUR/USD to the 1.17500 area.
It is reasonable to assume that the dollar’s strength against the euro is linked to early-week positioning by traders, who are anticipating news regarding US trade agreements.
According to Reuters, the United States is close to finalising several trade deals in the coming days and is expected to notify 12 other countries today about higher tariffs.
EUR/USD Technical Chart Analysis
The ascending channel established last week remains in play, with the following developments:
→ a dashed midline within the upper half of the channel has been breached by bearish pressure (as indicated by the arrow);
→ a series of lower highs in recent sessions suggests the formation of a downward trajectory, within which the price could move towards the channel median—or potentially test its lower boundary.
P.S. In the longer term, analysts at Morgan Stanley maintain a bullish outlook, forecasting that EUR/USD could rise to 1.2700 by the end of 2027.
This article represents the opinion of the Companies operating under the FXOpen brand only. It is not to be construed as an offer, solicitation, or recommendation with respect to products and services provided by the Companies operating under the FXOpen brand, nor is it to be considered financial advice.

Do You Have a Trading Edge?A Practical Guide to Figuring Out if What You’re Doing Is Actually Working
There comes a point in every trader’s journey when you stop asking “what indicator should I use” and start asking something much more important.
Is what I’m doing actually working?
It’s an honest question. When the P&L has been chopping sideways or dipping red for weeks, it’s easy to feel stuck. Maybe you’ve been grinding for months, jumping from one setup to another, but still not seeing consistent progress. Before you give up or double down, it’s worth stepping back and looking at the one thing that matters most.
Do you have an edge?
What Is a Trading Edge, Really?
A trading edge isn’t about being right all the time. It isn’t some secret indicator or a feeling in your gut. It’s a cold, hard number.
Your edge is the amount of money you can expect to make or lose on average every time you place a trade. If the number is positive, you’re on the right side of probability. If it’s negative, then no amount of motivation or mindset work will stop the account from bleeding over time.
Thankfully, there’s a simple formula that tells you exactly where you stand.
The Formula: No Hype, Just Maths
Edge per trade = (Average Win × Win Rate) − (Average Loss × Loss Rate)
Or more simply:
Edge = W × R – L × (1−R)
Where:
• W is your average winning trade in pounds
• L is your average losing trade (as a positive number)
• R is your win rate, written as a decimal (so 55% becomes 0.55)
This is your trading edge. It’s not a concept. It’s a number. And it either works or it doesn’t.
Let’s Put It Into Practice
Say you win 45% of the time. Your average winning trade makes £180. Your average losing trade costs £120. Plug the numbers in.
Edge = £180 × 0.45 minus £120 × 0.55
Edge = £81 minus £66
Edge = £15
That £15 is your expected value per trade. So if you take 100 trades following that same pattern, you’d expect to make £1,500 before costs. That’s the kind of maths you want working in your favour. It’s not glamorous. It’s not loud. But it’s sustainable.
What if the Edge Is Negative?
This is where a lot of traders lose heart. But it’s actually good news. If the formula tells you the edge isn’t there, you can stop guessing. It means you’ve identified the problem.
A negative edge just tells you that, on balance, either:
• you’re winning too infrequently
• your losses are too large
• your winners aren’t big enough
And every one of those can be adjusted. This isn’t about tearing down your whole system. Often, a small shift in one variable is all it takes to turn a negative edge into a positive one.
Three Ways to Nudge the Numbers in Your Favour
1. Improve the win rate slightly
Look for trades with more confluence. Stick to clearer trends. Avoid taking marginal setups during unpredictable conditions. You don’t need a huge jump, even going from 40% to 47% can have a big impact.
2. Increase the size of your winners
Let trades run a little longer when the conditions are right. Take partials if it helps your mindset, but keep a portion on to capture the extended move. Most traders cut profits too early and let losers drift too far.
3. Tighten up the losses
Use hard stops. Respect them. Review your biggest losing trades and ask yourself if they really had to be that big. Often they didn’t. The goal is to keep losses small and repeatable, not devastating and unpredictable.
A Note on Sample Size
Five or ten trades won’t give you a reliable read on your edge. You need a bigger pool. Ideally 50 to 100 trades minimum. Patterns emerge over time, not in the heat of one session.
A strong edge can go through losing streaks. A poor strategy can get lucky for a while. But when you track your numbers over enough trades, the truth becomes very clear.
You’re Probably Closer Than You Think
If you’ve never done this calculation before, don’t feel behind. Most retail traders never actually work out their edge. They focus on indicators, entry techniques, or mindset work without ever stopping to ask if the numbers stack up.
But once you do the maths, things start to change. You stop judging yourself by your last trade and start thinking in averages. You stop chasing every setup and start focusing on quality. You stop worrying about being right, and start focusing on being consistent.
That’s what separates hobbyists from professionals. The numbers are the difference.
Summary:
If your edge is negative, you now know where to look. If it’s positive, even just slightly, you’ve got something worth building on. Either way, the path forward is clearer.
Trading is hard, no question. But it’s not magic. It’s probability, risk control and discipline applied consistently. And it all starts with understanding the maths behind what you’re doing.
So next time you’re questioning whether your system is any good, don’t ask how it feels. Run the numbers.
Do you have a trading edge?
If yes, protect it. If not, now you know what to fix.
Disclaimer: This is for information and learning purposes only. The information provided does not constitute investment advice nor take into account the individual financial circumstances or objectives of any investor. Any information that may be provided relating to past performance is not a reliable indicator of future results or performance. Social media channels are not relevant for UK residents.
Spread bets and CFDs are complex instruments and come with a high risk of losing money rapidly due to leverage. 85.24% of retail investor accounts lose money when trading spread bets and CFDs with this provider. You should consider whether you understand how spread bets and CFDs work and whether you can afford to take the high risk of losing your money.

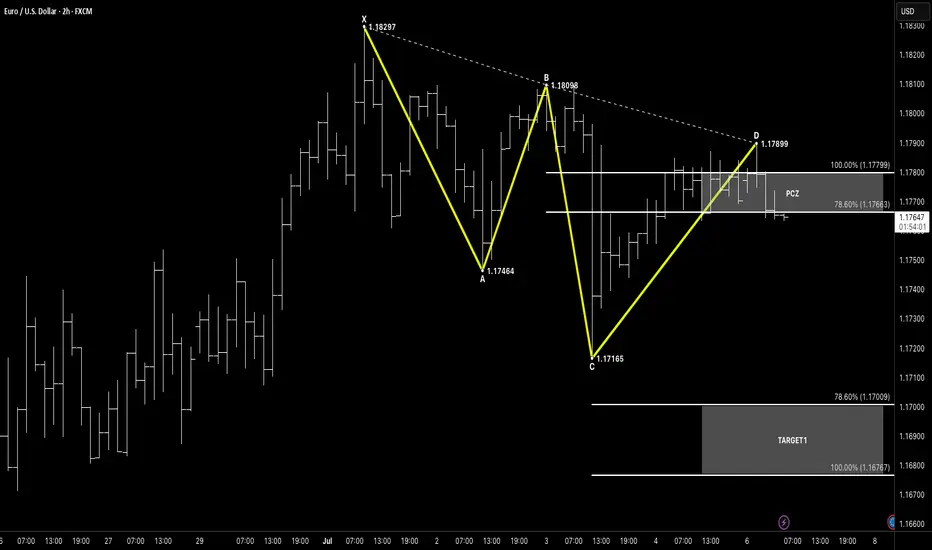
121Hello awesome traders! 👑✨
Let’s kick off the week with a EUR/USD 2-Hour chart — spotting a high-probability 121 Bearish reversal to ride lower.
🧠 Setup Breakdown
Pattern Type: 121 Bearish Reversal
X → A: Downtrend from 1.18297 → 1.17464
A → B: Retracement up to 1.18098
B → C: Drop to 1.17165
C → D: Leg up into 1.17899 completing the 121
PRZ / PCZ: Confluence of 78.6% & 100% of BC at 1.17663–1.17799
✅ Why This Works
Clean 121 structure with two distinct retracements
Amplitude Symmetry: AB ≈ CD in price distance (~130 pips each)
Horizontal resistance from the prior B-swing lines up with PCZ
⚔️ Entry & Risk Management
Entry Zone: Short within 1.1766–1.1780 (PCZ)
Stop-Loss: Above swing high D at 1.17899, 5–10 pips higher (~1.1805)
Risk: ≤ 1–2 % of account per trade
🎯 Target Zones
Target Zone 1: 78.6%–100% retracement of C→D → 1.17009–1.16767
Target Zone 2: 127.2%–161.8% extension of C→D → 1.16459–1.16067
🔍 Confirmation & Invalid
Candlestick Rejection: Watch for bearish pin-bar or engulfing at PCZ
Structure Break: Close back below C→D trendline adds conviction
Invalidation: A decisive close above 1.1805 (above PCZ & D) negates the setup
💡 Keep It Simple:
Pattern → Spot 121 Bearish
PCZ → Wait for 78.6–100 % retracement of BC
Trigger → Bearish price action at D
Continuation → Ride the move into your Target Zones
🔔 Monitor ECB speak and risk-sentiment for broader catalysts.
Wishing everyone a profitable week ahead — stay disciplined, manage risk, and let structure lead, not emotions! 🚀
EURUSD 30Min Engaged ( Bullish Entry Detected )————-
➕ Objective: Precision Volume Execution
Time Frame: 30-Minute Warfare
Entry Protocol: Only after volume-verified breakout
🩸 Bullish Wave Coming From : 1.18050
➗ Hanzo Protocol: Volume-Tiered Entry Authority
➕ Zone Activated: Dynamic market pressure detected.
The level isn’t just price — it’s a memory of where they moved size.
Volume is rising beneath the surface — not noise, but preparation.
🔥 Tactical Note:
We wait for the energy signature — when volume betrays intention.
The trap gets set. The weak follow. We execute.
EUR/USD – Potential Bearish Reversal AheadAnalysis Overview:
EUR/USD has shown a strong bullish structure recently, but price is currently near a key resistance zone around 1.1780, which may act as a reversal point. The chart also shows an extended wave structure, signaling possible exhaustion of buying pressure.
Bearish Setup Expectations:
If the price fails to break above 1.1780 convincingly and shows bearish confirmation (e.g. a strong bearish engulfing candle or RSI divergence), we may see a reversal toward lower support levels.
Key Support Levels (Targets):
TP1: 1.14465
TP2: 1.13329
TP3: 1.12064
TP4: 1.10000
Possible Entry: Near 1.1770 – 1.1785 (on bearish confirmation)
Stop Loss: Above 1.1810 (structure invalidation)
Technical Confluences:
Potential Double Top or Rising Wedge pattern
Price at historical resistance
Overbought RSI zones may support the reversal
---
📌 Note: Always wait for confirmation before entering. Use proper risk management and follow your trading plan strictly.

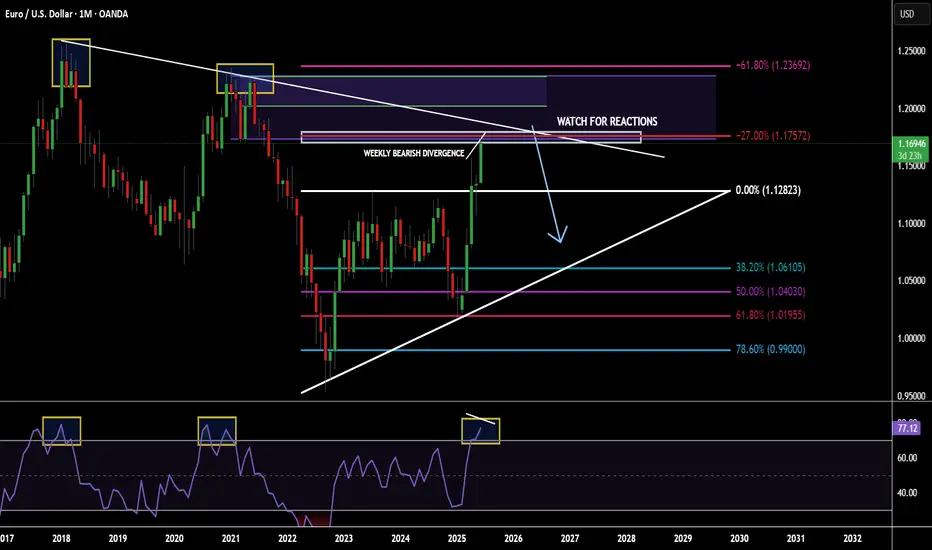
POTENTIAL EURUSD SHORT OPPORTUNITY...POSITION TRADEHello hello TradingView family! Hope you guys are doing amazingly well! Just wanted to come on here and make another post for a potential longer term opportunity I am seeing on the major currency pair EURUSD. So put your seat belts on and let's dive in!!
OK so I'm going to keep this very very simple. Not because I don't want to go in depth but because my trading is very simple and I'm just going to give it to you straight. So here are the points
1. Price is @ monthly supply
2. Price has made new highs & sitting at a monthly fib extension
3. Monthly RSI overbought conditions
4. Weekly has bearish divergence forming
5. Weekly/Daily buyer is slowing down
Make sense? If not..then I know you will figure it out. Watch for price to potentially poke a little higher but nice confluences for a fall in price. Appreciate you all!
Impulse completed?EUR/USD maintains its bullish trend intact after a sharp rally last week. The pair keeps consolidating gains as the 4-hour Relative Strength Index pulls back from overbought levels and price action is constrained within a 70-pip range, right below a nearly four-year high at 1.1750.
Today, price hit upside target at the 161.8% Fibonacci extension level of the June 10-12 rally at 1.1795. I Think we might see a correction for the eurusd as the impulse seems to be completed.

EURUSD - Bears Preparing a Bearish Shift in StructureEURUSD has been pushing higher over the past few sessions, reaching into a key liquidity zone. On the 4H chart, we’ve now seen a very clean sweep of previous swing highs, which completes the first step needed for a potential reversal. This sweep acted as a buy-side liquidity run, taking out resting orders before showing early signs of exhaustion.
Liquidity Sweep and Structural Confirmation
The sweep of the highs marked a potential turning point, but for this setup to gain validity, we need to see confirmation through structure. That confirmation would come from a decisive 4H close below the red mitigation zone. This area aligns with a small demand that previously pushed price up, so a close below would mark a clean break in bullish order flow and confirm a bearish structure shift.
Downside Expectations and Key Levels
If the structure shift is confirmed, I expect EURUSD to move lower toward the fair value gap around 1.14600 to 1.14400. This FVG could provide temporary support, and we may see some reaction there. However, due to the size of the imbalance and the overall context, price has the potential to continue lower through that level.
Interim Reactions and Minor Scenarios
There is a chance price reacts to the FVG and pulls back before continuing lower. Any bounce from this zone would likely be short-term unless it leads to a clear market structure shift back to the upside. If price fails to hold above the FVG, the deeper support zone below near 1.13800 would become the next logical target.
Trigger Point for Bearish Bias
The most important trigger for this trade is a 4H close below the red box. Without that, the bullish structure technically remains intact. Once that level is broken, I will consider the sweep and break combination a completed reversal signal, targeting the FVG and beyond.
Conclusion
This setup follows a textbook liquidity grab followed by a potential structure break. Patience is key here, as I’m waiting for confirmation before taking action. If price closes below the red zone, I’ll be actively looking for shorts targeting the 1.14600 region, with room to extend lower depending on how price reacts at the FVG.
Disclosure: I am part of Trade Nation's Influencer program and receive a monthly fee for using their TradingView charts in my analysis.
___________________________________
Thanks for your support!
If you found this idea helpful or learned something new, drop a like 👍 and leave a comment, I’d love to hear your thoughts! 🚀

Short for the next swing low.Is EURO bull run gonna end?
ECB vs Fed Policy Paths
Federal Reserve officials are divided but generally more cautious about cutting rates soon. In mid-June the Fed held rates steady at 4.25–4.50% and forecast only two 25bp cuts in 2025
Chair Powell warned of “meaningful” inflation coming from U.S. tariffs
implying cuts may be delayed. Indeed, Fed Governor Bowman recently said she would support a rate cut “as soon as” the July meeting if inflation remains contained
highlighting internal debate. In contrast, the ECB has already started lowering rates. After its June 5 decision to cut 25bp to 2.0%, Goldman Sachs analysts see two more ECB cuts (bringing deposit rates toward ~1.5% by year-end)
As one strategist noted, “market pricing now shows a big gap between ECB and Fed rate cut expectations…Fed remains hamstrung by inflation,” keeping U.S. yields relatively high
a stickier Fed (fewer cuts) versus a more dovish ECB (more cuts) would favor USD strength and EUR weakness.
Geopolitical and Eurozone Risks
Europe’s two largest economies face looming elections and weak coalitions. Fitch Solutions notes “Germany is set to hold early elections in February 2025” complicated by far-right gains, while France “is currently being governed by a weak coalition” with rising debt risks
Such instability can undermine confidence in the euro.
Slow growth: Eurozone growth is sluggish. After a 0.2% contraction in Germany, Fitch warns that “Germany and Italy weighing on aggregate growth forecasts” in 2025
Anemic output makes the euro vulnerable, especially if the U.S. economy outperforms.
Labor market tightening: Euro-area unemployment is low (~6.3%), but conditions are “unjustifiably tight” given the weak economy
Any economic slowdown could quickly raise Eurozone joblessness, pressuring the euro.
Trade/tariff risks: A return to U.S. protectionism (e.g. renewed tariffs) could hit European exporters. Trump presidency could strain EU–US relations and dent demand for Eurozone exports
Even talk of fresh tariffs tends to boost the safe-haven dollar over the euro.
