Caught EU clean today. Waited patiently for that textbook 30M liquidity sweep, then stalked the LTF entry like a sniper. No rushing—just letting price do its thing until it stopped running. Then we pounced. 💥
Execution was sharp. Setup was smooth.
This is how we trade over here—precision, patience, and purpose.
📉 Stay tuned for the breakdown and upcoming analysis.
Would love to hear y’all thoughts on this one 👀👇
#SMC #Forex #InducementKing #EUTrade #SmartMoneyFlow
Bless Trading!
EURUSDTDTM trade ideas

Long run……📈 EURUSD 4H – From Long to Short: Managing the Full Move
This chart shows the power of the ELFIEDT RSI + Reversion Strategy not only in identifying strong short-term reversion trades but also in guiding traders through longer-term swing positions when holding a trade from exhaustion signal to exhaustion signal.
⸻
🟢 Buy Signal – Early Reversal Opportunity
Back on the left of the chart, the strategy printed an “UP” signal after a heavy selloff:
• Price had broken well below the lower volatility band
• RSI entered deeply oversold territory
• A strong bounce followed, confirming the shift in momentum
This setup offered a great opportunity for position traders to enter early on a larger move — and it played out exceptionally well.
⸻
🔺 Trend Continuation Through Higher Lows
After the buy signal, price continued to climb with higher highs and higher lows, allowing the position to be managed with:
• A trailing stop-loss below swing lows
• Partial profit-taking along the way
• Or simply holding for a strategy-based exit
⸻
🔻 Sell Signal – Opposite Reversion Appears
Eventually, the price topped out after a steep rally, and the strategy printed a clear “DOWN” signal:
• Price had pushed far above the upper deviation band
• RSI signaled overbought exhaustion
• A pullback quickly followed
This offered two strategic options for long-term traders:
1. Close the long position fully, locking in gains from the original buy signal
2. Flip the bias and enter a short reversion trade, following the same principles in reverse
⸻
📌 Trade Management Commentary:
• Holding from “UP” to “DOWN” would have captured the full reversion-to-reversion swing — a large, clean multi-week trend
• No need to predict tops or bottoms — just follow the signals and let the market guide you
• For traders who prefer swing or position strategies, using the ELFIEDT signal pairs (buy → sell or sell → buy) can offer a rule-based exit system tied directly to volatility and momentum extremes
⸻
🎯 Takeaway:
The ELFIEDT RSI + Reversion Strategy is not just for scalps or intraday setups — it can also support longer-term trend plays, providing clear visual signals that help eliminate emotional exits and allow trades to mature naturally.

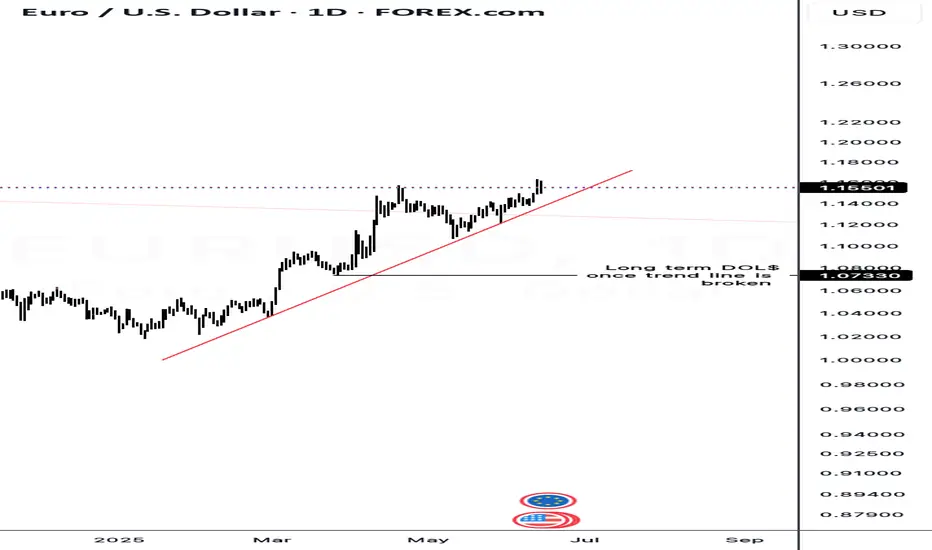
Waiting liquidity once trend line is broken.Once the daily trend line is broken, price will move to take out the long term sell side liquidity waiting below to continue the uptrend.
EURUSD Set To Fall! SELL!
My dear friends,
EURUSD looks like it will make a good move, and here are the details:
The market is trading on 1.1596 pivot level.
Bias - Bearish
Technical Indicators: Supper Trend generates a clear short signal while Pivot Point HL is currently determining the overall Bearish trend of the market.
Goal - 1.1533
About Used Indicators:
Pivot points are a great way to identify areas of support and resistance, but they work best when combined with other kinds of technical analysis
Disclosure: I am part of Trade Nation's Influencer program and receive a monthly fee for using their TradingView charts in my analysis.
———————————
WISH YOU ALL LUCK

EURUSD Wave Analysis – 13 June 2025- EURUSD reversed from the resistance level 1.1575
- Likely to fall to support level 1.1400
EURUSD currency pair recently reversed down from the resistance level 1.1575, which stopped the previous sharp impulse wave (1) in the middle of April.
The resistance zone near the resistance level 1.1575 was strengthened by the upper daily Bollinger Band.
EURUSD currency pair can be expected to fall to the next support level 1.1400 (which stopped the previous correction ii).

EURUSD, GBPUSD - Outlook for next weekEURUSD - So we have 2x 4 hour POI's (Points Of Interest). Will be looking at potential reversals at both POI's however, within the first POI we have an area of potential liquidity that could look to be taken before we make out move back to the upside.
Therefor, the second POI could look to be our more solid option for our buying options at some point next week.
GBPUSD - This pair looks to be building its liquidity now for potential trades to the upside as today on the lower TF's it was setting quite a few traps for the potential longs and the traders that would have been shorting the breaks below structure to the left.
If you have any questions for me please do let me know

EURUSD LONG SCAPLE5 Minutes timeframe
Entry:1.15182
Stoploss:1.15006
Takeprofit:1.16148
Entry model we identified a 5 minutes BISI and market is currently in the distribution phase we anticipate a reversal to the accumilation phase not financial advice but i risked 0.50% on this trade as im waiting for NQ! to present

EURUSD entry long 1h*The content on this analysis is subject to change at any time without notice, and is provided for the sole purpose of assisting traders to make independent investment decisions.

EURUSD – Follow-Up UpdateEURUSD traded above the 1.1573 level on Thursday, marking a second break to the upside following the earlier trend-changing pattern — a potential sign of bullish continuation.
However, on the 1H/M15 chart, we've observed a minor ABC corrective decline (pullback). We’re now watching for a break below 1.1511, which could signal the start of a short-term bearish move.
🎯 Short-Term Target:
The next key level is 1.1214, a weekly structural support zone and the low of the previous trend-changing pattern.
📌 Key Zones to Watch:
Bearish confirmation: Break below 1.1511
Medium-term target: 1.1214
Stay alert to price action around these levels.
Trade safe, and have a blessed weekend.

EUR/USD Eyes Weekly Resistance as DXY Falls on Geopolitical Fear
*EUR/USD Analysis*
Recent global events particularly the ongoing conflict in Iran and associated political instability have contributed to a sustained downtrend in the U.S. Dollar Index (DXY). The index is currently approaching major historical support levels, which further reinforces the weakening dollar narrative.
Inversely, EUR/USD continues to exhibit bullish momentum. The pair is steadily climbing and is now approaching a key weekly resistance level. If this resistance is broken, we anticipate a strong push toward our final take-profit (TP) target.
At present:
Market Structure remains bullish
We are watching for signs of continuation such as:
Change of character (ChoCH)
Break of structure (BoS)
Demand zone confirmations
We're currently scanning for a low-risk entry upon confirmation preferably via a clean pullback or bullish engulfing confirmation on the lower timeframes. The goal is to catch the next leg up with solid risk-reward.
For now, it’s a waiting game. The trend is our friend, and we’ll let price action show us the way.
Let’s see how this bad boy plays out.
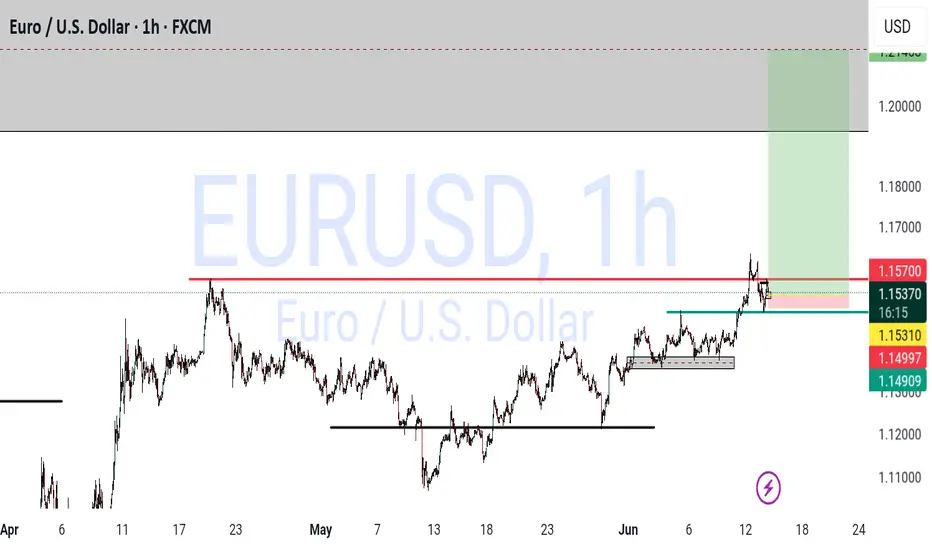
EUR/USD Eyes Weekly Resistance as DXY Falls on Geopolitical Fear
EUR/USD Analysis
Recent global events particularly the ongoing conflict in Iran and associated political instability have contributed to a sustained downtrend in the U.S. Dollar Index (DXY). The index is currently approaching major historical support levels, which further reinforces the weakening dollar narrative.
Inversely, EUR/USD continues to exhibit bullish momentum. The pair is steadily climbing and is now approaching a key weekly resistance level. If this resistance is broken, we anticipate a strong push toward our final take-profit (TP) target.
At present:
Market Structure remains bullish
We are watching for signs of continuation such as:
Change of character (ChoCH)
Break of structure (BoS)
Demand zone confirmations
We're currently scanning for a low-risk entry upon confirmation preferably via a clean pullback or bullish engulfing confirmation on the lower timeframes. The goal is to catch the next leg up with solid risk-reward.
For now, it’s a waiting game. The trend is our friend, and we’ll let price action show us the way.
Let’s see how this bad boy plays out.

EURUSD ANALYSISOn Eurusd, we're in on a bullish market. we're looking at for a pullback to fibonacci levels, from anywhere between 71% to 100% for a continuation to the upside

EURUSD LONGDolllar strength will come but not now the euro is still strong right now we saw the rejection to the downside and have clear choch to the upside . We could now see a little fall to the downside before price rallies creating higher highs . I’ve marked out where sellers would typically sell from and out the stop losses so we will should see a little drop (fakeout) then price retracing taking the sellers out and continuing up .

EURUSD: Will Go Up! Long!
My dear friends,
Today we will analyse EURUSD together☺️
The recent price action suggests a shift in mid-term momentum. A break above the current local range around 1.15537 will confirm the new direction upwards with the target being the next key level of 1.15800 and a reconvened placement of a stop-loss beyond the range.
❤️Sending you lots of Love and Hugs❤️

EURUSD topped? This Elliott wave count says YES!In our previous analysis, we were EURUSD bearish, and although we are trading about 2 cents higher now than when that analysis was published, we are still convinced that these high hills are shortable.
The pair, in our opinion, has finished a complete 5-wave Elliott formation earlier this week, and we prefer the short, with 2 targets that seem particularly interesting:
1. The flat correction target around 1.1065
2. The bottom of wave 4 of a lesser degree, at 1.0733, which is equal to, exactly & down to the pip, to the 61.8% retracement for the whole 5-wave sequence!
We will continue to be bearish for as long as 1.1704 is not clearly penetrated.
Whether the price penetrates 1.1704 & we give up, or, the market moves into our profit zone, we will post updates every week or so. Stay tuned!

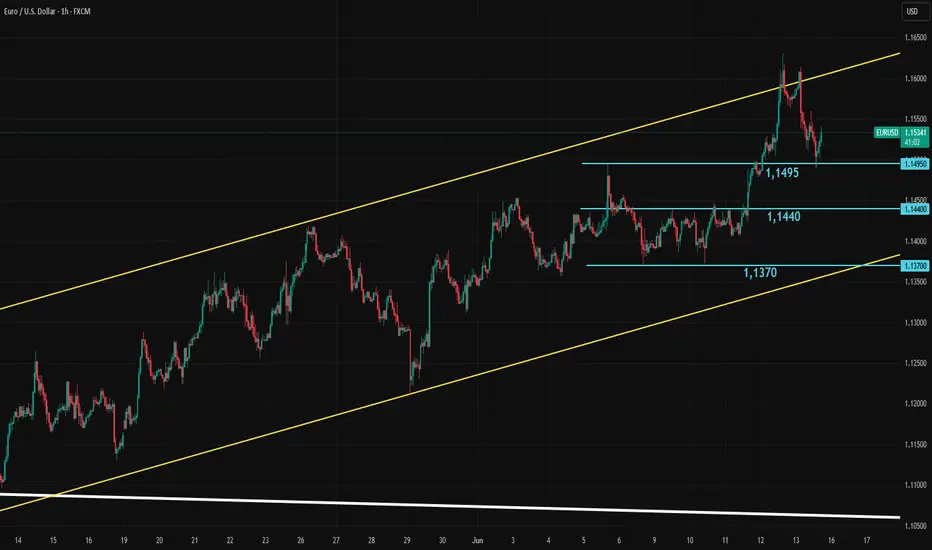
Rising Geopolitical Risk Could Pressure EURUSDEURUSD attempted to break the upper line of the trend channel yesterday, but with the start of the Israeli attack, a quick selloff followed. Rising geopolitical risks typically increase demand for U.S. debt and the dollar. As a result, EURUSD’s rally is facing short-term bearish pressure. The first key support level at 1.1495 is being tested. If it holds, there is a chance for another attempt at the upper line. However, if it breaks, 1.1440 and 1.1370 are the next support levels to watch in the short term.
EURUSD: Bulls Will Push Higher
Remember that we can not, and should not impose our will on the market but rather listen to its whims and make profit by following it. And thus shall be done today on the EURUSD pair which is likely to be pushed up by the bulls so we will buy!
Disclosure: I am part of Trade Nation's Influencer program and receive a monthly fee for using their TradingView charts in my analysis.
❤️ Please, support our work with like & comment! ❤️

EUR/USD retracement line and go longHigh volumes before the start of a fair value gap at 1.1438 area. When price approaches I shall short and reverse into a long as the level is hit.

EURUSD | Bearish Below 1.1530, Break Above 1.1559 Turns BullishEURUSD | Overview
The pair is trading under bearish pressure due to rising geopolitical tensions.
As long as the price remains below 1.1530, the bearish trend is expected to continue toward 1.1450 and 1.1372.
For a bullish reversal, the price must break above 1.1559 to open the path toward 1.1625.
Pivot Line: 1.1530
Support Levels: 1.1450, 1.1372, 1.1270
Resistance Levels: 1.1559, 1.1625, 1.1750

EURUSD long 30m*The content on this analysis is subject to change at any time without notice, and is provided for the sole purpose of assisting traders to make independent investment decisions.

EURUSD !!! (Big move is loading)
📈 EUR/USD – Wave 4 Buy Opportunity (2H TF)
Published by Greenfireforex | June 13, 2025
The EUR/USD pair is completing a corrective Wave 4, retracing into a premium FVG (Fair Value Gap) demand zone between 1.1500–1.1475. Price tapped into a high-probability reversal block just below the psychological level of 1.1500, offering a potential long entry.
🔹 Technical Confluences:
Wave 4 corrective structure
Fair Value Gap (Buyers) zone
Liquidity grab near 1.1478
Bullish projection towards 1.1637 (Wave 5 target)
🔸 Entry Idea:
Long from the FVG demand zone with confirmation (price action / bullish engulfing / lower timeframe structure break).
📍 Targets:
TP1: 1.1500
TP2: 1.1570
TP3 (wave projection): 1.16375
🛑 Invalidation:
Clean break below 1.1470 zone with momentum could invalidate the bullish setup.
---
📊 Strategy: Elliott Wave + FVG + Price Action
💡 Watch for reaction around CPI & USD news (14th–18th June)
Hashtags (for IG/TradingView):
#EURUSD #WaveAnalysis #Forex #ForexSetup #PriceAction #ElliottWave #SmartMoney #FXTrade #ForexBreakout
---

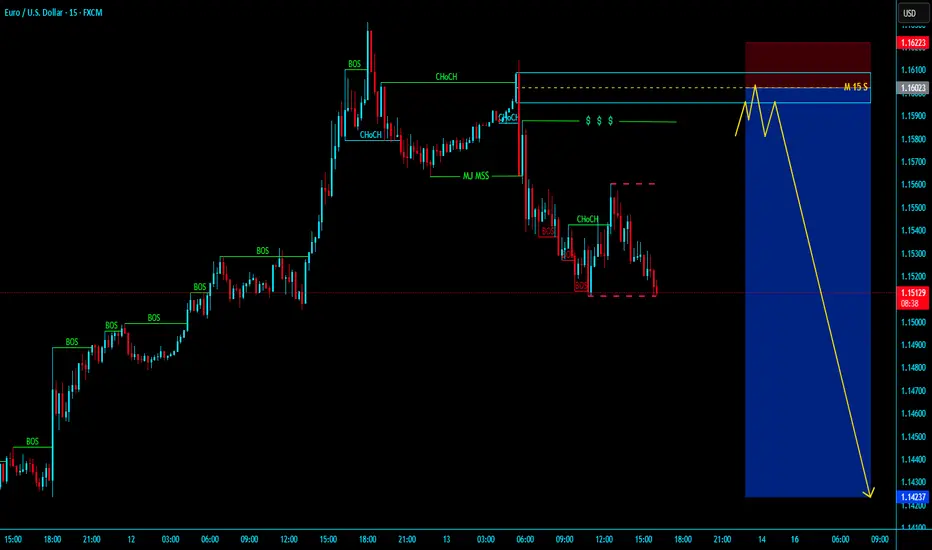
# EURUSD H1 MJ MSS WITH LIQUIDITY # EURUSD H1 MJ MSS WITH LIQUIDITY
~ EU MSS in H1 , in LTF with valid MSS Conformation then short entry with little pips of SL and long TP.....
~ 1st TP - @ 1.11760
~ 2ns TP - @ 1.10000
~ 3rd TP - @ 1.07780
Be Patient's on Your Trade
~~* KGB Priyabrta Behera *~~
* ICT & Advance Mapping SMC Trader *