EURUSDEUR/USD Exchange Rate
EUR/USD: 1.17735
The euro has strengthened against the US dollar, trading near its highest level since early 2024, supported by a softer DXY and stable Eurozone outlook.
10-Year Government Bond Yields
Region 10-Year Yield Date
Eurozone 2.560% July 5, 2025
United States 4.348% July 5, 2025
The US 10-year Treasury yield remains above the Eurozone’s, but the gap has narrowed in recent months.
Central Bank Policy Rates
Central Bank Policy Rate Last Change/Status
ECB 2.00% (Deposit Rate) Cut by 25 bps in June 2025
Federal Reserve 4.25%–4.50% Unchanged since Dec 2024
The ECB recently cut its deposit rate to 2.00% RFR 2.15% MLF 2.4%, its lowest in over two years, as inflation nears target and growth remains subdued.
The Fed has held its target range steady at 4.25%–4.50% since December 2024, with markets expecting possible cuts later in 2025 on cautious wait and see approach by feds
Rate and Yield Differentials
Metric US Eurozone Differential (US - Eurozone)
Policy Rate 4.25–4.50% 2.00% 2.25–2.50%
10-Year Bond Yield 4.35% 2.560% 1.79%
Yield Differential: The US 10-year yield exceeds the Eurozone’s by 1.79 percentage points, a key driver for capital flows and EUR/USD direction ,but strong euro zone economic outlook offset the yield and bond advantage giving the euro buy advantage .
Policy Rate Differential: The Fed’s policy rate is 2.25–2.50 percentage points higher than the ECB’s, though the gap is expected to narrow if the Fed cuts rates later this year.
Market Implications
EUR/USD: The narrowing yield and rate differentials have supported euro strength in recent weeks.
Bond Markets: US yields remain higher, but the Eurozone’s 10-year yield is at a multi-year high, reflecting persistent inflation and reduced ECB accommodation.
Central Bank Outlook: Both the Fed and ECB are expected to remain data-dependent, with further easing possible if economic conditions warrant.
The euro is currently strong against the dollar, with narrowing rate and yield differentials reflecting shifting monetary policy expectations and global economic condition.
#eurusd
EURUSDTDTM trade ideas

Another RR2 Position On EURUSDThesis: EUR/USD is showing signs of exhaustion near the 1.1800 psychological resistance, with price rejecting the upper band of a recent range.
Entry: 🔻 Sell at 1.17883 (current price action confirms rejection)
Stop-Loss: 🔺 1.17943 – Above recent swing high and psychological resistance
Take-Profit: ✅ 1.17767 – Targeting the lower bound of the recent range and prior support
Risk-Reward Ratio: ~1:2 – High conviction setup with tight risk and extended downside potential

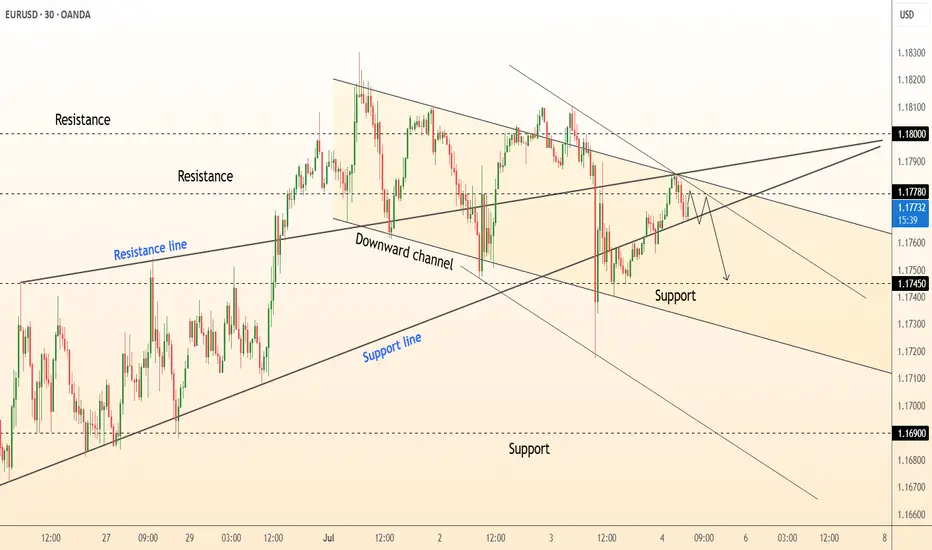
DeGRAM | EURUSD downturn in the channel📊 Technical Analysis
● Price is capped by a confluence of the June-July down-sloping channel roof and the former median resistance line at 1.1780; the last three candles form lower highs inside a micro bear-flag.
● Intraday structure now leans on the 1.1745–1.1750 support cluster: a break beneath this shelf completes the flag and exposes the channel floor/June pivot at 1.1690.
💡 Fundamental Analysis
● Pre-NFP dollar demand is rebuilding as ADP and ISM-services beat consensus, while French election uncertainty revives euro risk premium.
✨ Summary
Sell 1.1775 ± 5 pips; sustained trade below 1.1745 targets 1.1690. Short thesis void if 30-min candle closes above 1.1800.
-------------------
Share your opinion in the comments and support the idea with a like. Thanks for your support!
Bigger correction down for EUHi traders,
Last week EU came into the Weekly FVG and started a correction down from there.
Next week we could see another move down to finish the bigger correction.
Let's see what the market does and react.
Trade idea: Wait for the finish of the correction up and a change in orderflow to bearish on a lower time frame to trade shorts.
If you want to learn more about trading with FVG's, liquidity sweeps and Wave analysis, then make sure to follow me.
This shared post is only my point of view on what could be the next move in this pair based on my technical analysis.
Don't be emotional, just trade your plan!
Eduwave

EURUSD - End of the bull trend? Entering in a Range or a Bear?EURUSD is reaching a channel line on the weekly chart and it already showed us that traders are watching it.
Last week we had a very strong and climatic bull move, indicating bears were off, possibly waiting for the market to reach this level. Now that we reached it, we have a weekly candle with a long upper tail, indicating bulls taking profit and bears coming in.
The market is also overextended from the 20 EMA and a longer pullback looks reasonable and healthy at this point.
Let's see what happens in the next few weeks. But anyway, whoever made money on this bull trend is now shifting to a more cautious perspective. A pullback to the EMA is likely this year, since we didn't touch it since March 2025.

EURUSD Under Pressure! SELL!
My dear subscribers,
My technical analysis for EURUSD is below:
The price is coiling around a solid key level - 1.1726
Bias - Bearish
Technical Indicators: Pivot Points High anticipates a potential price reversal.
Super trend shows a clear sell, giving a perfect indicators' convergence.
Goal - 1.1612
My Stop Loss - 1.1783
About Used Indicators:
By the very nature of the supertrend indicator, it offers firm support and resistance levels for traders to enter and exit trades. Additionally, it also provides signals for setting stop losses
Disclosure: I am part of Trade Nation's Influencer program and receive a monthly fee for using their TradingView charts in my analysis.
———————————
WISH YOU ALL LUCK

EURUSD Trade OutlookAs we head into the new week, my expectation on EURUSD is centered around the concept of internal range liquidity (IRL) and external range liquidity (ERL).

EURUSD: overboughtFriday was a non-working day in the US, as the country was celebrating Independence Day. The most important weekly macro data was related to US jobs data. At the start of the week JOLTs job openings in May were posted with a figure of 7.769M, significantly higher from market estimate of 7,3M. The next day the NFPs and Unemployment rate was published. As per data, the unemployment rate dropped by 0,1pp to the level of 4,1%, which missed market expectations of 4,2%. The Non-farm payrolls in June added 147K new jobs, again better from forecasted 110K. The average hourly earnings were higher by 0,2% in June, or 3,7% on a yearly basis, modestly below the forecasted 3,9%. Other weekly macro data including ISM Manufacturing PMI in June reached 49,0 a bit higher from estimated 48,8. The ISM Services PMI in June was standing at 50,8 in line with market estimates.
Retail Sales in Germany dropped by an additional -1,6% in May, bringing the indicator to the level of +1,6% on a yearly basis. Both figures were lower from the market estimate of +0,5% for May and +3,3% for the year. Inflation rate in Germany preliminary in June was 2% a bit lower from forecasted 2,2%. Inflation for the month was standing at 0%. Preliminary inflation data for the Euro Zone in June was 0,3% for the month and 2% for the year. EuroZone core inflation was standing at 2,3% in June, exactly in line with market estimates. The unemployment rate in the Euro Zone in May was modestly increased by 0,1pp to the level of 6,3%, while the market was expecting to remain flat at 6,2%.
The US Dollar continued its decline against the euro during the previous week. The highest weekly level was at 1,1825, but the currency pair closed the week at 1,1776. The RSI reached the level of 73, signalling a clear overbought market side, increasing the probability of a short term reversal in the coming period. The MA50 continues to diverge from MA200, indicating low probability of a potential cross in the future period.
The eurusd daily chart is showing that the currency pair had formed a sort of channel with an uptrend during the past period. If lows from end of February, mid March and end of March are connected, the indication for a next potential level of eurusd might be somewhere above the 1,16 level. The 1,1620 was the highest level achieved in mid July this year, which aligns well with the previous indication. Indicators are currently showing higher probability of a short term reversal. The week ahead is not bringing any currently significant news with respect to the US economy, in which sense, it could be expected that the market will slow down a bit during the week. Short reversal is quite possible, where the level of 1,1620 might be shortly tested. Just in case that the market decides to continue movement toward the higher grounds, then 1,18 resistance will be tested, before the market continues its road toward the 1,19 level.
Important news to watch during the week ahead are:
EUR: Industrial Production in May in Germany, Retail Sales in the Euro Zone for May, Balance of Trade in Germany in May, Inflation rate final for May in Germany,
USD: FOMC Meeting minutes.

Eurusd technical analysis.Eurusd techinical analysis next move posibale at h1 time frame.not finchinal advice.

EURUSD: focus on jobs dataThe major macro data for this week, the PCE indicator, was posted on Friday. The Personal Consumption Expenditure index, Feds favorite inflation gauge, increased by 0,1% in May, bringing the index to the level of 2,3% on a yearly basis. Both figures were in line with market expectations. The core PCE was a bit higher than anticipated, at the level of 0,2% for the month and 2,7% for the year. A bit surprising figures came from Personal Income in May, which dropped by -0,4%, while the Personal Spending was down by -0,1% in May. Analysts are noting that implemented trade tariffs are slowly beginning to reflect in the personal spending of the US citizens. Also, this sort of potential development was noted by the Fed during the last two FOMC meetings.
The rest of posted macro data for the US included the Existing Home Sales in May reached 4,03M, which was an increase of 0,8% on a monthly basis. This was significantly above the market estimate of -1,3%. The Durable Goods Orders in May were higher by 16,4%, surpassing the market estimate of 8,5%. The GDP Growth Rate final for Q1was standing in a negative territory of -0,5% for the quarter, and was higher from market expectation of -0,2%. The end of the week brought University of Michigan Consumer Sentiment figures final for June, which was standing at 60,7 and was in line with estimates. The Inflation Expectations were a bit higher from the previous estimate, ending the June with expected 5% inflation, while the market was expecting to see 5,1%.
The HCOB Manufacturing PMI flash for June in Germany was standing at the level of 49, while the same index for the Euro Zone reached 49,4. Both indicators were in line with market expectations. The Ifo Business Climate in Germany in June reached 88,4, in line with market estimates. The GfK Consumer Confidence in July was at the level of -20,3, a bit higher from estimated -19,3.
The eurusd was traded with a bullish sentiment during the previous week. The currency pair started the week around the level of 1,1460 and continued toward the upside for the rest of the week. The highest weekly level at 1,1741 was reached in Friday's trading session. The RSI reached the clear overbought market side as of the end of the week, at the level of 71. The MA50 continues to diverge from MA200, without an indication that the potential cross is near.
The market favored the euro during the last two weeks. It comes as a result of insecurity when it comes to potential negative impact of implemented trade tariffs, which are slowly revealing in the US economy. The week ahead brings more jobs data, including JOLTs, NFP and unemployment rate, which will shape the investors sentiment. Some increased volatility might be ahead. The resistance level at 1,17 has been clearly tested during the previous week, and it will mark the beginning of the week ahead. The RSI is pointing to a higher probability of a short term reversal in the coming period, which might occur in the week ahead, impacted, most probably, by jobs data. In case of a reversal, the level of 1,1620 might easily be the next target. On the opposite side, there is a lower probability of a further move above the 1,17 level, however, the market might spend some time here, before a decision to make further move.
Important news to watch during the week ahead are:
EUR: Retail Sales in May in Germany, Inflation Rate preliminary in June for both Germany and the Euro Zone, Unemployment Rate in June in Germany,
USD: ISM Manufacturing PMI in June, JOLTs Job Openings in May, Non-farm Payrolls in June, Unemployment rate in June, Average Hourly Earnings and Spending, ISM Services PMI in June

EURUSD BUYING AREA (EUR/USD Analysis):
Pair: EUR/USD
Timeframe: 4H (4-Hour)
Current Price: 1.17660
Analysis Date: July 7, 2025
Chart mein clearly dikh raha hai ke price ne strong bullish rally ke baad resistance breakout kiya hai jo ab support zone ban chuka hai (marked in purple box around 1.15800 - 1.16300).
Price ab expected hai ke thoda retrace kare aur phir is new support zone par bullish confirmation dikhaye. Wahan se price likely bounce karega towards a new target high.
---
🎯 Target & Trading Plan:
📍Support Zone (Buy Zone):
🔹 1.15800 – 1.16300
🔹 Look for bullish reversal pattern in this zone (e.g. bullish engulfing, double bottom)
🎯Target Point:
🔹 1.20000
🔹 This level is the next significant resistance and potential take-profit zone
📉Stop Loss (Risk Management):
🔹 Below 1.15500
🔹 Invalidation of bullish setup if price breaks below support
---
✅ Trade Setup Summary:
Type Level
Entry Zone 1.15800 - 1.16300
Stop Loss Below 1.15500
Take Profit 1.20000
Risk:Reward Approx. 1:3+

RSI Flashes Warning on EURUSD: Critical Level Under Watch!Good morning traders,
If the EURUSD pair breaks below the 1.16729 level due to an RSI divergence, the next potential target could be around 1.16093.
Keep in mind that a break below 1.16729 may also signal a potential trend reversal.
I've marked the pivot points for you on the chart for better clarity.
Additionally, it's crucial to keep an eye on current economic data and news releases as part of your fundamental analysis.
I meticulously prepare these analyses for you, and I sincerely appreciate your support through likes. Every like from you is my biggest motivation to continue sharing my analyses.
I’m truly grateful for each of you—love to all my followers💙💙💙

EURUSD Bullish Setup: Watching for a Break and Retest📈 Looking at EURUSD right now, we’re in a strong bullish structure 🔼 — but it’s clearly overextended 🚀
As we head into the end of the week, there’s still potential for more upside today ⬆️ — but ⚠️ be cautious, since Fridays often bring retracements as we move into the weekly close 🕒📉
🔍 I’m watching for a bullish opportunity if we get a break above the current equal highs, followed by a retest and failure to break back below 🧠📊
If that setup doesn’t materialize, we’ll simply step aside and abandon the idea 🚫
💬 Not financial advice — always trade at your own risk.

Market next move Disruption Analysis – Bullish Alternative Scenario
While the current chart suggests a bearish setup from a resistance zone (around 1.1765) toward a target near 1.1630, here's a potential bullish disruption that could invalidate the bearish thesis:
---
🟢 Bullish Disruption Possibility:
1. False Breakdown / Liquidity Grab:
Price may fake a dip below the red resistance-turned-support zone to trigger stop-losses before reversing.
This is known as a liquidity sweep or bear trap.
2. Higher Low Formation:
If the pair pulls back slightly but forms a higher low above 1.1700, it may signal bullish continuation.
3. Breakout Confirmation:
A strong bullish candle above 1.1775 could confirm continuation toward 1.1830–1.1850.
4. Fundamental Catalyst:
Positive EU economic news or dovish signals from the U.S. Fed could support Euro strength.
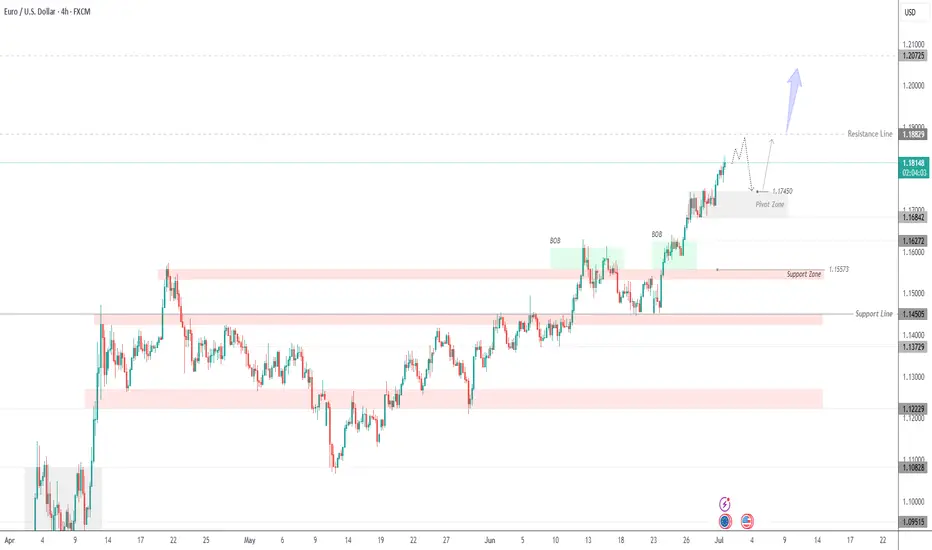
Euro Continues Bullish Trend | Eyes on 1.1882 & 1.2075EUR/USD – Strong Bullish Structure | Watching 1.1745 Pivot Zone for Reentry
The Euro continues to trade in a well-defined bullish trend, supported by institutional demand and clear price structure.
After breaking above the 1.1684 resistance zone, EUR/USD extended toward 1.1818 and now approaches the next resistance at 1.1882. This level may act as a temporary cap, but if breached with momentum, the pair could target the 1.2075 zone next.
Bullish Order Blocks (BOBs) marked on the chart highlight previous accumulation zones where buyers stepped in aggressively. These areas are still valid for demand-based pullbacks.
Key Area to Watch – 1.1745 Pivot Zone:
This level serves as a potential reentry point if the price retraces. As long as EUR/USD holds above this zone, bullish momentum remains intact. A confirmed bounce here could resume the uptrend toward 1.1882 and beyond.
However, a clean break below 1.1745 could open the door for a deeper correction toward 1.1627 or even 1.1557, which is the next major support zone.
Key Levels:
Resistance: 1.1882, 1.2075
Pivot Zone: 1.1745
Support: 1.1627, 1.1557
EUR/USD Breakout Eyes 1.18 as Bullish Momentum BuildsEUR/USD has punched through the 78.6% Fibonacci retracement level (1.1744) of the July 2023–October 2023 decline, signaling strong bullish continuation. The breakout above the recent swing high near 1.1576 confirms the uptrend is gaining traction, supported by rising moving averages.
The 50-day SMA has crossed well above the 200-day SMA, maintaining a strong golden cross structure, reinforcing the bullish bias. Momentum indicators support the advance, with the RSI entering overbought territory at 73.79, and the MACD maintaining a positive spread above the signal line — a classic sign of trend strength rather than imminent reversal.
However, the overbought RSI suggests the pair could face some short-term consolidation or a shallow pullback before targeting the psychological 1.18 handle. Bulls would likely view any dip toward the breakout level (1.1576) as a potential buying opportunity.
As long as EUR/USD holds above that support, the path of least resistance remains to the upside, potentially paving the way for a full retracement toward the 1.19–1.20 zone seen last year.
-MW

After all the news EUR/USD confirmed its time to pullback looking at daily up side leg extansion, almost with no retracments , it has a lot of space to fall down at least to 50% fib level , london gave couple good entry points to the downside. but its friday manage your positions more aggresive , anything could happen today,but we are bearish for the next week

Mastering Risk Management: The Trader’s Real EdgeYou’ve all heard it,
“Cut your losses and let your winners run.”
Simple words — but living by them is what separates survivors from blown accounts.
Here’s some tips on how to approach risk management when trading:
☑️ Risk is always predefined: Before I click Buy or Sell, I know exactly how much I’m willing to lose. If you don’t define risk upfront, the market will do it for you.
☑️ Position sizing: Never risk more than 1–2% of your account per trade. Small losses mean you can keep taking high‑probability setups without fear.
☑️ Always use a stop‑loss: No stop? You’re not trading — you’re gambling.
☑️ Stop‑loss discipline: Place stops where the market proves you wrong — not where it “feels comfortable.” Then leave them alone.
☑️ Focus on risk/reward, not win rate: A 40% win rate can still be profitable if your average reward outweighs your risk.
☑️ Risk/reward ratio: Only take trades with at least a 2:1 or 3:1 potential. You don’t need to win every trade — your winners should pay for your losers (and more).
Remember:
“It’s not about being right all the time. It’s about not losing big when you’re wrong.”
Risk management won’t make your trades perfect — but it will keep you trading tomorrow.
And in this game, staying in the game is everything.
💭 How do you handle risk in your trading? Drop your strategy or tip in the comments — let’s share and learn together! 👇
Thanks again for all the likes/boosts, we appreciate the support!
All the best for a good week ahead. Trade safe.
BluetonaFX

EURUSD analysis - 1H FVG and OB SetupsEUR/USD is in a strong bullish move right now.
We are waiting patiently for the price to reach our marked green (OB) and blue (FVG) zones before looking for clean buy opportunities. Always remember to let price tap into our key areas so we can enter on lower timeframes for precise, low-risk entries.
The first resistance ahead is around 1.2100, which will be our immediate target if the bullish momentum continues.
Stay patient, let the price come to your zones, and execute with discipline.
—
📊 ProfitaminFX | Gold, BTC & EUR/USD
📚 Daily setups & educational trades
📱 IG: @profitamin.f

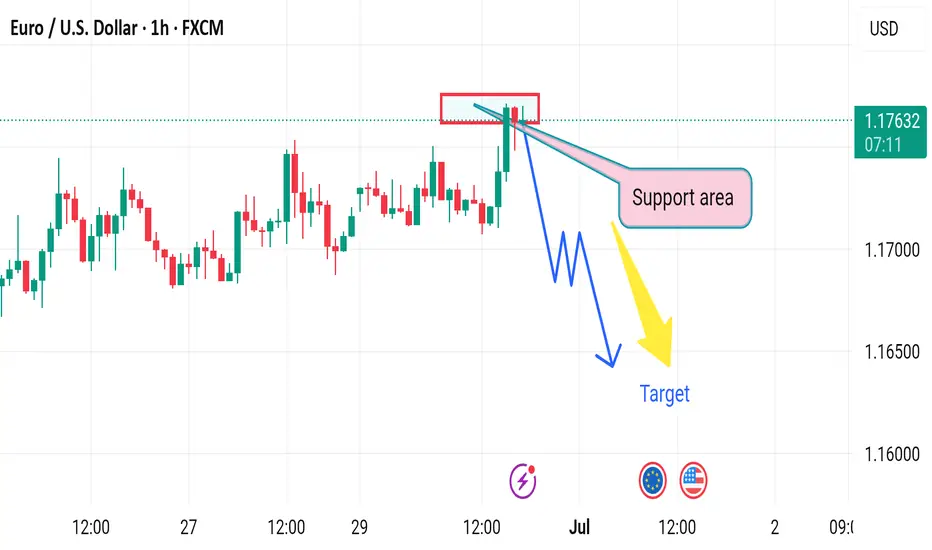
EUR/USD 15M CHART PATTERNHere’s a structured summary of your EUR/USD sell trade setup:
---
📉 Trade Type: SELL
Entry Price: 1.17875
---
🎯 Take Profit Levels:
1. TP1: 1.17700
2. TP2: 1.17450
3. TP3: 1.17090
---
🛑 Stop Loss:
SL: 1.18315
---
🧮 Risk/Reward Overview:
Target Distance (pips) Reward:Risk (approx)
TP1 17.5 ~0.37:1
TP2 42.5 ~0.9:1
TP3 78.5 ~1.8:1
SL 44 —
---
Would you like help calculating lot size, risk percentage, or backtesting this setup?

EUR/USD SETUPEUR/USD SETUP; as price raids on buyside liquidity we wait for price to give us a valid change in the state of delivery

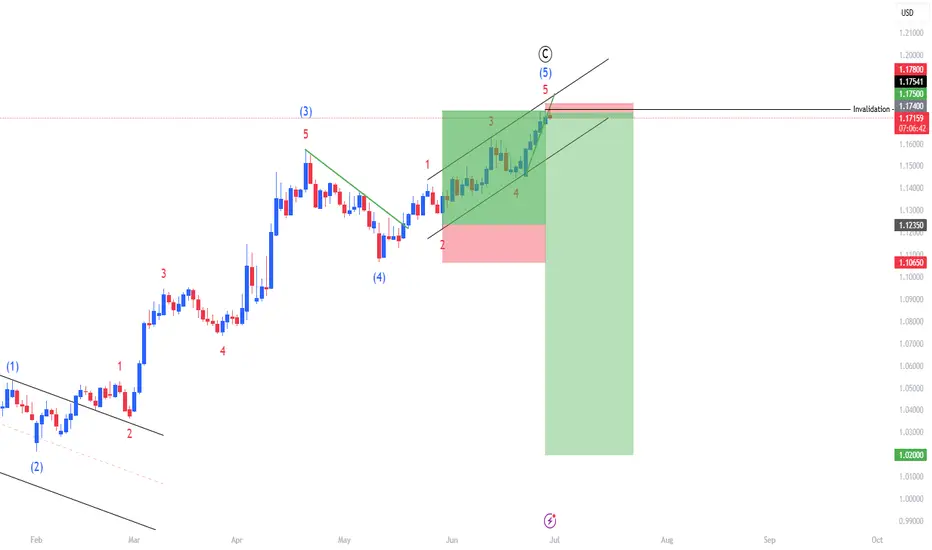
EURUSD - Eur bull run over??Completed Elliott Wave Structure:
• The chart displays a full 5-wave impulsive Elliott Wave count to the upside, labeled (1) through (5), completing a wave C.
• This suggests the end of a corrective ABC pattern, which often marks the end of a bullish retracement or rally within a larger downtrend.
Price Reaches Resistance Zone:
• The price reaches a previous high/resistance area marked by the top of the wedge and completes the fifth wave.
• This is typically where institutional traders may look to take profits or enter short positions.
Risk-Reward Set Up Suggests Short Bias:
• The chart includes a bearish risk-reward trade setup, indicating the trader expects a decline.
• The stop loss is placed slightly above the peak of wave 5, and the take profit is much lower, giving a favorable risk-to-reward ratio in anticipation of a significant move down.
Structure Confluence:
• The top of wave (5) aligns with the trendline resistance from the rising wedge formation, adding technical confluence to the bearish outlook.
⸻
Conclusion
With a completed Elliott Wave count, bearish chart pattern (rising wedge), technical resistance, and a well-defined short setup, the chart strongly suggests that a major top may be in place for EUR/USD, and a downside move is likely to follow.
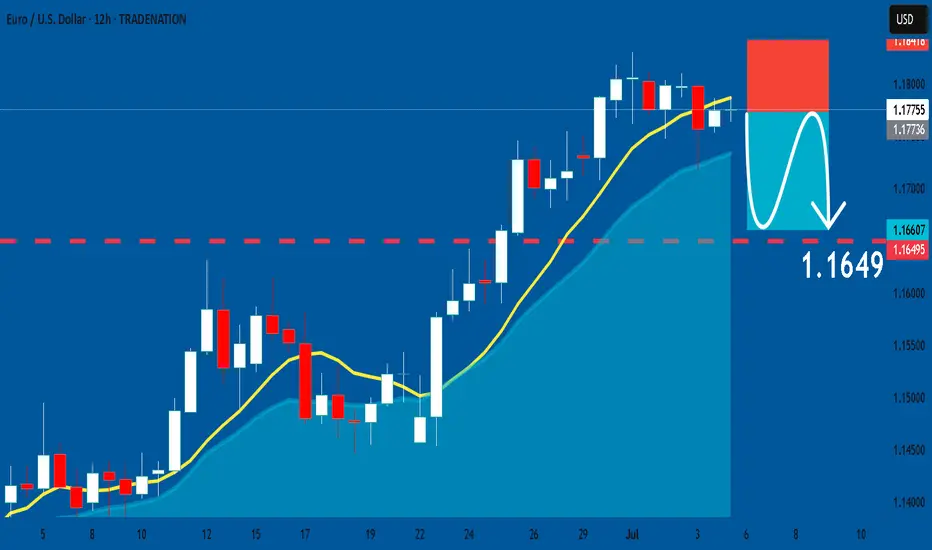
EURUSD: Short Signal Explained
EURUSD
- Classic bearish formation
- Our team expects fall
SUGGESTED TRADE:
Swing Trade
Sell EURUSD
Entry Level - 1.1775
Sl - 1.1841
Tp - 1.1649
Our Risk - 1%
Start protection of your profits from lower levels
Disclosure: I am part of Trade Nation's Influencer program and receive a monthly fee for using their TradingView charts in my analysis.
❤️ Please, support our work with like & comment! ❤️