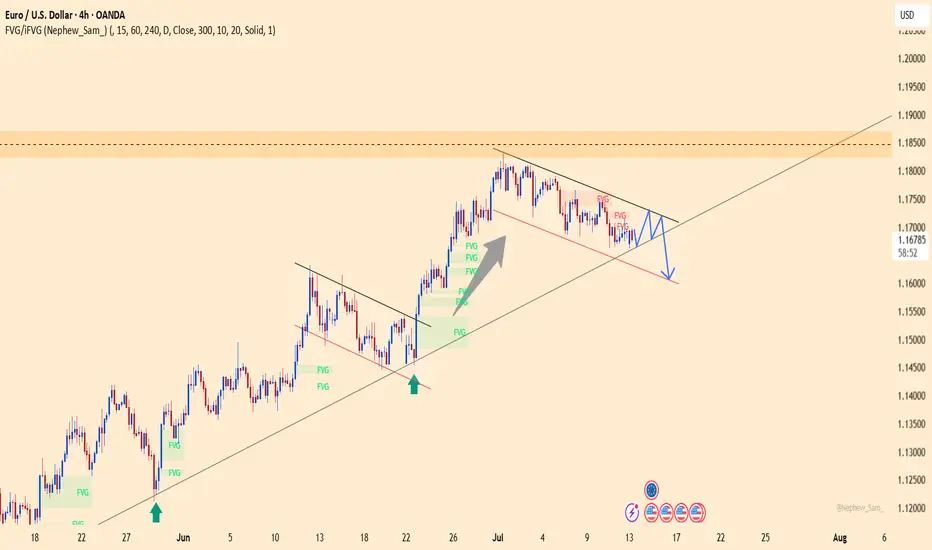
EURUSDEUUSD bouncing of a nice 4hr trendline for few days already. its time to break from the curse and move in a direction. Could it be bearish or bullish?
if the elliot wave is accurate, seems like to have a correction for the begining of next week. Let us know what you think?
EURUSDTDTM trade ideas

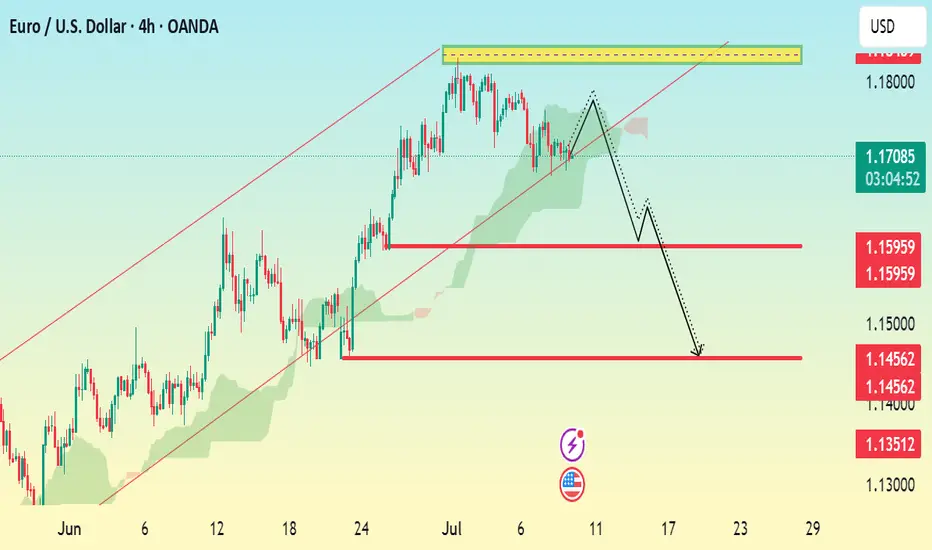
EUR/USD Bearish Setup H4 Chart AnalysisMarket Structure:
Current Price: 1.17057
The market has rejected a key resistance zone around 1.17600–1.17800 (highlighted in yellow).
Price formed a lower high, suggesting bearish momentum is taking control after an uptrend.
The pair is trading around a key trendline and Ichimoku cloud, with a likely break below.
Bearish Signals:
1. Double Top / Lower High Formation near 1.17600 indicates potential reversal.
2. Bearish Projection Drawn: Expecting a drop after the neckline break.
3. Support Zones Marked:
First Support/TP1: 1.1650 – 1.1595
Second Support/TP2: 1.1456
Final Target/TP3: 1.1351
MarketBreakdown | EURUSD, DOLLAR INDEX, BITCOIN, SILVER
Here are the updates & outlook for multiple instruments in my watch list.
1️⃣ #EURUSD daily time frame 🇪🇺🇺🇸
The price started a correctional movement after it updated
a high the first of July.
The market formed a bullish flag pattern.
Your next trend-following bullish signal will be a breakout and a daily
candle close above its resistance.
2️⃣ Dollar Index #DXY daily time frame 💵
The market corrects in a bearish flag pattern.
I see a test of a significant horizontal resistance cluster now.
Your signal to see will be a bearish violation of a support
of the flag and a daily candle close below.
3️⃣ #BITCOIN #BTCUSD daily time frame
Though the price managed to update the All-Time High
yesterday, the market did not manage to close above
a current major resistance.
I believe that we will see another attempt of the market to breakthrough.
Your bullish confirmation will be a daily candle close above the underlined resistance.
4️⃣ #SILVER #XAGUSD daily time frame 🪙
The price reached an important confluence demand zone
based on a rising trend line and a horizontal key structures support.
Probabilities will be high to see a bullish movement from that.
Do you agree with my market breakdown?
❤️Please, support my work with like, thank you!❤️
I am part of Trade Nation's Influencer program and receive a monthly fee for using their TradingView charts in my analysis.

Lingrid | EURUSD Bullish Trend ContinuesFX:EURUSD is holding a bullish structure inside an upward channel after bouncing from the 1.1670 demand zone. The current retracement appears corrective, and buyers may step in again near the confluence of the trendline and horizontal support. If confirmed, the price is expected to push toward the 1.1885 resistance and the upper channel target at 1.1900.
📈 Key Levels
Buy zone: 1.1650–1.1680 (trendline + key support)
Sell trigger: break below 1.1600
Target: 1.1885 – 1.1900 zone
Buy trigger: bullish reversal candle near 1.1700
💡 Risks
Failure to hold trendline support could lead to deeper retracement
1.1885 may cap upside if momentum fades
Bearish divergence could emerge if price surges too fast
If this idea resonates with you or you have your own opinion, traders, hit the comments. I’m excited to read your thoughts!

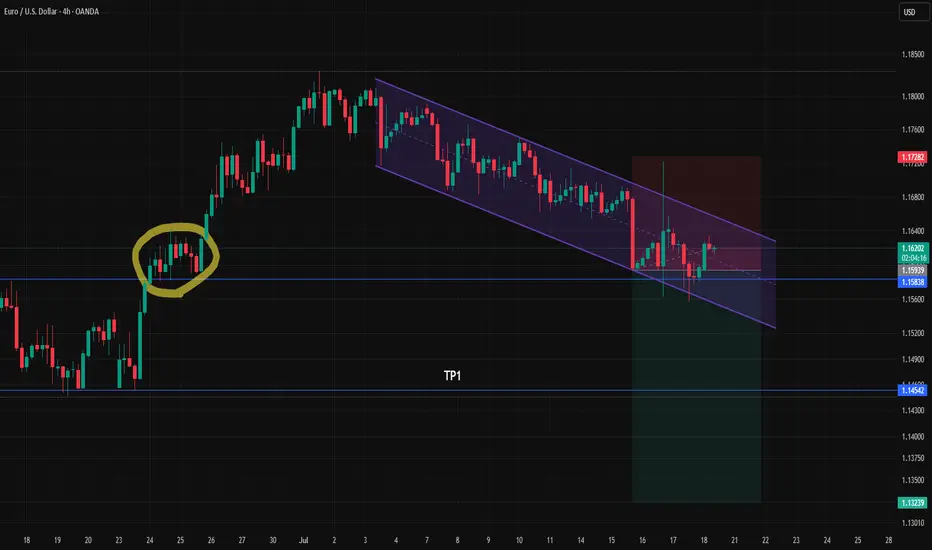
EUR/USD Stuck at Channel Midline — Bearish Bias Still in PlayUpdate on Previous Analysis
Since there are no major economic events scheduled for today, we expect lower volatility and a relatively calmer market, unless any unexpected news hits the wires.
Looking at the chart, price is still moving within a descending channel, and it's currently reacting around a key zone — an area of previous price congestion that also aligns with the midline of the channel.
Our bias remains bearish on the euro, unless the market gives us clear bullish reversal signals. Until then, we continue to follow the trend.
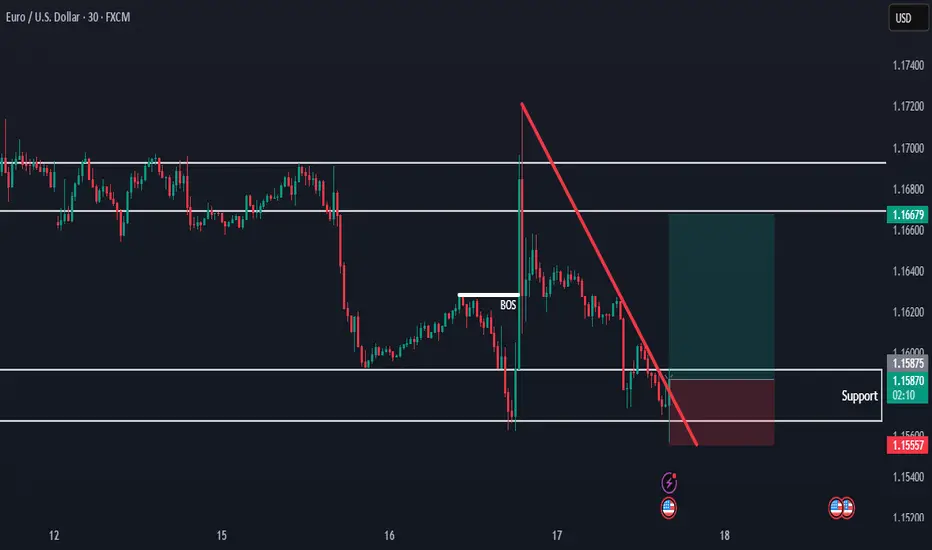
EURUSD Will Go Down! Short!
Take a look at our analysis for EURUSD.
Time Frame: 15m
Current Trend: Bearish
Sentiment: Overbought (based on 7-period RSI)
Forecast: Bearish
The market is testing a major horizontal structure 1.161.
Taking into consideration the structure & trend analysis, I believe that the market will reach 1.159 level soon.
P.S
Please, note that an oversold/overbought condition can last for a long time, and therefore being oversold/overbought doesn't mean a price rally will come soon, or at all.
Disclosure: I am part of Trade Nation's Influencer program and receive a monthly fee for using their TradingView charts in my analysis.
Like and subscribe and comment my ideas if you enjoy them!

EURUSD Holding Support — Bullish Move in ProgressHello everybody!
There is a strong higher timeframe resistance now acting as support.
Price is respecting this area and starting to form a strong move to the upside.
We are looking to enter a buy position here, as the overall bullish trend is likely to continue.
EURUSD- Bearish momentum expected at 15 minute Time frameEURUSD Bearish momentum Bearish momentum Expected based on market making perfect TBS and Model 1 at the strong PRZ level as indicated by RSI also. accordingly Expecting atleast 50% target hit as TP1 and then 100% :) cheers . have a blessed friday.

EUR/USD Weekly AMD Breakdown | VolanX Protocol Signal
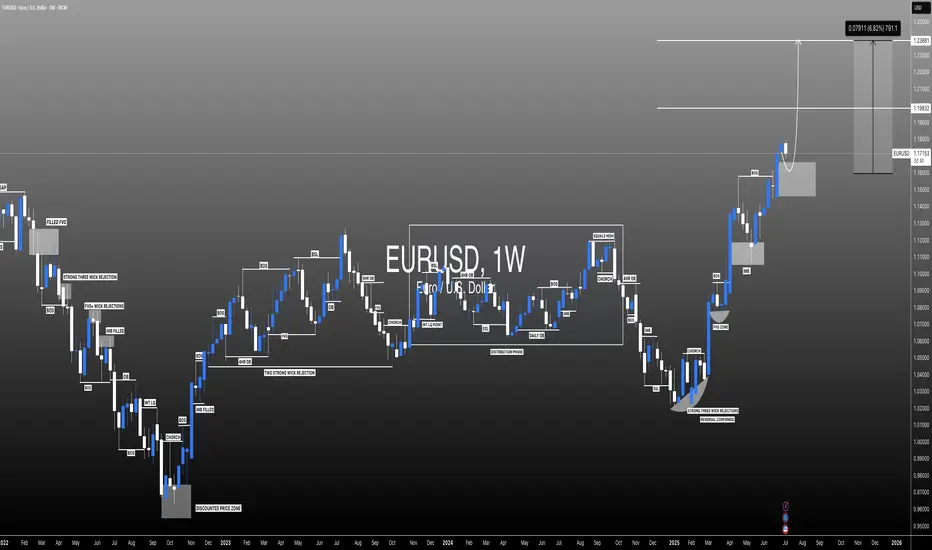
🧠 EUR/USD Weekly AMD Breakdown | VolanX Protocol Signals Distribution Phase Active
📍 EUR/USD | 1W Chart
📅 July 17, 2025
🧭 Structured by: WaverVanir International LLC
🔗 Powered by VolanX Protocol + DSS Architecture
🧨 Strategic Context:
This isn’t a random retracement—it’s the completion of a full AMD cycle (Accumulation → Manipulation → Distribution), and EUR/USD just exited the manipulation high, confirming the start of a long-term markdown phase.
🧠 Pattern Alignment:
✅ Green Box = Accumulation Zone (Rangebound 2023–early 2025)
🔶 Orange Box = Manipulation Trap (Spring sweep + emotional lows)
⚠️ Grey Box = Distribution (Fast repricing into liquidity pockets)
🔻 Red Line = Markdown begins
Embedded schematic confirms the AMD logic.
This is how institutions engineer macro turns.
📉 VolanX Bearish Targets (2025–2026 Outlook):
🎯 First Target: 1.1022 – Fibonacci & OB confluence
🎯 Secondary Target: 1.0828 – Elliott Wave 3 full extension
🎯 Macro Target: 0.9500 – 2026 narrative climax zone
“Distribution is never announced; it’s only visible in hindsight. But VolanX sees it unfolding in real time.”
⚠️ Invalidations:
A weekly close back above 1.1850 would void this structure.
Momentum confirmation pending from macro catalysts (ECB dovish, Fed delay).
🎯 Trade Strategy:
Bias: Strong short
Entry Zone: Any rally into 1.1700–1.1800 = premium rejection zone
Execution: Build position in tranches, use volume spikes & SMC CHoCHs as confirmation
Risk: Tight stop above 1.1850 (structure invalidation)
🔐 VolanX Strategic Note:
📡 The model confirms that EUR/USD is entering a structurally engineered distribution phase, driven by smart money exit flows, macro policy divergence, and a resurgent USD.
Wave (3) compression is already under way. This is where conviction counts.
⚠️ Educational content only. Not financial advice.
#EURUSD #AMD #SmartMoney #MacroTrading #VolanX #WaverVanir #ForexStrategy #LiquidityTrap #DSS #DistributionPhase

EUR/USD – Falling Wedge at Major Fibonacci Zone | Bullish ReversAfter a strong mid-June rally, EUR/USD has pulled back into a key fib cluster, showing early signs of reversal from a classic falling wedge pattern — often a precursor to bullish breakouts.
Technical Breakdown:
📉 Descending Trendline
🔍 Fibonacci Confluence:
Price is reacting from the 0.5-0.618 – 0.705 zone (1.16421-1.15969), aligning perfectly with historical demand and the golden zone of the fib retracement.
Just below sits the 0.79 fib (1.15339), which also marks our invalidity level for this idea — a deep but powerful retracement if tested.
💡 RSI:
While still below 50, it has created a hidden bullish divergence between July 12–17, hinting that momentum is flipping back to bulls.
🧠 Educational Insight:
This setup combines Trendlines, Fibonacci retracement theory, and EMA dynamics to build a multi-layered trade thesis — the type of confluence we look for at Wright Way Investments.
Price doesn’t just reverse because it hits a fib level. But when structure, EMAs, and RSI align — the odds increase significantly.
📈 Trade Setup (Idea-Based, Not Financial Advice):
Long Entry Zone: Current area (1.159–1.161), with confirmation above 1.1626
Invalidation: Clean break & close below 1.15339
Target Zones:
🎯 TP1 – 1.1642 (50 fib & retest zone)
🎯 TP2 – 1.1686 (38.2 fib)
🎯 TP3 – 1.1755 (Weekly Resistance)
📌 Summary:
EUR/USD is forming a textbook reversal setup, supported by fib precision and EMA alignment. Patience is key — but the ingredients are here for a strong bullish continuation.

EURUSD – Bearish Pressure Mounts Ahead of Triangle Breakout EURUSD is trading within a contracting triangle and currently leans toward a bearish bias. After several failed attempts to break the upper boundary, momentum is weakening, and the pair is showing signs of a potential breakdown toward lower support levels.
With several key events ahead, the euro may face additional pressure if upcoming Eurozone inflation data disappoints or if the Fed maintains a hawkish tone through upcoming speeches by U.S. officials. Unless there is a strong bullish catalyst, EURUSD is likely to correct further to the downside.
#EURUSD: Last Bullish Price Extension! Get Ready! EURUSD is approaching our buying zone, a key level, which suggests a smooth bullish reversal. As this is a swing trade, we advise keeping stop losses larger. There are two targets to keep an eye on. Remember, this is not a guaranteed move, and this is just our overview. Good luck and trade safely.
Team Setupsfx_
EURUSD: Long Trade with Entry/SL/TP
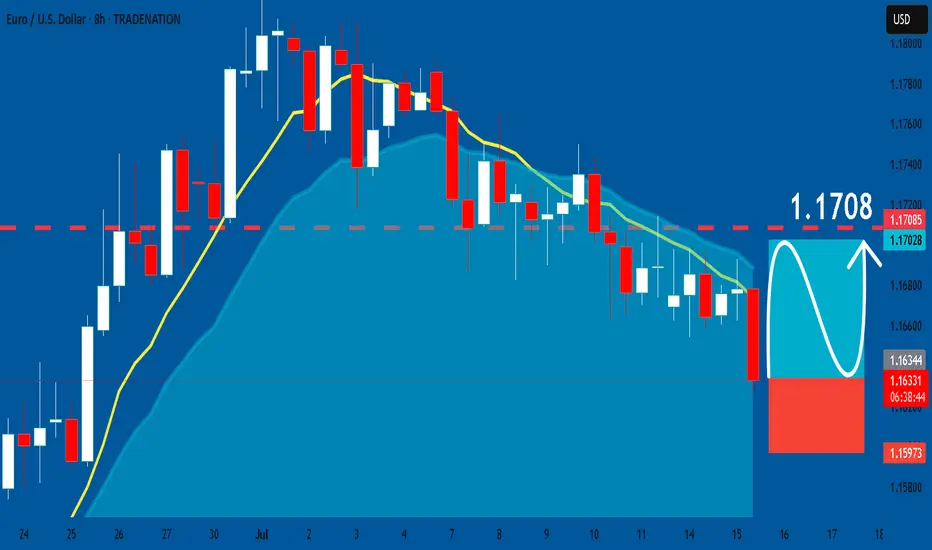
EURUSD
- Classic bullish pattern
- Our team expects retracement
SUGGESTED TRADE:
Swing Trade
Buy EURUSD
Entry - 1.1635
Stop - 1.1597
Take - 1.1708
Our Risk - 1%
Start protection of your profits from lower levels
Disclosure: I am part of Trade Nation's Influencer program and receive a monthly fee for using their TradingView charts in my analysis.
❤️ Please, support our work with like & comment! ❤️
EURUSD - Still Orderflow remains bearishLooking at EU. The 1H Orderflow is still maintaining that bearish intent. My area is set now for where i want to take a potential sell to the downside seeing as everything else is pretty much mitigated.
The only issue with this potential sell of is that we never really had a sweep of liquidity before we rolled over and moved to the downside.
We do have a level of inducement before our POI but i think in an ideal world i would love to see us build up a bit more liquidity before the POI just to induce the early sellers before making that move to the downside.
For now. On the lower TF's i will be looking to take short term long positions back up to our POI before looking for the longer terms short. to our 4H POI in which i will be looking to get long once again.
Any questions feel free to give me a message

EURUSDEUR/USD shows bullish COT (net longs), but USD’s individual COT is very strong (net longs), which usually means USD strength and EUR/USD bearish pressure.
COT on the pair can lag or reflect speculative flows, while USD’s strength often has bigger impact.

EUR/USD Bullish Setup in Progress as Wave C Targets 1.1622
🟢 LONG BIAS
📅 Updated: July 16
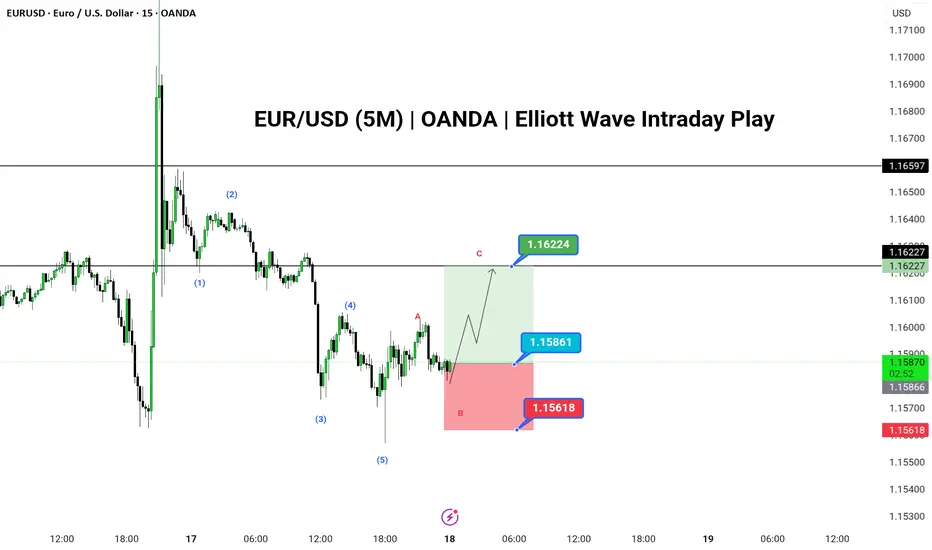
EUR/USD has completed a clean 5-wave impulse structure to the downside, followed by an unfolding ABC corrective pattern on the 5-minute chart. With Wave A and the ongoing B leg nearing completion, bulls may look to capitalize on a Wave C rally toward the 1.1622 resistance zone.
The structure suggests a temporary bullish move within a broader correction. Entry near the 1.1586 level offers a solid R:R setup, with invalidation below 1.1561. This setup is ideal for short-term intraday traders using Elliott Wave theory and expecting a 3-wave corrective rally.
---
📊 Technical Structure (5M)
✅ 5-wave bearish impulse labeled (1)-(5) complete
✅ ABC correction developing (currently in Wave B)
✅ Potential for bullish continuation via Wave C
📌 Upside Target
✅ Final: 1.16224
🔻 Risk Zone
❌ Invalidation: Below 1.15618
---
📈 Market Context
USD Consolidation: Dollar index pauses after strong rally, offering intraday relief to majors.
Euro Support: Mild bid across EUR crosses, offering stability in low-timeframe setups.
No High-Impact News: Ideal technical environment for short-term wave trading.
---
⚠️ Risks to Watch
Breakdown below 1.1561 would invalidate the structure.
Sudden volatility from unscheduled news.
Failure of Wave C to reach projected resistance.
---
🧭 Summary: Bias and Watchpoints
EUR/USD is setting up for a potential Wave C move toward 1.1622 as the ABC corrective structure plays out. Bullish bias holds above 1.1561 with a high-probability setup unfolding for short-term wave traders. Watch for price reaction near 1.1586 and use tight risk control.
Bearish breakout off major support?EUR/USD is reacting off the support level which is an overlap support that lines up with the 61.8% Fibonacci retracement and a breakout of this level could lead the price to drop from this level to our take profit.
Entry: 1.1587
Why we like it:
There is an overlap support level that lines up with the 61.8% Fibonacci retracement.
Stop loss: 1.1666
Why we like it:
There is an overlap resistance.
Take profit: 1.1451
Why we like it:
There is an overlap support level that lines up with the 61.8% Fibonacci retracement.
Enjoying your TradingView experience? Review us!
Please be advised that the information presented on TradingView is provided to Vantage (‘Vantage Global Limited’, ‘we’) by a third-party provider (‘Everest Fortune Group’). Please be reminded that you are solely responsible for the trading decisions on your account. There is a very high degree of risk involved in trading. Any information and/or content is intended entirely for research, educational and informational purposes only and does not constitute investment or consultation advice or investment strategy. The information is not tailored to the investment needs of any specific person and therefore does not involve a consideration of any of the investment objectives, financial situation or needs of any viewer that may receive it. Kindly also note that past performance is not a reliable indicator of future results. Actual results may differ materially from those anticipated in forward-looking or past performance statements. We assume no liability as to the accuracy or completeness of any of the information and/or content provided herein and the Company cannot be held responsible for any omission, mistake nor for any loss or damage including without limitation to any loss of profit which may arise from reliance on any information supplied by Everest Fortune Group.

EUR/USD) bearish chochy Trend Read The captionSMC trading point update
Technical analysis of EUR/USD (Euro vs. U.S. Dollar) on the 4-hour timeframe. Here’s the breakdown
---
Technical Breakdown:
1. Market Structure Shift (CHOCH):
The chart highlights a Change of Character (CHOCH), signaling a bearish reversal after a previous uptrend.
This is confirmed by lower highs and lower lows forming after the CHOCH point.
2. New Resistance Zone:
The previous support (yellow box) has now turned into a new resistance level around 1.16400–1.16700.
Price has rejected this area after the breakdown, validating the resistance flip.
3. 200 EMA Breakdown:
Price is now trading below the 200 EMA (1.15928), which reinforces bearish sentiment.
The EMA may act as dynamic resistance on any pullbacks.
4. Target Zone:
The projected target is the key support zone around 1.14582, where price consolidated before the last major bullish move.
This level has historical significance and aligns with a clean support demand zone.
5. RSI Indicator:
RSI is not yet oversold, sitting in a neutral-to-bearish range, indicating further downside potential.
Mr SMC Trading point
---
Trade Idea Summary:
Bias: Bearish
Entry Zone: On breakdown and rejection from the new resistance area (~1.16400–1.16700)
Target Zone: 1.14582 (key support)
Invalidation: A break and close above the resistance zone
Confluence: CHOCH confirmation + support-turned-resistance + 200 EMA breakdown
---
Please support boost 🚀 this analysis)

Price action Eurusd has made lower low now price gone back to sweep liquidity another chance to lower

EURUSD correction continuesYesterday, EURUSD reached 1,1590 following key news releases.
This doesn’t change the overall market direction or the type of setups we’re looking for.
The next key support level is at 1,1536.
Keep an eye out for a bounce and potential entry signals around that area.

Important News for EURUSDYesterday, EURUSD continued moving sideways as the market waits for upcoming news.
Today at 1:30 PM London time, U.S. inflation data will be released.
This report has a strong impact and is likely to set the next direction for the pair.
It’s advisable to reduce your risk and avoid opening new positions before the news comes out.
The goal is to follow the trend once it resumes!

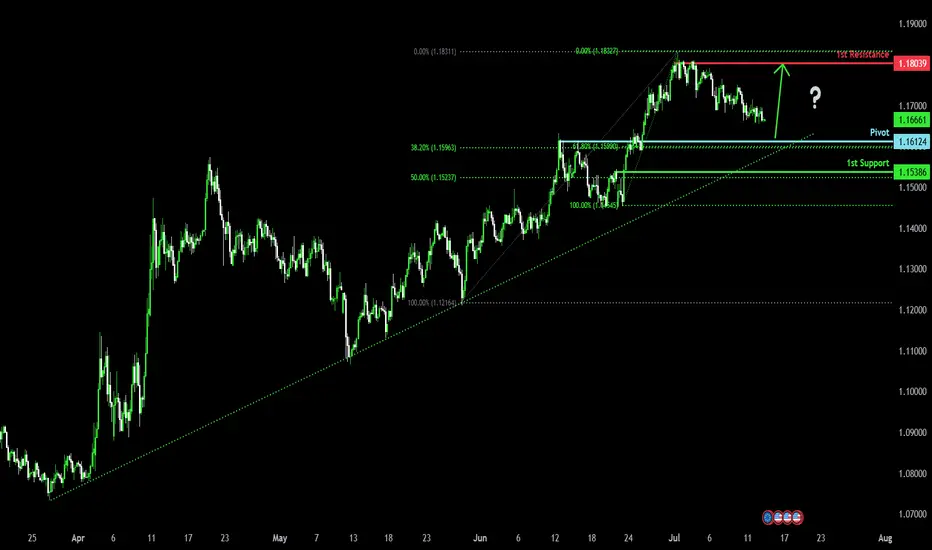
Bullish bounce for the Fiber?The price is falling towards the pivot, which acts as a pullback support and could bounce to the 1st resistance, a swing high resistance.
Pivot: 1.1612
1st Support: 1.1538
1st Resistance: 1.1803
Risk Warning:
Trading Forex and CFDs carries a high level of risk to your capital and you should only trade with money you can afford to lose. Trading Forex and CFDs may not be suitable for all investors, so please ensure that you fully understand the risks involved and seek independent advice if necessary.
Disclaimer:
The above opinions given constitute general market commentary, and do not constitute the opinion or advice of IC Markets or any form of personal or investment advice.
Any opinions, news, research, analyses, prices, other information, or links to third-party sites contained on this website are provided on an "as-is" basis, are intended only to be informative, is not an advice nor a recommendation, nor research, or a record of our trading prices, or an offer of, or solicitation for a transaction in any financial instrument and thus should not be treated as such. The information provided does not involve any specific investment objectives, financial situation and needs of any specific person who may receive it. Please be aware, that past performance is not a reliable indicator of future performance and/or results. Past Performance or Forward-looking scenarios based upon the reasonable beliefs of the third-party provider are not a guarantee of future performance. Actual results may differ materially from those anticipated in forward-looking or past performance statements. IC Markets makes no representation or warranty and assumes no liability as to the accuracy or completeness of the information provided, nor any loss arising from any investment based on a recommendation, forecast or any information supplied by any third-party.
Internal Summary EURUSD Pair: EURUSD
Bias: Bullish
Timeframe: 1H
Trigger: Support test within triangle pattern
Targets:
TP1: 1.17217
TP2: 1.17851
Invalidation: Below 1.15942
Comment: Price is compressing inside a symmetrical triangle, holding above a key ascending trendline. A breakout to the upside looks probable as long as price holds current support.
