Elliott Wave Analysis: Potential Correction AheadThe overarching 5-wave structure from January 9, 2025, to today is nearing completion. We are currently in Wave 5, with the subordinate Wave 3 in progress. Within this, the sub-subordinate Wave 5 is just starting. Once the overarching Wave 5 concludes, expect a multi-week correction. The correction is projected to target levels between 1.1173 and 1.075.
EURUSDTDTM trade ideas
EURUSD Long, 02 JulyAsia Fill Trade
Despite being inside a Daily Bearish OB, this trade is purely an Asia fill setup, so HTF bias is not heavily weighted here.
We had clear 1m BOS and retrace into the 1m OB, right inside a 15m Decisional POI, backed by inverted hammer rejections on both EU and DXY.
📉 Entry: 1m OB after BOS
📊 Confluence: DXY reacting from 15m POI + Asia
🎯 TP: Asia Low (1:3 RR)
🛡️ BE: 1.5RR or LTF BOS continuation
Clean execution based on intraday logic & structure, with correlation as additional confidence.

Eurozone Economy and ECB Policy:Eurozone Economy and ECB Policy: Between Price Stability and Currency Tension
The Eurozone’s latest data points to a relatively stable and controlled macroeconomic environment, with a key milestone just reached:
📊 June inflation hit 2.0%, aligning precisely with the ECB’s long-term target.
Growth remains moderate but positive, and unemployment is stable. From a classical policy perspective, this setup would typically justify further interest rate cuts to stimulate demand and support economic expansion.
But there’s a growing complication:
The euro has strengthened significantly in recent weeks, driven not just by economic fundamentals but also by capital inflows and a weakening U.S. dollar. A stronger euro, while often seen as a sign of investor confidence, can hurt exports, reduce competitiveness, and dampen inflation further — potentially becoming a drag on recovery.
As a result, the ECB finds itself in a policy dilemma:
Cutting rates could stimulate growth, but risk driving the euro even higher.
Slowing down or pausing rate cuts could stabilize the currency, but may stall economic momentum.
---
🔁 Reflexivity at Work
This dynamic highlights George Soros' theory of reflexivity — where market perceptions shape fundamentals, and those fundamentals in turn reshape perceptions.
> “Market prices are always distorted by prevailing biases.”
— George Soros
The current rally in the euro may not reflect fundamentals alone. If the move exceeds investor expectations, it could trigger emotional reactions, abrupt capital shifts, or even corrections — despite a solid economic base.
---
⚠️ Key Takeaways
June inflation at 2.0% gives ECB a clean slate to act — but with caution.
Currency appreciation can delay or distort the impact of monetary easing.
Market reflexivity may accelerate reactions beyond what data alone would justify.
Policy credibility now hinges not just on data, but on timing and communication.
---
In today’s market, price and psychology move together. Stability on paper doesn't always mean stability in execution.

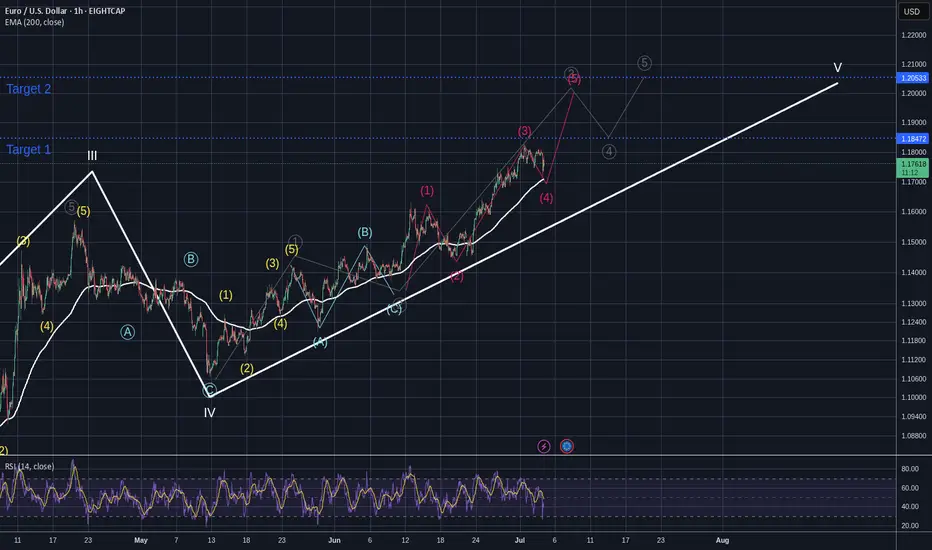
EURUSD Bullish Momentum EUR/USD is expected to resume its bullish trend after a brief consolidation. The market is likely to gain bullish momentum from the 1.17007 – 1.17507 support zone, potentially targeting the 1.20285 level in the next upward move

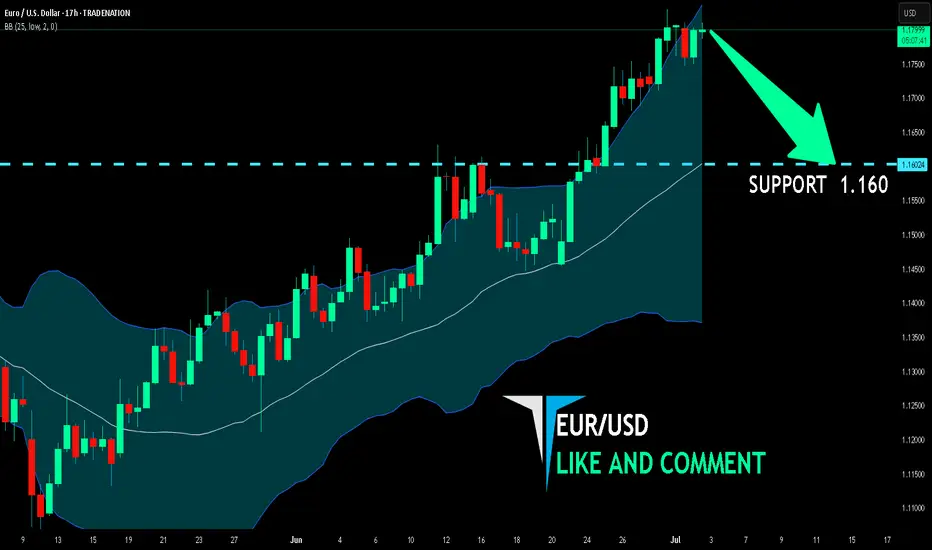
EUR/USD BEST PLACE TO SELL FROM|SHORT
Hello, Friends!
EUR/USD pair is trading in a local downtrend which know by looking at the previous 1W candle which is red. On the 17H timeframe the pair is going up. The pair is overbought because the price is close to the upper band of the BB indicator. So we are looking to sell the pair with the upper BB line acting as resistance. The next target is 1.160 area.
Disclosure: I am part of Trade Nation's Influencer program and receive a monthly fee for using their TradingView charts in my analysis.
✅LIKE AND COMMENT MY IDEAS✅

Buy on EURUSDPrice liquidates an internal range liquidity. Entering from the Breaker block and targeting a premium swing high

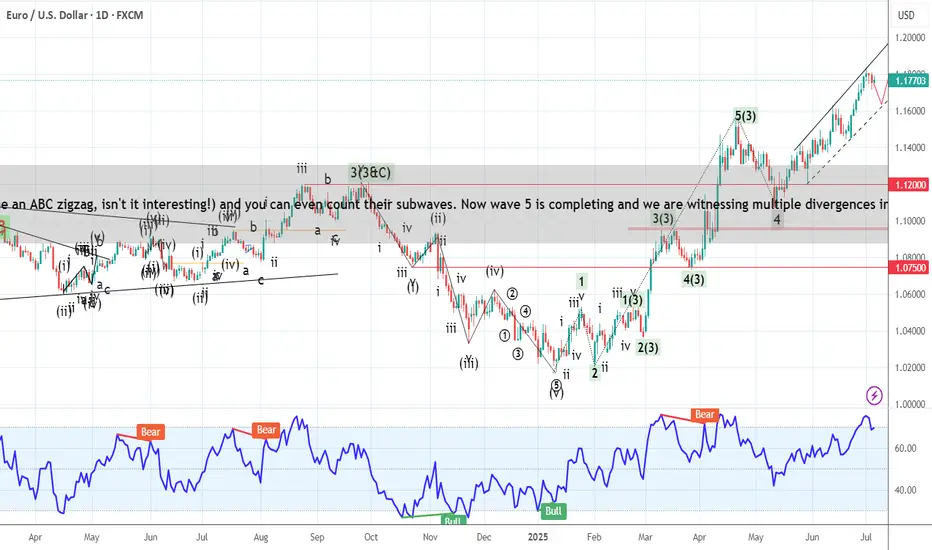
EUR USD Elliott Wave AnalysisHello friends
We are witnessing the formation of a complete Elliott wave pattern on the EURUSD chart. These waves from 1 to 5 are quite clear and you can even count their subwaves. Now wave 5 is completing . With the breakdown of the trend line drawn below and a pullback to it, we can expect the price to fall to the specified support. The first support is 1.12000and then 1.10000.
Good luck and be profitable.
EURUSD A Fall Expected! SELL!
My dear subscribers,
My technical analysis for EURUSD is below:
The price is coiling around a solid key level - 1.1784
Bias - Bearish
Technical Indicators: Pivot Points High anticipates a potential price reversal.
Super trend shows a clear sell, giving a perfect indicators' convergence.
Goal - 1.1667
My Stop Loss - 1.1853
About Used Indicators:
By the very nature of the supertrend indicator, it offers firm support and resistance levels for traders to enter and exit trades. Additionally, it also provides signals for setting stop losses
Disclosure: I am part of Trade Nation's Influencer program and receive a monthly fee for using their TradingView charts in my analysis.
———————————
WISH YOU ALL LUCK

EURUSD Short Projections for Big Beautiful BillI think we may hit a resistance point soon and drop to around 1.16 or lower. Based on the fundamentals of the Big Beautiful Bill. I think this will be short term and the USD may lose strength.
It will have large economic impact, I think this will happen in short term.
FX:EURUSD
TVC:DXY

The Day Ahead Major Economic Data:
US:
ISM Manufacturing (June) and JOLTS job openings (May) – Key for Fed rate cut outlook.
Construction spending and vehicle sales – Insight into economic strength.
Dallas Fed services – Regional business sentiment check.
China:
Caixin Manufacturing PMI (June) – Watch for signs of continued slowdown.
Japan:
Tankan Survey (Q2) – Key business sentiment data; may influence BoJ policy.
Eurozone:
June CPI (inflation) – Crucial for ECB’s rate path.
Germany unemployment, Italy PMI, budget, and car sales – Regional economic health indicators.
Central Bank Highlights:
ECB Sintra Forum Panel:
Features Powell (Fed), Lagarde (ECB), Ueda (BoJ), Bailey (BoE).
Markets will watch for any policy shift signals or divergence in rate outlooks.
Other ECB Speakers:
Guindos, Schnabel, Elderson – may give more hints on inflation and rate moves.
ECB Consumer Survey:
Offers insight into household inflation expectations.
Market View:
US data may push Fed closer to rate cuts if weak.
Eurozone inflation will guide ECB stance.
China’s PMI is a global growth signal.
Central bank talks at Sintra are key for global rate outlook.
Overall:
Markets are on edge awaiting clarity on growth, inflation, and rate paths. Expect possible moves in FX, yields, and equities depending on the data and central bank tone.
This communication is for informational purposes only and should not be viewed as any form of recommendation as to a particular course of action or as investment advice. It is not intended as an offer or solicitation for the purchase or sale of any financial instrument or as an official confirmation of any transaction. Opinions, estimates and assumptions expressed herein are made as of the date of this communication and are subject to change without notice. This communication has been prepared based upon information, including market prices, data and other information, believed to be reliable; however, Trade Nation does not warrant its completeness or accuracy. All market prices and market data contained in or attached to this communication are indicative and subject to change without notice.

EURUSD – Rounded Top Signals Bearish Reversal The EURUSD pair is showing clear signs of weakness after forming a rounded top pattern near the 1.18100 resistance zone. Price has broken out of a short-term sideways range and may retest the FVG area near 1.17500 before continuing its downward move.
If the support at 1.17118 is breached, EURUSD could head toward the 1.16200 level – a key demand zone on the chart. The bearish momentum is being reinforced by recent news:
Yesterday: U.S. employment data exceeded expectations, strengthening the USD.
Today: The euro is under pressure due to EU recession concerns and political instability in France.
Coming up: The FOMC minutes may continue to reflect a hawkish stance, which could further weigh on EURUSD.

EURUSD Expected Growth! BUY!
My dear followers,
This is my opinion on the EURUSD next move:
The asset is approaching an important pivot point 1.1774
Bias -Bullish
Technical Indicators: Supper Trend generates a clear long signal while Pivot Point HL is currently determining the overall Bullish trend of the market.
Goal - 1.1792
About Used Indicators:
For more efficient signals, super-trend is used in combination with other indicators like Pivot Points.
Disclosure: I am part of Trade Nation's Influencer program and receive a monthly fee for using their TradingView charts in my analysis.
———————————
WISH YOU ALL LUCK

Be careful with EURUSDEURUSD is holding its bullish trend and hovering around 1,1800.
Tomorrow, U.S. employment data is due.
It will be released on Thursday instead of Friday, as Friday is a holiday.
At the current levels, there’s no favorable risk-reward for new entries.
Watch for a pullback and wait for the right moment.

EURUSD ASIA Sells I see this head and shoulders pattern on EURUSD M15 timeframe. Entry should be 1,7955 above so this trade will require some patience. EURUSD is currently on an uptrend so exit the trade soon as tp hits.

EURUSD: Target Is Up! Long!
My dear friends,
Today we will analyse EURUSD together☺️
The recent price action suggests a shift in mid-term momentum. A break above the current local range around 1.18033 will confirm the new direction upwards with the target being the next key level of 1.18161 and a reconvened placement of a stop-loss beyond the range.
❤️Sending you lots of Love and Hugs❤️

Eurousd techinical analysis.Eurousd techinical analysis next move posibale at h1 time frame.not finchinal advice.

#AN015: TRUMP-PUTIN Phone Call and July 4th, Markets Closed
In an unexpected phone call on the sidelines of the American Independence Day, Vladimir Putin and Donald Trump – in the midst of the campaign for his potential re-election – had a confidential conversation that quickly captured the attention of global markets, even on a day when Wall Street was closed.
Hello, I am Trader Andrea Russo and today I want to talk to you about the latest news of these hours. I would like to thank in advance our Official Broker Partner PEPPERSTONE for the support in creating this article.
📉 Wall Street closed, but Forex is always open
While the US stock markets remain closed for the July 4th holiday, the currency market – by its nature decentralized and global – never stops completely. And it is precisely in these moments of low liquidity that geopolitical moves can have an amplified impact.
☎️ What did Putin and Trump say to each other?
Official sources speak of a “cordial discussion” on global security issues, Ukraine, and the future of US-Russia energy relations. However, according to leaks from Moscow, Putin has expressed openness to a new energy negotiation in the event of Trump’s return to the White House.
Translated into Forex language? This could mean:
Lower geopolitical risk on USD in the long term (Trump is seen as more in favor of dialogue with Moscow)
Pressure on Euro if negotiations with Russia are diverted to a Washington-Moscow axis
Temporary strength of RUB in case of glimmers of easing of energy sanctions
📊 Impact on key currency crosses
Comparing the post-news movements on some crosses:
USD/RUB: flat for now, but ready to jump over the weekend if confirmations arrive
EUR/USD: latent weakness, also due to the decline in ISM and the resilience of European inflation
USD/JPY: stable, but with pro-dollar sentiment in the background (Trump is perceived as economically dovish)
⏱️ What to expect in the next 24 hours?
With liquidity recovering already since tonight (Tokyo), markets could start to price in the geopolitical narrative of Trump's return. This scenario favors:
USD slightly stronger in the short term
Watch out for false breakouts on low volatility (typical of July 4th)

Eurusdt tecenical analysis.Eurusdt tecenical analysis next move posibale at h1 time frame.not finacial advice.

Euro Dollar, institutions are still bullish ($1.20 this summer?)There's one constant on the floating exchange market (Forex) this year, the US dollar is by far the weakest currency. It's the same scenario as the first months of Donald Trump's first term in office in 2017 repeating itself. The US President's stated aim is to give US exporters a competitive exchange rate.
The Euro exchange rate is also being supported higher by a combination of fundamental factors, notably a relative catch-up of European assets against US stock market assets. It is the sum of these fundamentals that is enabling a well-constructed uptrend in the EUR/USD rate on FX this year 2025. A new monthly technical close was recorded on the evening of Monday June 30, and with technical resistances breached, it looks as if the euro-dollar rate is on course to reach $1.20 this summer.
1) A new monthly technical close (June technical close) continues to support the euro-dollar's annual uptrend
The June technical close has been in place for the euro-dollar since the start of the week, providing further bullish chart confirmation. The euro-dollar price has confirmed that it has broken through a descending resistance line in place since the 2008 financial crisis. The price is converging with its momentum (represented here by the RSI and LMACD technical indicators) and the next natural technical target lies at $1.20. This is a technical target for the summer, bearing in mind that in the short term, a move back towards support at $1.15 and $1.17 remains possible.
The chart below shows monthly Japanese candlesticks for the EUR/USD rate, with the Ichimoku, RSI and LMACD technical indicators
2) Institutional traders are still bullish on the euro-dollar rate, according to the CFTC's COT report
What's most interesting about the overall analytical approach is the convergence between technical analysis signals and institutional positioning signals on the EUR/USD rate.
According to the CFTC's COT (Commitment Of Traders) report, institutional traders (hedge funds + asset managers) became net buyers of the euro dollar at the start of 2025, and weekly updates of this positioning data show that their buying exposure is increasing as the EUR/USD price rises. This bullish convergence between chartism and institutional investor positioning lends credibility to a scenario that would see the euro dollar reach resistance at $1.20 this summer. This market view would be invalidated if support at $1.14 were broken.
The two charts below show institutional traders' positions on Euro Dollar futures. Institutional traders were predominantly bullish at the start of the year, and month after month, they are increasing their buying exposure.
DISCLAIMER:
This content is intended for individuals who are familiar with financial markets and instruments and is for information purposes only. The presented idea (including market commentary, market data and observations) is not a work product of any research department of Swissquote or its affiliates. This material is intended to highlight market action and does not constitute investment, legal or tax advice. If you are a retail investor or lack experience in trading complex financial products, it is advisable to seek professional advice from licensed advisor before making any financial decisions.
This content is not intended to manipulate the market or encourage any specific financial behavior.
Swissquote makes no representation or warranty as to the quality, completeness, accuracy, comprehensiveness or non-infringement of such content. The views expressed are those of the consultant and are provided for educational purposes only. Any information provided relating to a product or market should not be construed as recommending an investment strategy or transaction. Past performance is not a guarantee of future results.
Swissquote and its employees and representatives shall in no event be held liable for any damages or losses arising directly or indirectly from decisions made on the basis of this content.
The use of any third-party brands or trademarks is for information only and does not imply endorsement by Swissquote, or that the trademark owner has authorised Swissquote to promote its products or services.
Swissquote is the marketing brand for the activities of Swissquote Bank Ltd (Switzerland) regulated by FINMA, Swissquote Capital Markets Limited regulated by CySEC (Cyprus), Swissquote Bank Europe SA (Luxembourg) regulated by the CSSF, Swissquote Ltd (UK) regulated by the FCA, Swissquote Financial Services (Malta) Ltd regulated by the Malta Financial Services Authority, Swissquote MEA Ltd. (UAE) regulated by the Dubai Financial Services Authority, Swissquote Pte Ltd (Singapore) regulated by the Monetary Authority of Singapore, Swissquote Asia Limited (Hong Kong) licensed by the Hong Kong Securities and Futures Commission (SFC) and Swissquote South Africa (Pty) Ltd supervised by the FSCA.
Products and services of Swissquote are only intended for those permitted to receive them under local law.
All investments carry a degree of risk. The risk of loss in trading or holding financial instruments can be substantial. The value of financial instruments, including but not limited to stocks, bonds, cryptocurrencies, and other assets, can fluctuate both upwards and downwards. There is a significant risk of financial loss when buying, selling, holding, staking, or investing in these instruments. SQBE makes no recommendations regarding any specific investment, transaction, or the use of any particular investment strategy.
CFDs are complex instruments and come with a high risk of losing money rapidly due to leverage. The vast majority of retail client accounts suffer capital losses when trading in CFDs. You should consider whether you understand how CFDs work and whether you can afford to take the high risk of losing your money.
Digital Assets are unregulated in most countries and consumer protection rules may not apply. As highly volatile speculative investments, Digital Assets are not suitable for investors without a high-risk tolerance. Make sure you understand each Digital Asset before you trade.
Cryptocurrencies are not considered legal tender in some jurisdictions and are subject to regulatory uncertainties.
The use of Internet-based systems can involve high risks, including, but not limited to, fraud, cyber-attacks, network and communication failures, as well as identity theft and phishing attacks related to crypto-assets.

Bullish rise?The Fiber (EUR/USD) has reacted off the pivot and could rise to the 1st resistance.
Pivot: 1.1578
1st Support: 1.1278
1st Resistance: 1.1909
Risk Warning:
Trading Forex and CFDs carries a high level of risk to your capital and you should only trade with money you can afford to lose. Trading Forex and CFDs may not be suitable for all investors, so please ensure that you fully understand the risks involved and seek independent advice if necessary.
Disclaimer:
The above opinions given constitute general market commentary, and do not constitute the opinion or advice of IC Markets or any form of personal or investment advice.
Any opinions, news, research, analyses, prices, other information, or links to third-party sites contained on this website are provided on an "as-is" basis, are intended only to be informative, is not an advice nor a recommendation, nor research, or a record of our trading prices, or an offer of, or solicitation for a transaction in any financial instrument and thus should not be treated as such. The information provided does not involve any specific investment objectives, financial situation and needs of any specific person who may receive it. Please be aware, that past performance is not a reliable indicator of future performance and/or results. Past Performance or Forward-looking scenarios based upon the reasonable beliefs of the third-party provider are not a guarantee of future performance. Actual results may differ materially from those anticipated in forward-looking or past performance statements. IC Markets makes no representation or warranty and assumes no liability as to the accuracy or completeness of the information provided, nor any loss arising from any investment based on a recommendation, forecast or any information supplied by any third-party.

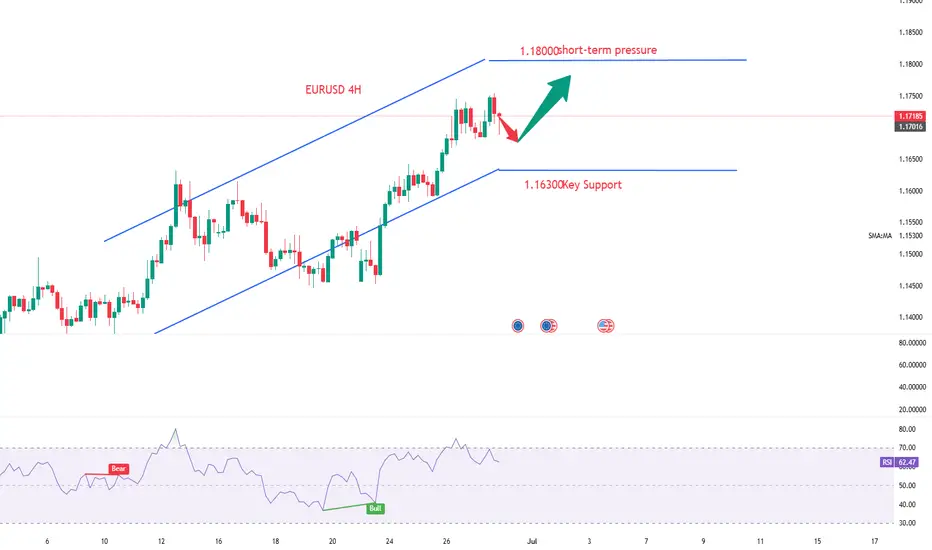
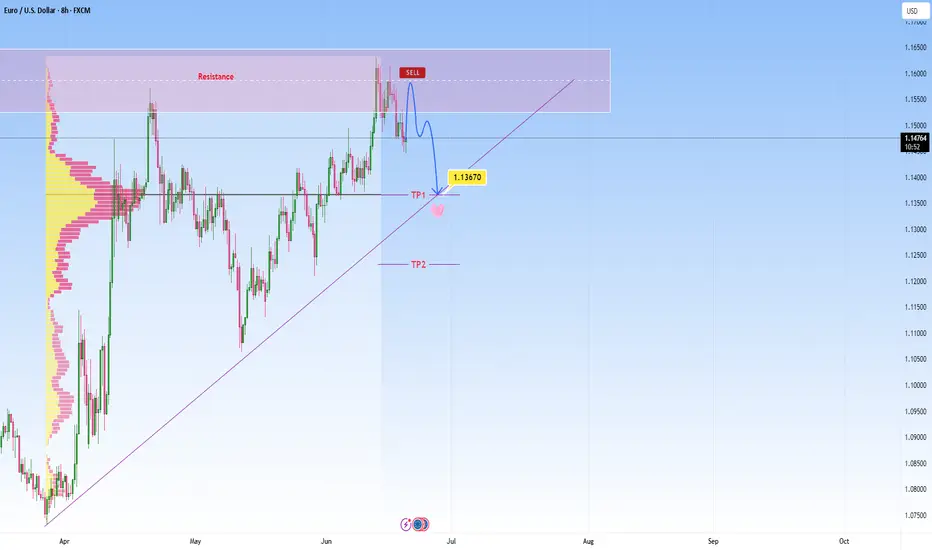
EURUSD heads towards resistance, short-term reversal expectedEURUSD has been in a strong uptrend, and we’re currently observing price action is reaching a notable resistance zone. I am watching for a reversal here as marked on my chart, not expecting a major move, but rather a short-term rejection with a downside target at around 1.13670 , which also aligns with the POC.
This is where it can become a decision point, either price finds support and bounces, or it breaks below, and that’s when we might see the move start to extend lower.
If we get a decisive breakdown through that ascending trendline, my next area of interest is marked as TP2. From there we can expect either potential accumulation or another reaction, depending on broader market sentiment at the time.
That said, we're navigating a complex backdrop currently:
The EU macro environment is under pressure, as weak economic data from Europe is contributing to cautious sentiment around the euro.
Meanwhile, a sustained USD bid continues, supported by stronger U.S. growth expectations, favorable yields, and persistent global demand. This further weighs on EURUSD.
Adding to the uncertainty, escalating tensions between Israel and Iran have rattled markets this week. This geopolitical risk could be pushing oil prices higher:
It’s important to note that if price convincingly rejects here and loses structure, especially with high volume and obvious bullish structure, this setup would become invalid. In that case, I would reassess and adapt
Are Technical Charts Fully Bullish on Euro's Rebound OverheatingThe EUR/USD exchange rate is consolidating at high levels, posting gains for the seventh consecutive trading day. The pair briefly approached the three-year high of 1.1744 in intraday trading, accumulating a roughly 2% weekly gain so far. This rally is primarily driven by intensified expectations of U.S. rate cuts and temporary easing of geopolitical tensions.
In terms of technical indicators, the MACD's DIFF and DEA lines continue to rise, with the red histogram expanding again, demonstrating "bullish volume expansion" and showing no signs of exhaustion in the technical rebound. The RSI stands at 70.39, nearing overbought territory but without forming a top divergence, suggesting remaining upside potential.
The current price structure indicates the pair is approaching the key resistance of 1.1744. Analysts believe an effective breakout above this level would open the door to the upside target of 1.1810-1.1850. In case of a pullback due to resistance, the initial support lies at 1.1630, corresponding to the previous dense trading zone and short-term moving average support.
you are currently struggling with losses,or are unsure which of the numerous trading strategies to follow,You have the option to join our VIP program. I will assist you and provide you with accurate trading signals, enabling you to navigate the financial markets with greater confidence and potentially achieve optimal trading results.