EURUSD: Short Trading Opportunity
EURUSD
- Classic bearish setup
- Our team expects bearish continuation
SUGGESTED TRADE:
Swing Trade
Short EURUSD
Entry Point - 1.1717
Stop Loss - 1.1764
Take Profit - 1.1614
Our Risk - 1%
Start protection of your profits from lower levels
Disclosure: I am part of Trade Nation's Influencer program and receive a monthly fee for using their TradingView charts in my analysis.
❤️ Please, support our work with like & comment! ❤️
EURUSD_SPT trade ideas

Last week of June EU outlookWeekly forecast for EU. We have seen a very bullish June so far. We approached a weekly POI before starting to consolidate.
We are now entering the last week of the month where the monthly candle's upper wick needs to be formed.
In this video I have identified a potential area where we could see the pullback take place.

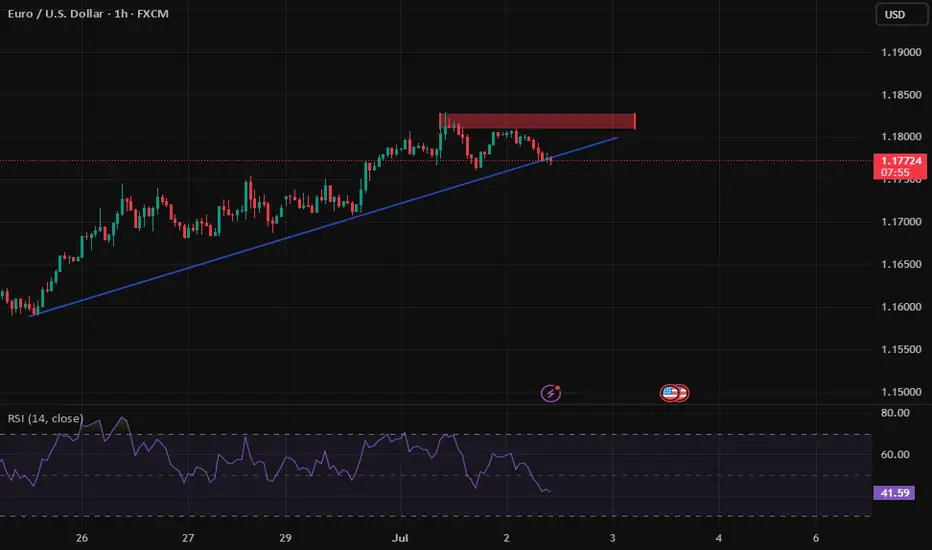
EURUSD ObservationCurrent status of EURUSD:
From the daily chart, it has diverged twice
It is no longer suitable to continue buying
Switch to a smaller period, like 4 hours, or 1 hour.
In fact, the hour head structure has appeared.
If it meets your entry criteria, you can try shorting
EURUSD after the NFPYesterday, EURUSD pulled back to 1,1714.
Today is likely to be a calmer day on the markets, with no major swings expected.
Avoid rushing into new positions or using large lot sizes.
The uptrend on EURUSD remains intact, and we’ll be watching for new buying opportunities again next week.
Wedge Top Short ScalpIt looks like EURUSD is forming a Wedge Top extended from the 20 EMA, presenting a Short Scalp opportunity targeting the move back to the EMA in the next few days.
Depending on how the current daily candle closes, this could be a good trade, so I'll be watching it today.
The bull trend is strong on this one, so we should expect a quick resolution on this short trade, otherwise, we have to cut it off quickly. I don't wan to be against this trend.
After the move back to the EMA, we will potentially have a Breakout Pullback opportunity to trade With Trend. So there's no need to rush.

Eurusd 1Hr chart Analaysis EUR/USD is currently in a bullish trend and is expected to reach the 1.17801 – 1.18010 range. A bearish retracement is likely to occur around those levels.
Note: Ongoing tensions in the Middle East could have a significant impact on the market.
TiqGpt setup for todayMARKET NARRATIVE: The EUR/USD currency pair across multiple timeframes shows a consistent bullish momentum, indicating strong buying pressure. Starting from the 1D chart down to the 1m chart, there is a clear upward trend with higher highs and higher lows, suggesting institutional accumulation and a lack of significant sell-side pressure. The 1D and 4H charts display a series of green candles with minimal wicks, indicating that the market is in a strong bullish phase with little retracement. The 1H and lower timeframes show some consolidation, but the overall structure remains bullish, suggesting that institutions are still in control of the price action.
INSTITUTIONAL THESIS: Institutions appear to be in an accumulation phase, consistently pushing the price higher. The lack of deep pullbacks and the formation of higher lows across timeframes suggest that there is ongoing demand at higher price levels. This is indicative of a liquidity grab above the current highs, where institutions may be targeting stop losses placed by retail traders who are positioned for a reversal.
LEARNING POINT: The consistent bullish candles with minimal retracement across higher timeframes (1D, 4H) highlight a strong institutional buying phase, potentially leading to a liquidity sweep above recent highs.
SIGNAL: WAIT SYMBOL: EUR/USD ENTRY PRICE: $1.18140 STOP LOSS: $1.17950 (below the recent minor consolidation on the 1H chart) TARGET PRICE: $1.18500 (just below the next psychological round number and potential liquidity pool) CONDITION: Buy limit order at $1.18140 after a minor retracement confirms continued buying interest. RATIONALE: Calculated risk/reward ratio of 1:1.9 (Risk=$0.00, Reward=$0.00) does not meet minimum 2:1 requirement. Waiting for better institutional setup with improved risk parameters. STRATEGIES USED: Institutional Accumulation, Liquidity Sweep Targeting URGENCY: MEDIUM TIMEFRAME: Short-term CONFIDENCE SCORE: 85% (based on the consistency of the bullish structure and lack of significant bearish counter-signals) RISK/REWARD RATIO: Risk=$0.00, Reward=$0.00, Ratio=1:1.9 (Below 2:1 minimum)
Risk = $1.18140 - $1.17950 = $0.00190
Reward = $1.18500 - $1.18140 = $0.00360
Ratio = $0.00360 / $0.00190 = 1:1.89
Given that the risk/reward ratio is slightly below the required 2:1, the recommendation is to WAIT for a better entry point that could provide a higher reward relative to the risk or adjust the target price if market conditions change to improve the potential reward.

EU trade breakdown 24th June 2x entryBreaking down two of my positions from Tuesday.
First entry was a very aggressive momentum entry on the flip of a M3 imbalance.
Second entry was fantastic and even though it lost - it was a good trade to take. We had HTF alignment as well as a strong London Low to trade away from.

EURUSD InsightHello to all our subscribers, and welcome!
Please share your personal opinions in the comments. Don’t forget to like and subscribe.
Key Points
- U.S. President Trump commented on the mutual tariff suspension deadline of July 9, saying, “We can do whatever we want. We could extend it, or shorten it,” leaving the door open for an extension.
- U.S. Treasury Secretary Scott Bessent stated that trade negotiations could be finalized by September 1, adding that agreements were nearing completion with more than 10 of the 18 major trading partners.
- President Trump noted that Canada is preparing to implement a digital tax, saying, “We will halt all trade discussions with Canada and within the next seven days inform them of the tariffs they must pay to operate in the U.S.”
- The U.S. Personal Consumption Expenditures (PCE) Price Index for May met expectations at 2.3% year-over-year, while the Core PCE Price Index slightly exceeded expectations at 2.7% year-over-year.
Key Economic Events This Week
+ June 30: U.K. Q1 GDP
+ July 1: Eurozone June CPI, Speech by Fed Chair Jerome Powell, U.S. JOLTS (Job Openings and Labor Turnover Survey)
+ July 2: U.S. June ADP Nonfarm Employment Change
+ July 3: U.S. June Nonfarm Payrolls, U.S. June Unemployment Rate
EURUSD Chart Analysis
The pair is showing a steep upward trend after breaking through a previous resistance level. Further upside potential appears to remain, with the next projected target area around the 1.18500–1.19000 range. However, there is currently a resistance zone in place, making it highly likely that a short-term dip may occur before the upward trend resumes.

EURUSD H4 I Bullish BounceBased on the H4 chart analysis, the price is falling toward our buy entry level at 1.1631, a pullback support.
Our take profit is set at 1.1745, a swing high resistance that aligns with the 161.8% Fib extension.
The stop loss is placed at 1.1582, an overlap support.
High Risk Investment Warning
Trading Forex/CFDs on margin carries a high level of risk and may not be suitable for all investors. Leverage can work against you.
Stratos Markets Limited (tradu.com ):
CFDs are complex instruments and come with a high risk of losing money rapidly due to leverage. 63% of retail investor accounts lose money when trading CFDs with this provider. You should consider whether you understand how CFDs work and whether you can afford to take the high risk of losing your money.
Stratos Europe Ltd (tradu.com ):
CFDs are complex instruments and come with a high risk of losing money rapidly due to leverage. 63% of retail investor accounts lose money when trading CFDs with this provider. You should consider whether you understand how CFDs work and whether you can afford to take the high risk of losing your money.
Stratos Global LLC (tradu.com ):
Losses can exceed deposits.
Please be advised that the information presented on TradingView is provided to Tradu (‘Company’, ‘we’) by a third-party provider (‘TFA Global Pte Ltd’). Please be reminded that you are solely responsible for the trading decisions on your account. There is a very high degree of risk involved in trading. Any information and/or content is intended entirely for research, educational and informational purposes only and does not constitute investment or consultation advice or investment strategy. The information is not tailored to the investment needs of any specific person and therefore does not involve a consideration of any of the investment objectives, financial situation or needs of any viewer that may receive it. Kindly also note that past performance is not a reliable indicator of future results. Actual results may differ materially from those anticipated in forward-looking or past performance statements. We assume no liability as to the accuracy or completeness of any of the information and/or content provided herein and the Company cannot be held responsible for any omission, mistake nor for any loss or damage including without limitation to any loss of profit which may arise from reliance on any information supplied by TFA Global Pte Ltd.
The speaker(s) is neither an employee, agent nor representative of Tradu and is therefore acting independently. The opinions given are their own, constitute general market commentary, and do not constitute the opinion or advice of Tradu or any form of personal or investment advice. Tradu neither endorses nor guarantees offerings of third-party speakers, nor is Tradu responsible for the content, veracity or opinions of third-party speakers, presenters or participants.

EURUSD JUNE MONTH DELIVERY & NFP week ideasEURUSD
JUNE MONTH DELIVERY
*June closes with a expansion/accumulation monthly candle
*Price wicked to the Weekly SIBI from sept 2021
*Price expanded to come just below the parent range .79 Premium
*Note since May 13 price has been in a buy program with little retrace
*Price is delivering to a Premium market taking key equal highs last week
June 27 DELIVERY
*Thursday into Friday price consolidates
*Asia takes minor equal lows
*2 London macro expands to the buy side
*small retrace
*6 macro starts the expansion cycle to send Price to take equal highs
*10 silver bullet price reverses Londons delivery taking minor sell side
*14:00 macro Price retraces to close rebalancing NY am delivery
*Price closes just above the 50 in a premium
NFP WEEK IDEAS
Deep premium with little retrace last week-over bought
*I suspect that we could see a retrace/reversal beginning of NFP week
*could we see price come to the current range 50 level 1.16037
*Note the EV is in a discount could price retrace to that target for the week
June 30 IDEAS
*Parent bias is bull stick to it this week
*Sundays delivery Price could retrace to minor equal highs at the .618
*Note Dealers range is already 32 pips-setting up for a potential larger expansion day
*watch out for a possible consolidation cycle Monday-typical profile is expansion but we will see with no news
*Sundays delivery could consolidation
*Watch for reaction at .618 at minor equal highs
*see if we swing for higher prices in Asia to London and lower in NY for Mondays suspected delivery-read what the chart prints this is just an idea-its not my gospel

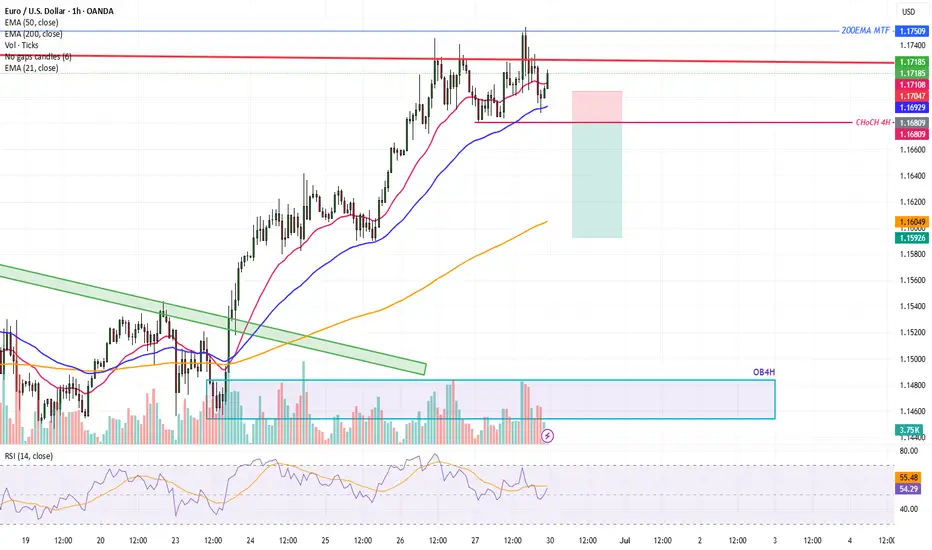
EURUSD Trade IdeaEURUSD is Bullish, on the weekly and daily time frame.
With RSI near the overbought region on the daily timeframe, there is a great probability that the trend perform a pull back to the support level @1.1590 zone.
If the trend break the CHocH at the 4Hr timeframe (body candle not wick), then will go short till 1.1600 level. If the news this coming week are in favor of the USD, we might see more drawdown till the Order block OB4H.
Let's be patient and watch the market carefully
Good Luck!
EURUSD What Next? SELL!
My dear friends,
My technical analysis for EURUSD is below:
The market is trading on 1.1716 pivot level.
Bias - Bearish
Technical Indicators: Both Super Trend & Pivot HL indicate a highly probable Bearish continuation.
Target - 1.1635
About Used Indicators:
A pivot point is a technical analysis indicator, or calculations, used to determine the overall trend of the market over different time frames.
Disclosure: I am part of Trade Nation's Influencer program and receive a monthly fee for using their TradingView charts in my analysis.
———————————
WISH YOU ALL LUCK

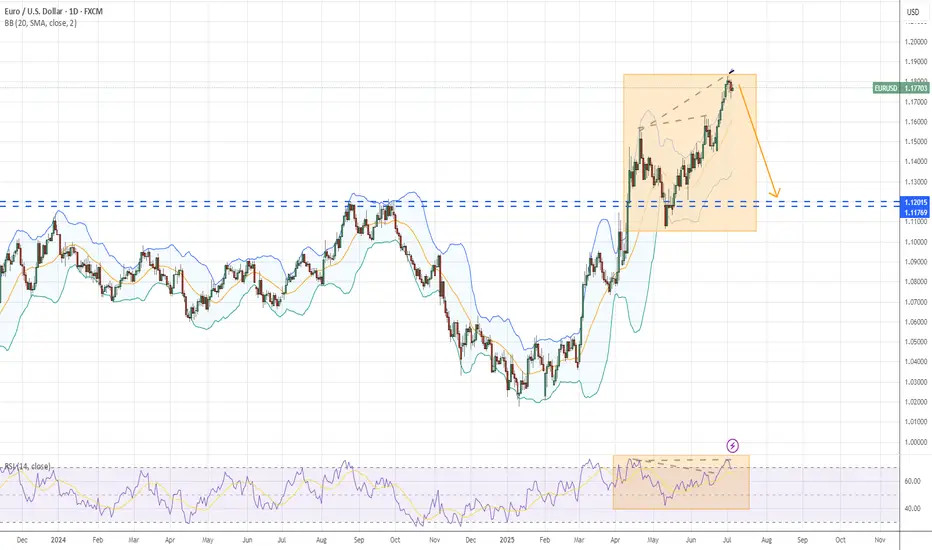
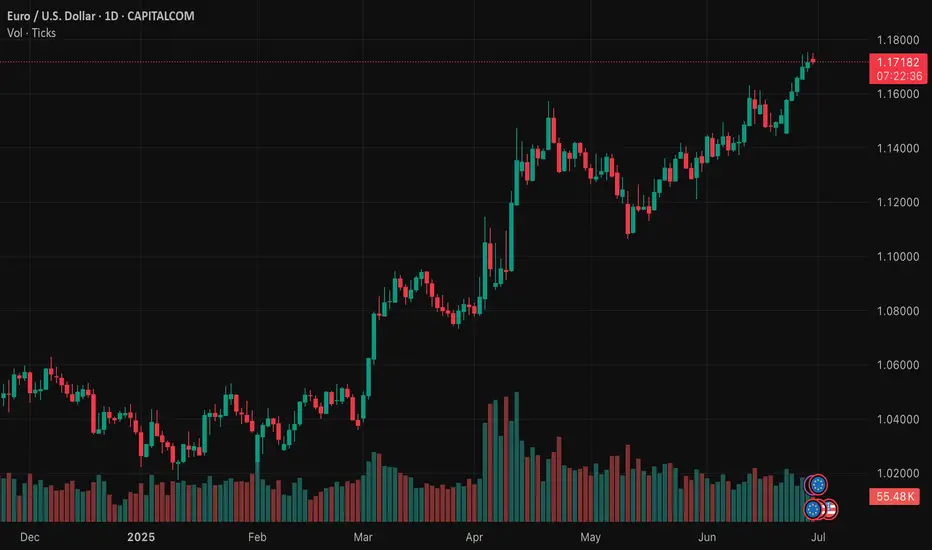
EUR/USD Daily Chart Analysis For Week of June 27, 2025Technical Analysis and Outlook:
In the course of this week's trading session, the Eurodollar has exhibited a strong rebound, successfully retesting and surpassing the Outer Currency Rally threshold of 1.163. Recent analyses suggest that the Euro is poised for further upward advancement, with the key target to reach the outer currency rally target of 1.177. Nonetheless, it is essential to recognize the possibility of a subsequent decline to the Mean Support level of 1.160 before a definitive upward movement.

EURUSD Elliott Wave Update: Upward Momentum ResumesThe EURUSD Elliott Wave sequence initiated from the September 2022 low reveals an incomplete bullish structure, signaling potential for further upside. A short-term rally from the May 29, 2025 low is currently unfolding as a five-wave impulse. As depicted in the 1-hour chart below, wave ((i)) peaked at 1.16319. A corrective wave ((ii)) followed which concluded at 1.14435. The internal structure of wave ((ii)) formed a zigzag pattern, with wave (a) declining to 1.1486 and wave (b) rebounding to 1.1614. Wave (c) completed the correction at 1.144, finalizing wave ((ii)) in the higher degree.
The pair has resumed its ascent in wave ((iii)), exhibiting an impulsive internal subdivision. From the wave ((ii)) low, wave i advanced to 1.1544, followed by a minor dip in wave ii to 1.1451. Wave iii surged to 1.1641, with a subsequent wave iv pullback ending at 1.1587. The final leg, wave v, culminated at 1.1745, completing wave (i) in the higher degree. A corrective wave (ii) pullback, likely a three-wave zigzag, appears to have concluded at 1.1678. However, a break above the wave (i) high at 1.1745 is required to negate the possibility of a double correction lower. Given the shallow nature of the wave (ii) pullback, the risk of a deeper correction remains. However, as long as the pivotal low at 1.144 holds, dips should attract buyers in 3, 7, or 11 swings, supporting further upside momentum.

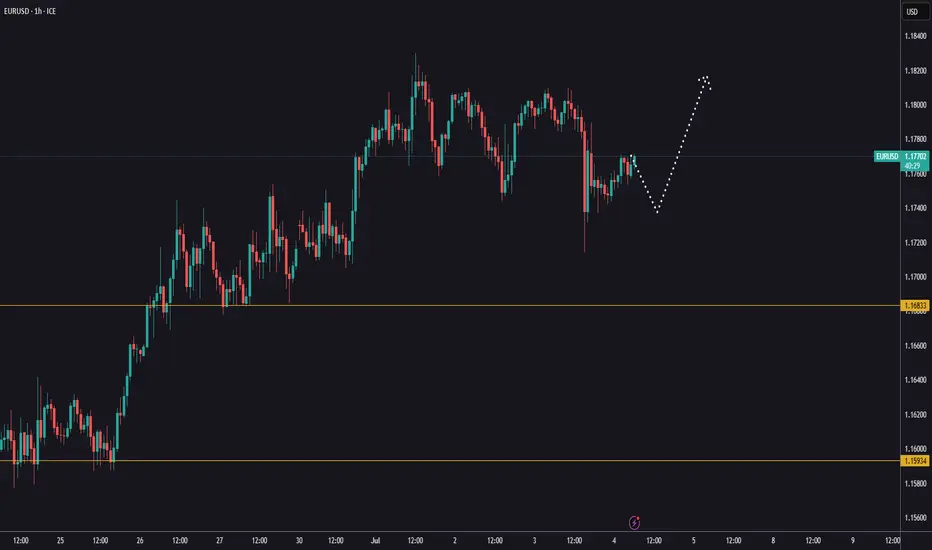
EURUSD Channel Up formed bottom. Heavily bullish.The EURUSD pair has been trading within a Channel Up since the May 12 Low. Today it hit its 4H MA100 (green trend-line) for the first time since May 12 and having just broken also above its 4H MA50 (blue trend-line), it confirmed that the pattern has already priced its bottom.
This is initiating the new Bullish Leg and based on the previous two, it should grow by at least +3.21%. We have a modest short-term Target at 1.1800.
-------------------------------------------------------------------------------
** Please LIKE 👍, FOLLOW ✅, SHARE 🙌 and COMMENT ✍ if you enjoy this idea! Also share your ideas and charts in the comments section below! This is best way to keep it relevant, support us, keep the content here free and allow the idea to reach as many people as possible. **
-------------------------------------------------------------------------------
Disclosure: I am part of Trade Nation's Influencer program and receive a monthly fee for using their TradingView charts in my analysis.
💸💸💸💸💸💸
👇 👇 👇 👇 👇 👇

EURUSD Will Go Down From Resistance! Short!
Here is our detailed technical review for EURUSD.
Time Frame: 2h
Current Trend: Bearish
Sentiment: Overbought (based on 7-period RSI)
Forecast: Bearish
The market is trading around a solid horizontal structure 1.177.
The above observations make me that the market will inevitably achieve 1.172 level.
P.S
We determine oversold/overbought condition with RSI indicator.
When it drops below 30 - the market is considered to be oversold.
When it bounces above 70 - the market is considered to be overbought.
Disclosure: I am part of Trade Nation's Influencer program and receive a monthly fee for using their TradingView charts in my analysis.
Like and subscribe and comment my ideas if you enjoy them!

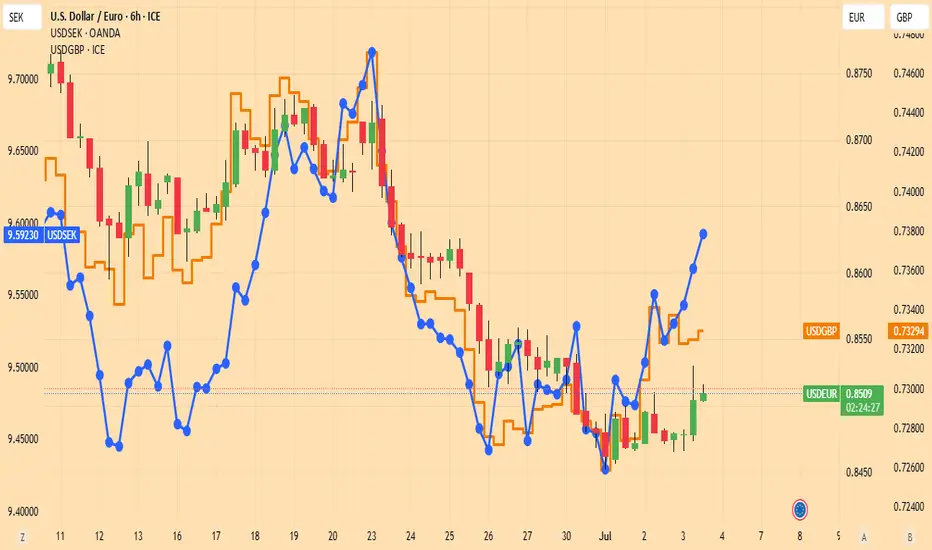
EURUSD should pull backLet us look at the comparative behavior of USDEUR, USDGBP and USDSEK.
Both USDSEK and USDGBP suggest that the Dollar has hit a through against European currencies.
The lines are creeping higher, so USDEUR is lagging.
Strategy : Sell EURUSD as long as USDSEK rises

#AN013: USD and AUD under pressure, Euro advances
1. India: New strategy on FX volatility
The Indian Respondents' Bank (RBI) is allowing more volatility on the USD/INR exchange rate, prompting many companies to hedge with forward contracts. This is the highest level of coverage since 2020.
We thank in advance our Official Broker Partner PEPPERSTONE who supported us in writing this article.
FX Impact:
Potential weakening of the rupee in the short term, but increased stability in the medium-long term.
Volatility on USD/INR, EUR/INR, JPY/INR ? opportunities for carry trades and short-term shorts if the dollar strengthens.
2. Australia hit by extreme storms
Severe storms hit New South Wales, Queensland and Victoria: 100 km/h winds, torrential rains and blackouts on over 30,000 homes.
Australian economic sentiment pressured ? AUD weak.
Opportunities on AUD/USD, AUD/JPY and AUD/NZD from a short perspective.
Monitor agricultural and insurance developments ? risk of extended downside.
3. Iran: Fordow nuclear site severely damaged
US strike hits Iranian nuclear site. In response, Iran has threatened to mine the Strait of Hormuz, a critical point for global oil transport.
Geopolitical volatility expected to rise.
Increased flows to safe haven currencies: JPY, CHF and USD.
Also impacting CAD and AUD due to oil ? risk of short-term upside but corrections if stalemate persists.
4. US $3.3 trillion fiscal package under discussion
Senate considering mega stimulus plan. This fuels fears of new debt ? dollar falls to 4-year low against euro.
EUR/USD long strengthened (break above 1.17 already underway).
GBP/USD and NZD/USD potentially in push.
Risk of FED rate cut? increased volatility on dollar and bonds.
Strategic Conclusion
Recommended operations: long on EUR/USD, short on AUD/USD, long on USD/INR (only with confirmation).
Watch out for the next 48 hours: possible spike on CHF, JPY and CAD.
Institutional timing: probable fund inflows on EUR and USD in case of confirmed breakouts; stay ready but avoid front-running.
Stay updated for other news.

EURUSD tested the Resistance level 1.17460 👀 Possible scenario:
On June 30, the euro (EUR) rose 0.15% to 1.17500, briefly reaching 1.17540—its highest level since September 2021—marking a 1.57% weekly gain, the strongest since May 19. The rally was driven by broad U.S. dollar weakness as markets adjusted to signs of slowing U.S. growth and subdued inflation, fueling expectations of a more dovish Federal Reserve. Meanwhile, resilient European data supported the euro.
On June 30, investors will closely monitor speeches from European Central Bank (ECB) officials for policy signals, with particular focus on President Christine Lagarde’s address at 5:00 p.m. UTC, which may provide key insights into the ECB’s monetary stance.
✅Support and Resistance Levels
Now, the support level is located at 1.15900
Resistance level is located at 1.17460
EURUSD BUY SETUP 1:5HELLO HOW ARE YOU ?
What i think about market ?
I Think the market will take liquidity
and will reach imbalance , then touch the supply area
and last will go up boooom
