eur usd bullish ideahope you have a green portfolio this is an idea based on trending lines and bullish flag pattern there is possibility that this happen today
EURUSD_SPT trade ideas

EURUSD – Smart Money Trap Setup in PlayPair: EURUSD
🔹 Timeframe: 30 Min
🔹 Bias: Bearish (Short Setup Expected)
🔹 Current Price: 1.17358
---
💡 Market Breakdown:
The pair is approaching a premium zone (1.17381 – 1.17567) where smart money may induce liquidity grabs before a sharp sell-off.
The structure shows a clear Break of Structure (BoS) followed by a Change of Character (Choch) confirming bearish intention.
---
📌 Key Zones:
🔵 Supply Zone: 1.17381 – 1.17567
🔺 Liquidity Sweep Zone (Fakeout Expected): 1.17400 – 1.17431
🔻 Target Zone 1: 1.17096
🔻 Target Zone 2: 1.16829
❌ Invalidation Above: 1.1760
---
🎯 Trade Plan:
Wait for price to tap into the red supply zone (1.174xx), then look for bearish confirmation like a strong rejection or engulfing candle.
Expect a fast drop after smart money traps buyers.
---
📌 Smart Money Concept Used:
🔹 Inducement → Entry → Expansion
🔹 BOS → CHoCH → Imbalance Fill
---
🧠 Remember:
"Price doesn’t move randomly — it’s engineered by intent."

EUR/USD Bears Maintain Control as ECB Caution Weigh on EuroTechnical Analysis
The EUR/USD 4-hour chart reflects ongoing bearish pressure after failing to sustain above the 1.17647 resistance zone, indicating sellers are currently dominating the market. The pair trades below the 20-period EMA (blue line), which is beginning to slope downwards, confirming short-term bearish momentum.
Price action remains beneath the middle Bollinger Band, emphasizing seller control over the near-term price direction. Recent candlesticks show multiple rejections from the 1.17164 level (61.8% Fibonacci retracement), indicating strong resistance and failed attempts to push higher. The overall momentum suggests a potential continuation of the downward move unless bullish momentum returns decisively.
Failure to hold the support near 1.16865 would expose the pair to deeper declines targeting the Fibonacci extension zones between 1.16650 and 1.16380 and possibly lower.
Alternative Scenario:
Conversely, a break and sustained close above 1.17164 (61.8% retracement) could trigger a short-term rebound, potentially challenging the 1.17647 resistance level.
Fundamental Outlook
ECB officials' speeches today will reinforce the cautious policy stance, maintaining rates steady amid external uncertainties.
US crude oil inventory reports and the Atlanta Fed GDPNow forecast will be key in assessing inflationary pressures and economic growth.
The FOMC meeting minutes release will be critical for signaling the Fed's future monetary policy intentions, which remain a key driver for the dollar’s strength.


EURUSD is moving within the 1.16850 -1.18310 range👀 Possible scenario:
The euro (EUR) dropped 0.6% on July 7 amid rising trade tensions and fading hopes for near-term rate cuts by the Federal Reserve. Market sentiment turned cautious after U.S. President Donald Trump announced new tariffs targeting 14 countries without trade deals, raising concerns over global trade disruption.
Major exporters like Japan and South Korea could face 25% tariffs if deals aren’t reached, while nations aligning with BRICS risk an extra 10% duty. With a quiet economic calendar on July 8, market volatility may ease, though investors remain alert to any trade policy shifts that could spark renewed market reaction.
✅Support and Resistance Levels
Now, the support level is located at 1.16850
Resistance level is located at 1.18310

EURUSD BUYI’m buying based on rejection of candle closure thus it didn’t confirm downside change . The market makers are still long on the euro and have been closing off their positions it swept early buyers so it should be smooth running from now .

EU| - Bullish Structure Intact | Watching for SSL Sweep and RunPair: EURUSD
Bias: Bullish
Timeframes: 4H, 2H, LTFs
• 4H structure is clean and bullish — momentum’s been steady, and the market looks ready to ride higher going into next week.
• 2H gives clarity — I’m watching for a sweep of SSL into OB to set the stage for LTF confirmation.
• Entry process remains the same: wait for CHoCH, followed by sweep inside the OB zone.
🔹 Entry: After CHoCH + sweep inside OB (LTF process repeated)
🔹 Entry Zone: After confirmation within OB
🔹 Target: Structure highs — letting price unfold with the trend
Mindset: Patience pays the most. Wait for the market to come to you, not the other way around.
Bless Trading!
After all the news EUR/USD confirmed its time to pullback looking at daily up side leg extansion, almost with no retracments , it has a lot of space to fall down at least to 50% fib level , london gave couple good entry points to the downside. but its friday manage your positions more aggresive , anything could happen today,but we are bearish for the next week

Bearish drop?EUR/USD is rising towards the resistance level which is a pullback resistance that lines up with the 50% Fibonacci retracement and could drop from this level to our take profit.
Entry: 1.1765
Why we like it:
There is a pullback resistance that lines up with the 50% Fibonacci retracement.
Stop loss: 1.1807
Why we like it:
There is a pullback support level.
Take profit: 1.1712
Why we like it:
There is a pullback support level.
Enjoying your TradingView experience? Review us!
Please be advised that the information presented on TradingView is provided to Vantage (‘Vantage Global Limited’, ‘we’) by a third-party provider (‘Everest Fortune Group’). Please be reminded that you are solely responsible for the trading decisions on your account. There is a very high degree of risk involved in trading. Any information and/or content is intended entirely for research, educational and informational purposes only and does not constitute investment or consultation advice or investment strategy. The information is not tailored to the investment needs of any specific person and therefore does not involve a consideration of any of the investment objectives, financial situation or needs of any viewer that may receive it. Kindly also note that past performance is not a reliable indicator of future results. Actual results may differ materially from those anticipated in forward-looking or past performance statements. We assume no liability as to the accuracy or completeness of any of the information and/or content provided herein and the Company cannot be held responsible for any omission, mistake nor for any loss or damage including without limitation to any loss of profit which may arise from reliance on any information supplied by Everest Fortune Group.

Bearish drop?The Fiber (EUR/USD) is rising towards the pivot and could drop to the 1st support which acts as a pullback support that is slightly below the 161.8% Fibonacci extension.
Pivot: 1.1768
1st Support: 1.1700
1st Resistance: 1.1816
Risk Warning:
Trading Forex and CFDs carries a high level of risk to your capital and you should only trade with money you can afford to lose. Trading Forex and CFDs may not be suitable for all investors, so please ensure that you fully understand the risks involved and seek independent advice if necessary.
Disclaimer:
The above opinions given constitute general market commentary, and do not constitute the opinion or advice of IC Markets or any form of personal or investment advice.
Any opinions, news, research, analyses, prices, other information, or links to third-party sites contained on this website are provided on an "as-is" basis, are intended only to be informative, is not an advice nor a recommendation, nor research, or a record of our trading prices, or an offer of, or solicitation for a transaction in any financial instrument and thus should not be treated as such. The information provided does not involve any specific investment objectives, financial situation and needs of any specific person who may receive it. Please be aware, that past performance is not a reliable indicator of future performance and/or results. Past Performance or Forward-looking scenarios based upon the reasonable beliefs of the third-party provider are not a guarantee of future performance. Actual results may differ materially from those anticipated in forward-looking or past performance statements. IC Markets makes no representation or warranty and assumes no liability as to the accuracy or completeness of the information provided, nor any loss arising from any investment based on a recommendation, forecast or any information supplied by any third-party.

EUR/USD timw to rebalance priceEUR/USD extended one side for long now , was huge buy pressure ,but it cant go forever one side, country economics would colapse. on this idea we have head and shoulders pattern on 1h time frame,plus extra confirmation of another low structure formed. now we wait to double tops get swept and we could look for short entrys , should be nice runnere to the short side

eurusd outlook Eurusd overall bullish HTF, however I do identify alignments within wyckoff distribution. Keeping an eye on the 4hr sponsored candle, ltf fvg at 1.62 area for my next possible bullish swing into the weekly high. Until then let's see if the market can support short term bearish reversal into the area of interest.

Hellena | EUR/USD (4H): LONG to the resistance area 1.18466.Dear colleagues, I believe that the upward movement continues. The five-wave impulse is not over yet, and I see that the price is now in the upward wave “3” of the higher order and in the upward wave “3” of the lower order.
Therefore, I expect a small correction to the 1.16165 area, after which I expect the price to reach at least the 1.18466 resistance area.
Manage your capital correctly and competently! Only enter trades based on reliable patterns!

Bullish bounce off pullback support?EUR/USD is falling towards the support level which is a pullback support that aligns with the 38.2% and the 61.8% Fibonacci retracement and could bounce from this level to our take profit.
Entry: 1.1742
Why we like it:
There is a pullback support level that lines up with the 38.2% and the 61.8% Fibonacci retracement.
Stop loss: 1.1698
Why we like it:
There is a pullback support that is slightly below the 50% Fibonacci retracement.
Take profit: 1.1814
Why we like it:
There is a pullback resistance.
Enjoying your TradingView experience? Review us!
Please be advised that the information presented on TradingView is provided to Vantage (‘Vantage Global Limited’, ‘we’) by a third-party provider (‘Everest Fortune Group’). Please be reminded that you are solely responsible for the trading decisions on your account. There is a very high degree of risk involved in trading. Any information and/or content is intended entirely for research, educational and informational purposes only and does not constitute investment or consultation advice or investment strategy. The information is not tailored to the investment needs of any specific person and therefore does not involve a consideration of any of the investment objectives, financial situation or needs of any viewer that may receive it. Kindly also note that past performance is not a reliable indicator of future results. Actual results may differ materially from those anticipated in forward-looking or past performance statements. We assume no liability as to the accuracy or completeness of any of the information and/or content provided herein and the Company cannot be held responsible for any omission, mistake nor for any loss or damage including without limitation to any loss of profit which may arise from reliance on any information supplied by Everest Fortune Group.

EUR/USD Weekly – Two Long Setups Hello guys!
It is my perspective on eurusd!
Before we even reach the major resistance zone around 1.2050–1.2100, I’ve highlighted two long-term opportunities that may unfold as the price continues to climb.
✔ First Long Position:
It looks like a more conservative entry. The price is already above it. You can set a pending position!
It was likely aiming to catch the momentum as the price broke above the previous structure.
TP is near the descending trendline, around 1.2050–1.2100. a smart place to exit before major resistance hits.
✔ Second Long Position:
Positioned slightly lower. probably in case of a pullback or retest into the broken zone.
This one offers better risk-reward, but requires patience and a cleaner retracement.
Both longs are short-to mid-term swing ideas, aiming to ride the bullish leg into the bigger trendline rejection zone, where I’d personally be more cautious or even look for reversal setups.

EURUSD , WThe EUR/USD reached the top of the channel on the weekly frame, and I think it's a good time to sell.
Also, the RSI had enough buying.
FIRST TARGET: 1.12100
This is what I expected.It is not a buy or sell recommendation.
Good luck.

EUR/USD 4H Chart Pattern, here's the analysis..Looking at My EUR/USD 4H Chart Pattern, here's the analysis:
Current Price:
Around 1.1819
Observations:
Price is moving inside an ascending channel
Breakout from the upper channel line is happening
Ichimoku Cloud shows bullish momentum as price is well above the cloud
---
Target Levels:
✅ First Target Zone: 1.1900 - 1.1950
✅ Final Target Zone: 1.2000 - 1.2020 (as marked on your chart)
---
Notes:
Watch for strong breakout confirmation above 1.1850
If momentum continues, price can reach 1.2000
Use stop-loss below 1.1750 to manage risk
---
If you want, I can help suggest stop-loss, entry, and risk management in detail. Let me know!

EURUSD Selling from Resistance at 1.17500 EURUSD Analysis –
4H Timeframe
The pair continues to respect its ascending channel, but current price action suggests a potential sell opportunity from the 1.17500 resistance zone.
🎯 Technical Targets:
🔻 1st Target – 1.16000 (Key demand zone)
🔻 2nd Target – 1.14500 (Deeper support area)
🔻 3rd Target – 1.12500 (Bullish Order Block)
💡 Watch for confirmation signals near resistance before entering shorts.
💬 Like, follow, comment, and join us for more real-time trade ideas and updates!
📲 Let’s grow and trade smart together 💼✨
— Livia 😜

EUR/USD Long Setup — Breakout Retest Play
We’re seeing a classic breakout-retest scenario on EUR/USD. After breaking above the previous consolidation zone, price has pulled back to retest the broken structure near 1.1495, which also aligns with a higher time frame support zone.
🟦 Entry Zone: 1.1495–1.1490
🔴 Stop Loss: Below 1.1420 (clearly outside the structure)
🟩 Targets (Partial TPs):
1.1655
1.1775
1.1888–1.1894 (final)
📌 Plan:
This is a trend continuation idea after a clean structural breakout. If you plan to enter this, consider:
✅ Scaling in at or near current price
✅ Partial TP at each resistance level
❌ Avoid holding full position till final target — secure profits along the way
✅ Use proper risk management and size
⚠️ Important Note
This is not a signal, just an idea.
I am not selling signals or subscriptions.
If you're new, you may think:
“Let me just follow someone with 100K followers and I’ll profit.”
Truth is — follower count means nothing. Many signal sellers don’t even trade. They sell subscriptions, not setups.
🧠 Pro Tip for Beginners
Track 30–40 trade ideas from different users (including old ones — they often hide losers). Ask yourself:
Was the direction right?
Was the entry filled?
Was the setup realistic?
That’s how you’ll grow as a trader.
Trade smart, protect your capital, and stay sharp.
Rendon1

EUR/USD: A Perfect Storm for BullsThis is a high-conviction long setup based on a powerful combination of macroeconomic divergence and a confirmed multi-year technical breakout.
The Non-Farm Payrolls report has now been released, and the resulting price dip has created what I believe is an ideal entry opportunity to align with the dominant bullish trend.
The Fundamental Why 📰
NFP Aftermath: Yesterday's NFP report was a mixed bag that ultimately reinforces the case for Fed rate cuts. The headline number beat expectations, causing an initial USD rally and a dip in EUR/USD. However, the underlying details like wage growth were soft. Crucially, the market continues to price in a 96% probability of a Fed rate cut by September, a figure that was unchanged by the data. The core driver of USD weakness—a dovish Fed—remains firmly intact.
Resilient EUR 🇪🇺: In contrast, the ECB has signaled it is at or near the end of its easing cycle. Economic data from core Eurozone countries is stabilizing, providing the Euro with relative strength.
Risk-On Sentiment 💹: The broader market remains in a "risk-on" mood, which is typically negative for the safe-haven USD. Gold is soaring and equities are near all-time highs, confirming the anti-dollar flow.
The Technical Picture 📊
The Secular Breakout 🚀: The most significant event is the breakout of a decade-long downtrend resistance line. This is a major structural shift. The pair has also achieved a monthly and quarterly close above the critical 1.1500 handle, turning a historic resistance level into a new support floor.
The Impulsive Uptrend 🌊: On the 4-hour chart, the price is in a clear ascending channel. The post-NFP dip represents a healthy correction within this uptrend, bringing price back toward key support.
Key Levels 🔑:
Support Zone: The dip has brought price directly into the key support confluence between 1.1700 and 1.1760, making this an ideal area to enter long.
Resistance Zone: Major resistance still sits at 1.1900, making it a prudent take-profit target.
Strategy & Risk Management 🧠
The stronger-than-expected NFP headline has provided the exact pullback this strategy was designed for. The dip presents a prime opportunity to buy into the dominant uptrend at a more favorable price. Instead of chasing the market, we are now positioned to enter on a technically sound correction.
Good luck, and trade safe!
Trade Parameters ✅
Pair: EUR/USD
Direction: Long / Buy 🟢
Entry Type: Limit Order
Entry Price: 1.1745
Stop-Loss: 1.1685 (60 pips) 🔴
Take-Profit: 1.1895 (150 pips) 🎯
Risk/Reward Ratio: 2.5 : 1

EURUSD may uptrend for a few yearThe breakout on monthly timeframe seem almost fully close.
And that continue happen, EURUSD might have a few year of uptrend.

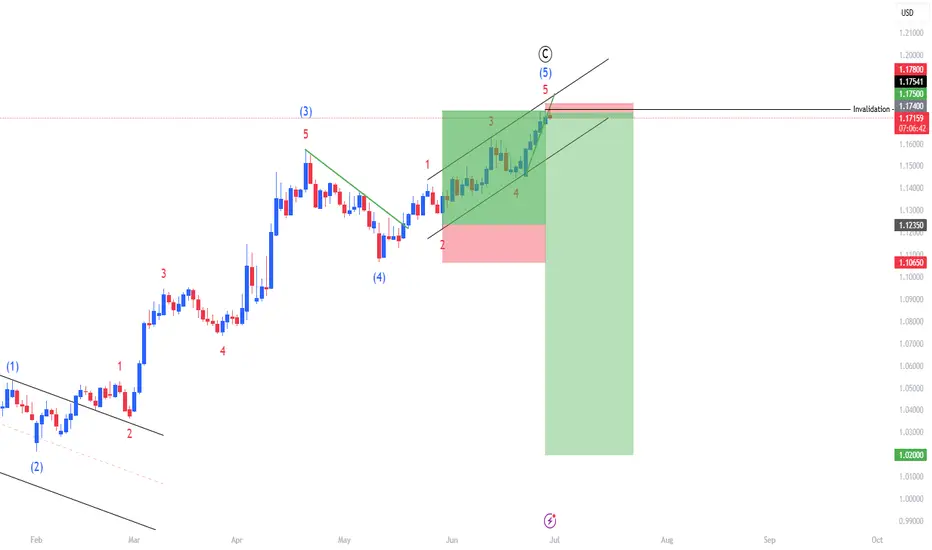
EURUSD - Eur bull run over??Completed Elliott Wave Structure:
• The chart displays a full 5-wave impulsive Elliott Wave count to the upside, labeled (1) through (5), completing a wave C.
• This suggests the end of a corrective ABC pattern, which often marks the end of a bullish retracement or rally within a larger downtrend.
Price Reaches Resistance Zone:
• The price reaches a previous high/resistance area marked by the top of the wedge and completes the fifth wave.
• This is typically where institutional traders may look to take profits or enter short positions.
Risk-Reward Set Up Suggests Short Bias:
• The chart includes a bearish risk-reward trade setup, indicating the trader expects a decline.
• The stop loss is placed slightly above the peak of wave 5, and the take profit is much lower, giving a favorable risk-to-reward ratio in anticipation of a significant move down.
Structure Confluence:
• The top of wave (5) aligns with the trendline resistance from the rising wedge formation, adding technical confluence to the bearish outlook.
⸻
Conclusion
With a completed Elliott Wave count, bearish chart pattern (rising wedge), technical resistance, and a well-defined short setup, the chart strongly suggests that a major top may be in place for EUR/USD, and a downside move is likely to follow.
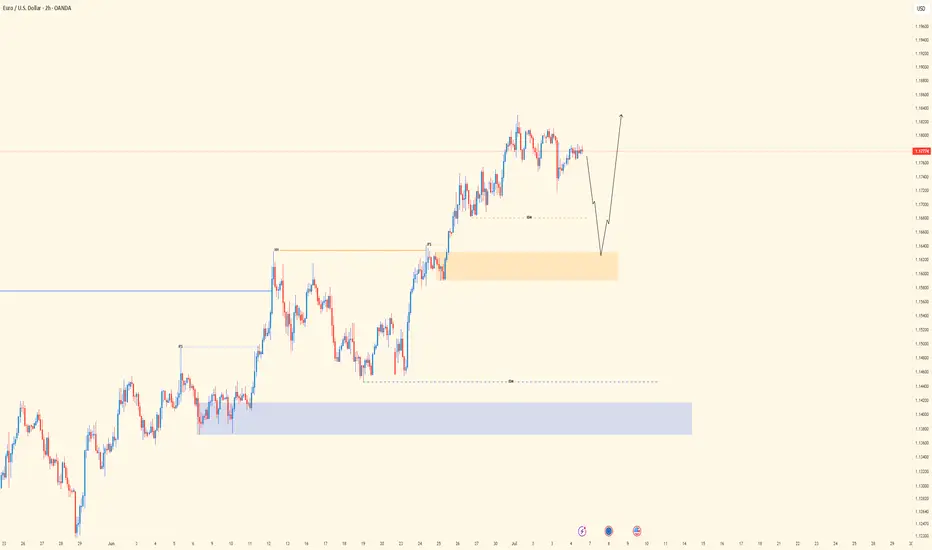
EUR/USD - Liquidity grabbed! Move towards the 4H FVG next?This chart illustrates a short-term bearish outlook on the EUR/USD currency pair, using smart money concepts like liquidity grabs, fair value gaps (FVGs), and structural levels such as support and protected lows. It is based on the 1-hour timeframe and references a higher timeframe (4H) for added confluence.
Liquidity Sweep
At the top of the recent price movement, a "Liquidity sweep" is marked, suggesting that the market pushed above recent highs to trigger stop-losses of short positions or entice breakout traders before reversing. This kind of move is common in smart money concepts and typically precedes a directional shift, which in this case, is anticipated to be downward. This sweep likely removed buy-side liquidity and indicates that institutional traders may now seek to target sell-side liquidity below recent lows.
Support Zone
The green shaded area labeled "Support" represents a previous consolidation or demand zone that temporarily held price after the liquidity sweep. This zone is seen as a short-term reaction point where price may consolidate or bounce slightly before continuing lower. However, the dashed black line projection suggests that this support is not expected to hold long-term, as price is forecasted to break below it.
Protected Low
A previous low is labeled "Protected low," implying that it hasn’t been violated during recent downward moves. This term often refers to a structural level that, if broken, confirms a shift in market structure. In this context, the projection anticipates that price will break below this protected low, indicating a bearish intent and unlocking further downside movement.
4H Fair Value Gap (FVG)
The large blue zone labeled "4H FVG" marks an imbalance or inefficiency on the 4-hour chart. This zone is referred to as a "Strong bullish 4h FVG," suggesting that once the sell-side liquidity is taken and the lower targets are met, this area is expected to act as a high-probability demand zone. Institutional traders often look for price to fill these FVGs before reversing, as they represent unmitigated institutional orders. The projected path implies that this is the ultimate downside target where price may react bullishly.
Conclusion
Overall, this analysis outlines a bearish short-term scenario for EUR/USD. After sweeping liquidity above recent highs, price is expected to respect the bearish order flow, break through the current support level, and move below the protected low. The ultimate downside target lies within the strong 4H FVG, where a significant bullish reaction might occur. This suggests a classic smart money play, manipulate (sweep liquidity), shift (break structure), and mitigate (return to FVG)—offering a well-structured trade idea for both intraday and swing traders.
Disclosure: I am part of Trade Nation's Influencer program and receive a monthly fee for using their TradingView charts in my analysis.
Thanks for your support.
- Make sure to follow me so you don't miss out on the next analysis!
- Drop a like and leave a comment!
