EUR/USD - Liquidity grabbed! Move towards the 4H FVG next?This chart illustrates a short-term bearish outlook on the EUR/USD currency pair, using smart money concepts like liquidity grabs, fair value gaps (FVGs), and structural levels such as support and protected lows. It is based on the 1-hour timeframe and references a higher timeframe (4H) for added confluence.
Liquidity Sweep
At the top of the recent price movement, a "Liquidity sweep" is marked, suggesting that the market pushed above recent highs to trigger stop-losses of short positions or entice breakout traders before reversing. This kind of move is common in smart money concepts and typically precedes a directional shift, which in this case, is anticipated to be downward. This sweep likely removed buy-side liquidity and indicates that institutional traders may now seek to target sell-side liquidity below recent lows.
Support Zone
The green shaded area labeled "Support" represents a previous consolidation or demand zone that temporarily held price after the liquidity sweep. This zone is seen as a short-term reaction point where price may consolidate or bounce slightly before continuing lower. However, the dashed black line projection suggests that this support is not expected to hold long-term, as price is forecasted to break below it.
Protected Low
A previous low is labeled "Protected low," implying that it hasn’t been violated during recent downward moves. This term often refers to a structural level that, if broken, confirms a shift in market structure. In this context, the projection anticipates that price will break below this protected low, indicating a bearish intent and unlocking further downside movement.
4H Fair Value Gap (FVG)
The large blue zone labeled "4H FVG" marks an imbalance or inefficiency on the 4-hour chart. This zone is referred to as a "Strong bullish 4h FVG," suggesting that once the sell-side liquidity is taken and the lower targets are met, this area is expected to act as a high-probability demand zone. Institutional traders often look for price to fill these FVGs before reversing, as they represent unmitigated institutional orders. The projected path implies that this is the ultimate downside target where price may react bullishly.
Conclusion
Overall, this analysis outlines a bearish short-term scenario for EUR/USD. After sweeping liquidity above recent highs, price is expected to respect the bearish order flow, break through the current support level, and move below the protected low. The ultimate downside target lies within the strong 4H FVG, where a significant bullish reaction might occur. This suggests a classic smart money play, manipulate (sweep liquidity), shift (break structure), and mitigate (return to FVG)—offering a well-structured trade idea for both intraday and swing traders.
Disclosure: I am part of Trade Nation's Influencer program and receive a monthly fee for using their TradingView charts in my analysis.
Thanks for your support.
- Make sure to follow me so you don't miss out on the next analysis!
- Drop a like and leave a comment!
EURUSD_SPT trade ideas

Bullish rise?The Fiber (EUR/USD) has reacted off the pivot and could rise to the 1st resistance.
Pivot: 1.1578
1st Support: 1.1278
1st Resistance: 1.1909
Risk Warning:
Trading Forex and CFDs carries a high level of risk to your capital and you should only trade with money you can afford to lose. Trading Forex and CFDs may not be suitable for all investors, so please ensure that you fully understand the risks involved and seek independent advice if necessary.
Disclaimer:
The above opinions given constitute general market commentary, and do not constitute the opinion or advice of IC Markets or any form of personal or investment advice.
Any opinions, news, research, analyses, prices, other information, or links to third-party sites contained on this website are provided on an "as-is" basis, are intended only to be informative, is not an advice nor a recommendation, nor research, or a record of our trading prices, or an offer of, or solicitation for a transaction in any financial instrument and thus should not be treated as such. The information provided does not involve any specific investment objectives, financial situation and needs of any specific person who may receive it. Please be aware, that past performance is not a reliable indicator of future performance and/or results. Past Performance or Forward-looking scenarios based upon the reasonable beliefs of the third-party provider are not a guarantee of future performance. Actual results may differ materially from those anticipated in forward-looking or past performance statements. IC Markets makes no representation or warranty and assumes no liability as to the accuracy or completeness of the information provided, nor any loss arising from any investment based on a recommendation, forecast or any information supplied by any third-party.

RSI Flashes Warning on EURUSD: Critical Level Under Watch!Good morning traders,
If the EURUSD pair breaks below the 1.16729 level due to an RSI divergence, the next potential target could be around 1.16093.
Keep in mind that a break below 1.16729 may also signal a potential trend reversal.
I've marked the pivot points for you on the chart for better clarity.
Additionally, it's crucial to keep an eye on current economic data and news releases as part of your fundamental analysis.
I meticulously prepare these analyses for you, and I sincerely appreciate your support through likes. Every like from you is my biggest motivation to continue sharing my analyses.
I’m truly grateful for each of you—love to all my followers💙💙💙

Trading Recommendations and Analysis for EUR/USDOn the weekly chart, the price is approaching the upper boundary of the price channel, around the 1.1822 mark, from which a reversal of the entire trend may occur.
A divergence with the Marlin oscillator is ready for immediate formation. If the price breaks above the channel line, it will most likely be a false false breakout, invalidating the channel. Only a weekly candle close above the specified level, accompanied by the oscillator rising above the previous peak, would significantly complicate the technical picture for a trend reversal.
On the daily chart, a possible target in the event of a breakout above 1.1822 is the 1.1905 level - the resistance from 1.1822 is the 1.1905 level - the resistance from July - August 2021. On the four - hour chart, the Marlin oscillator does not support the price's bullish momentum.
For now, the trend remains upward, but we are preparing for a possible shift. The Nonfarm Payrolls, Independence Day, and "Liberation Day" (new tariffs) are just around the corner. Donald Trump may have a surprise in store.

NFP Bears gathering their troops? or will the Bulls stampede...The past 9 days have been quite interesting for the EUR/USD which has been relentless. Price has been rising like a helium balloon let loose at the park...
Bulls have clearly been in control, not only the past 9 days but since the beginning of the year with the exception of the strong pullback in April & May only to bounce for another 700 pip run.
I am totally USD bearish across the board as I have been mentioning in my analysis videos for the past few months but like all macro moves, we always have pullbacks along the way and that is why I have been shorting the EUR/USD back from 1.1500+ - 1.1700+
I've given this a lot of room to breathe, more than usual but considering the following technical setup, I'm willing to give the Bears some leeway and potentially show me they'll come through.
•Rising Broadening pattern (Where two trendlines start close together only to divergence and expand) - This is a bearish pattern.
•Negative Divergence on the MACD, Linear Regression & the RSI.
•Price has made a run to the yearly R3 pivot level. (Rare extension)
•Last daily candle is a hanging man candlestick (Reversal candle)
•Weekly chart has the EUR/USD at the upper band of a polynomial regression channel which calculates for price extremities in the market.
There are a few more setups as well but it's too much to describe here and I'd have to show it in a video (Which I plan to do over the weekend)
With all of that said... It could all fail lol but seriously speaking... You just can't ask for a better probabilistic setup so whatever happens during NFP... happens.
Aside from the technical aspect... I know yearly R2 around 1.1600 was a hotspot for shorts because divergence was at the early stages and taking a short there wouldn't have been a bad idea but we know institutions are in play as well, so above 1.1600 could have been a huge area to run stop losses and margin calls before a potential reversal.
250 pips would be enough to run a large pool of stops and liquidation.
IF price is going to reverse here during NFP, I believe late longs and breakout/pullback traders are going to try and buy at the trendline at 1.1660ish but it wont hold and trap them on the other side of the trade.
Under that, I can see us pulling back towards 1.1200ish...
If the Bears give up and price continues to climb... the original macro target may very well be under way which was 1.2000 - 1.2200 (Based on a Monthly and 3-Month chart analysis)
As of this writing the EUR/USD is pretty much completely flat which is expected before the NFP fireworks ahead of July 4th.
We'll see what happens tomorrow morning! buckle up!
As always, Good luck and Trade Safe! See you post NFP.

SHORT ON EUR/USDEU has given a nice bearish setup with a rising channel.
I will be selling EU to the next demand level looking to catch 200-300 pips.

Master Your Edge: It’s Not About Just Being Right
Most traders obsess over being right on every trade. But the truth is, consistent profitability doesn’t come from perfect predictions—it comes from disciplined risk management.
Mark Douglas reminds us:
“Trading is not about being right or wrong. It’s about how much you make when you’re right and how much you lose when you’re wrong.”
Focus less on proving yourself right, and more on protecting your capital when you’re wrong. That’s how professionals thrive in uncertain markets.
#MJTrading
#TradingPsychology #MarkDouglas #ForexMindset #TraderMindset #EURUSD #TradingQuotes #ForexLife #RiskManagement #TradingDiscipline #ForexEducation #ChartOfTheDay #PriceAction #MindOverMarkets
EURUSD Bullish Momentum EUR/USD is expected to resume its bullish trend after a brief consolidation. The market is likely to gain bullish momentum from the 1.17007 – 1.17507 support zone, potentially targeting the 1.20285 level in the next upward move

Market Re-Cap and Outlook for NEXT WEEKHere I am giving you a little insight as to what trades I am currently in, taken & looking to take for the week just gone and the week coming.
1 Winning trade on EU
1 Current open position on EU
EURGPB - Breakdown
AUDUSD - Breakdown
NZDUSD - Breakdown
Gold - Breakdown
If there are any pairs you would like me to share my feedback on give me a message and I will be happy to try and do so.
Thanks
Happy Hunting

EURUSD: Support & Resistance Analysis for Next Week 🇪🇺🇺🇸
Here is my latest structure analysis
and important supports & resistances for EURUSD for next week.
Consider these structures for pullback/breakout trading.
❤️Please, support my work with like, thank you!❤️
I am part of Trade Nation's Influencer program and receive a monthly fee for using their TradingView charts in my analysis.

eurusd Sell Time now or 7:00 o clockEURUSD, now its time for new mareket structur shift and entry
because in hightimeframe its market structur ,
1:5 ose 1:3
price market structur shift or keep ob bearish and sell

EURUSD Short, 03 JuneHTF shows clear Bearish OBs on both W and D, with doji & hammer formations hinting at buyer exhaustion. Expecting a pullback into imbalance below.
On LTF, we’ve had a clean BOS in Asia, followed by a retrace into the last 15m extreme OB – an ideal scenario for forming a new lower high in the ongoing bearish trend.
📉 Entry: 1m BOS + reaction from 15m POI
🧩 Confluence: Asia BOS, LTF structure, DXY alignment
🎯 TP: Asia Low (less than 3RR), potential to run further into HTF imbalance
🛡️ Context: All factors align – HTF bias, LTF trend, and precise entry logic.
A textbook continuation play – if we’re going to turn, this is the zone to do it.

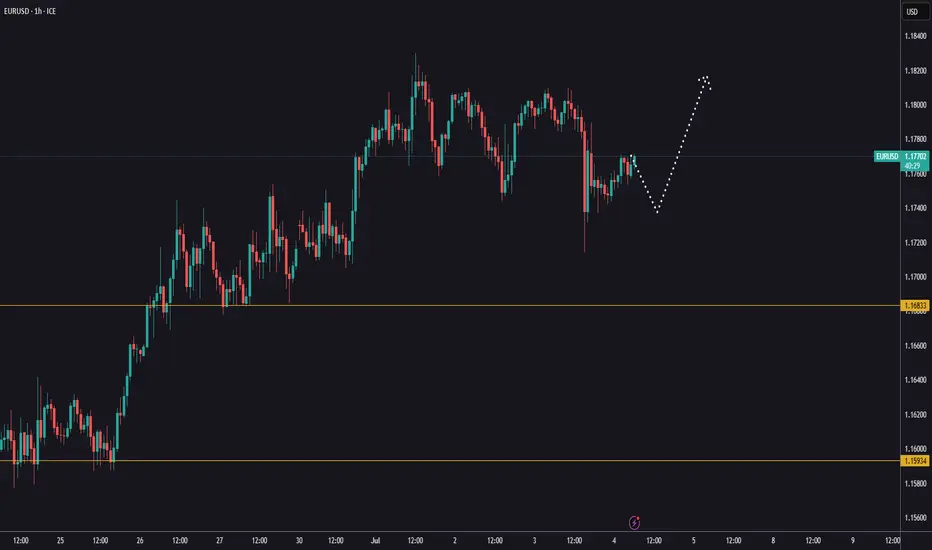
EURUSD after the NFPYesterday, EURUSD pulled back to 1,1714.
Today is likely to be a calmer day on the markets, with no major swings expected.
Avoid rushing into new positions or using large lot sizes.
The uptrend on EURUSD remains intact, and we’ll be watching for new buying opportunities again next week.
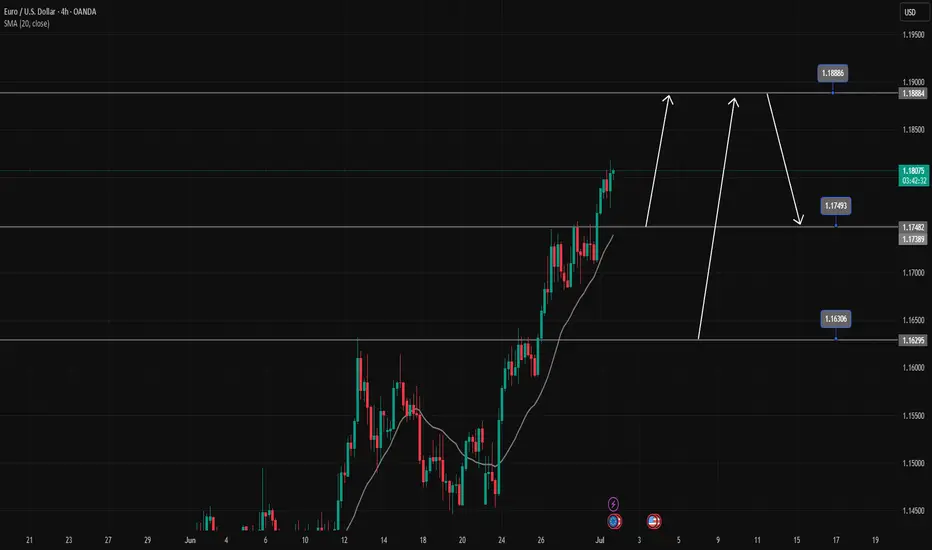
EURUSD is in a strong uptrendEURUSD is in a strong uptrend, Price just broke the resistance zone of 1.175.
All the bullish momentum is heading towards the resistance zone of 1.188.
If there is a close of the h4 candle below the resistance zone of 1.175, there will likely be a Pullback to 1.163 to find more buying momentum towards the target at the resistance zone of 1.188
📈 Key Levels
Support: 1.175-1.163
Resistance: 1.188
📊 Recommended Trade Setups
BUY EURUSD 1.175-1.173 Stoploss 1.170
BUY EURUSD 1.163-1.161 Stoploss 1.158
SELL EURUSD 1.188-1.190 Stoploss 1.1930
EURUSD Bullish Setup: Watching for a Break and Retest📈 Looking at EURUSD right now, we’re in a strong bullish structure 🔼 — but it’s clearly overextended 🚀
As we head into the end of the week, there’s still potential for more upside today ⬆️ — but ⚠️ be cautious, since Fridays often bring retracements as we move into the weekly close 🕒📉
🔍 I’m watching for a bullish opportunity if we get a break above the current equal highs, followed by a retest and failure to break back below 🧠📊
If that setup doesn’t materialize, we’ll simply step aside and abandon the idea 🚫
💬 Not financial advice — always trade at your own risk.

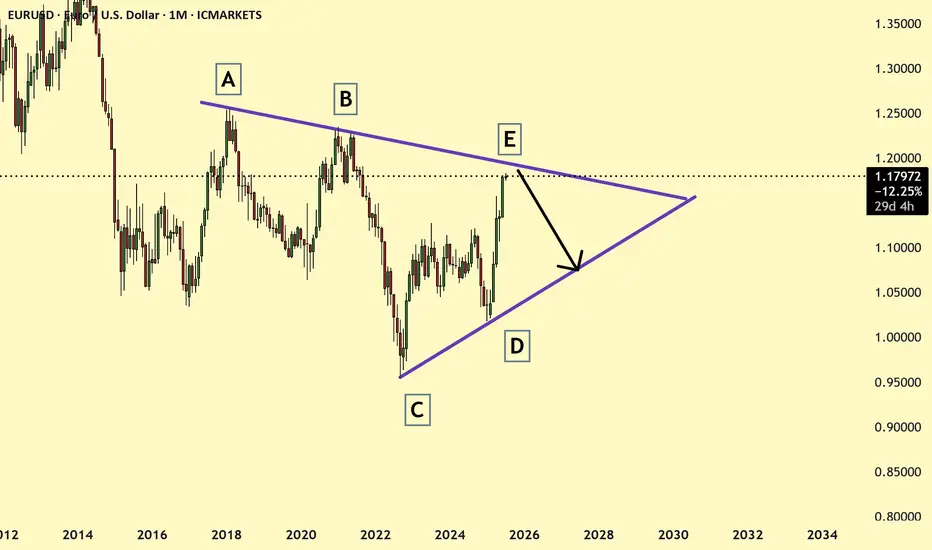
EURUSD monthly pattern shows symmetrical triangle resistance ! EURUSD monthly pattern showing price reaching the symmetrical triangle resistance and currently price is nearing the resistance and may soon the price may reverse and look for the reversal on 4 hr or daily charts.
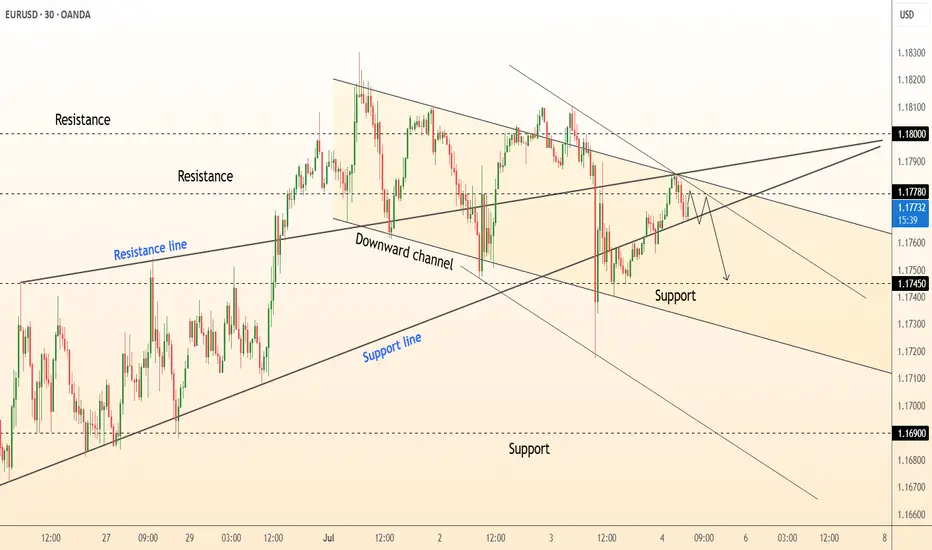
DeGRAM | EURUSD downturn in the channel📊 Technical Analysis
● Price is capped by a confluence of the June-July down-sloping channel roof and the former median resistance line at 1.1780; the last three candles form lower highs inside a micro bear-flag.
● Intraday structure now leans on the 1.1745–1.1750 support cluster: a break beneath this shelf completes the flag and exposes the channel floor/June pivot at 1.1690.
💡 Fundamental Analysis
● Pre-NFP dollar demand is rebuilding as ADP and ISM-services beat consensus, while French election uncertainty revives euro risk premium.
✨ Summary
Sell 1.1775 ± 5 pips; sustained trade below 1.1745 targets 1.1690. Short thesis void if 30-min candle closes above 1.1800.
-------------------
Share your opinion in the comments and support the idea with a like. Thanks for your support!
EURUSD Will Go Down From Resistance! Short!
Here is our detailed technical review for EURUSD.
Time Frame: 2h
Current Trend: Bearish
Sentiment: Overbought (based on 7-period RSI)
Forecast: Bearish
The market is trading around a solid horizontal structure 1.177.
The above observations make me that the market will inevitably achieve 1.172 level.
P.S
We determine oversold/overbought condition with RSI indicator.
When it drops below 30 - the market is considered to be oversold.
When it bounces above 70 - the market is considered to be overbought.
Disclosure: I am part of Trade Nation's Influencer program and receive a monthly fee for using their TradingView charts in my analysis.
Like and subscribe and comment my ideas if you enjoy them!

EUR/USD Wave 5 Topped? Correction Incoming to 1.076FX_IDC:EURUSD PEPPERSTONE:EURUSD OANDA:EURUSD
📈 Chart Breakdown
🔢 Elliott Impulse Wave Completed:
Waves (1) to (5) appear to form a clean 5-wave impulse structure upward.
Final wave (5) is diverging on the oscillator (RSI), signaling potential bullish exhaustion.
🧾 ABC Correction Expected:
After the 5-wave impulse, you project an ABC corrective move:
Wave A: initial drop
Wave B: partial recovery
Wave C: deeper move likely toward the 1.07680 support (blue horizontal line)
⚠️ Bearish RSI Divergence:
The label "Div" confirms bearish divergence between price and RSI → typical at end of Wave (5).
🧠 Summary:
Structure: 5-wave impulse + projected 3-wave correction
Bias: Short-term bearish targeting 1.07680
Confirmation: Look for break below support or trendline + momentum shift

EURUSD 30Min Engaged ( Bullish Entry Detected )————-
➕ Objective: Precision Volume Execution
Time Frame: 30-Minute Warfare
Entry Protocol: Only after volume-verified breakout
🩸 Bullish Wave Coming From : 1.18050
➗ Hanzo Protocol: Volume-Tiered Entry Authority
➕ Zone Activated: Dynamic market pressure detected.
The level isn’t just price — it’s a memory of where they moved size.
Volume is rising beneath the surface — not noise, but preparation.
🔥 Tactical Note:
We wait for the energy signature — when volume betrays intention.
The trap gets set. The weak follow. We execute.
#EURUSD:Expecting A Strong Bull Move, Two Entries | Two TargetsIn our previous analysis, we clearly stated that the price would remain bullish as the DXY had to plummet, and it did exactly that, rising by 450 pips from our last entry. Currently, we have two areas from which we can see the price reversing. The first one is nearby and has a higher risk compared to our second entry, which may be safer for some traders. We need a strong confirmation before making any significant decisions.
Good luck and trade safely. We wish you the best in your trading journey.
Team Setupsfx_

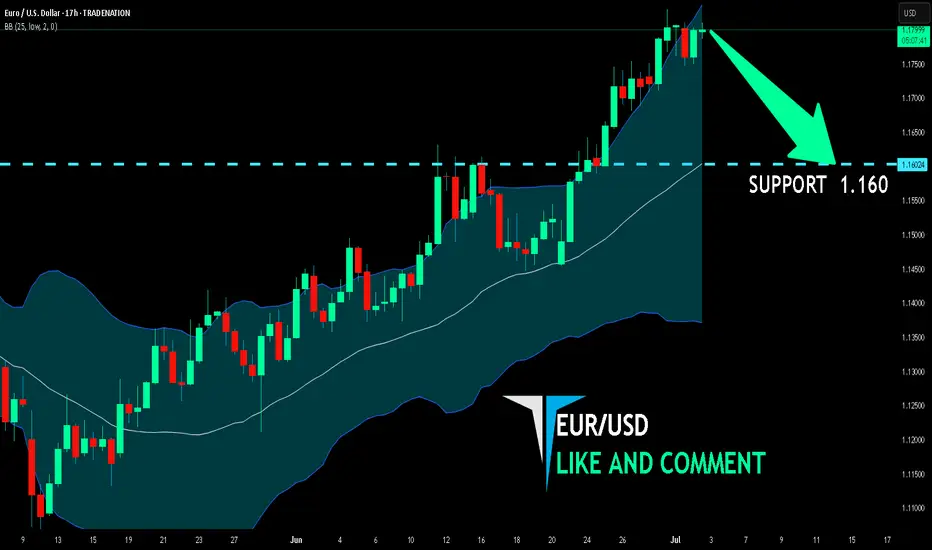
EUR/USD BEST PLACE TO SELL FROM|SHORT
Hello, Friends!
EUR/USD pair is trading in a local downtrend which know by looking at the previous 1W candle which is red. On the 17H timeframe the pair is going up. The pair is overbought because the price is close to the upper band of the BB indicator. So we are looking to sell the pair with the upper BB line acting as resistance. The next target is 1.160 area.
Disclosure: I am part of Trade Nation's Influencer program and receive a monthly fee for using their TradingView charts in my analysis.
✅LIKE AND COMMENT MY IDEAS✅
EUR/USD Overview - June 25: Why Did the Dollar Fall Again ?The EUR/USD currency pair continued its upward movement on Tuesday, which had stated on Monday. Let us recall that on Monday, everyone expected a "rollercoaster" right at the market open, i.e., during the night. However, the real action came closer to the evening. The first two trading days of the week were packed with events-of various kinds-capable of supporting both the dollar and the euro. So why did the U.S. currency fall out of favor with the market once again?
If we were to list all the reasons, one article certainly wouldn't be enough. so, let's start with the most local and obvious ones. As early as Monday, we mentioned that the dollar might benefit from another escalation in the Middle East, this time initiated by the U.S. But just think: can the dollar even hypothetically be considered a "safe haven" if one of the warring parties is the U.S.?
The second reason is that Trump launched a strike on Iran's nuclear facilities, and the next day, missiles were flying back-toward Qatar, Israel, and U.S. military bases. And. notably, Iran hit the American bases.
The third reason is that Trump thanked Iran for warning Washington in advance about the upcoming strike. Honestly, the only word that comes to mind here is "farce." Can this even be a war if the participants warn each other before launching attacks? Naturally, the market immediately concluded that this was not a war but a performance. That might be better in some ways-since human casualties were avoided, and that is most important. But at the same time, if the dollar had any hopes of strengthening due to a Middle East escalation, the market realized yesterday that this "escalation" was theatrical and staged.
And it gets even more bizarre. On Tuesday morning, Donald Trump announced a ceasefire. The U.S. President was so eager to establish peace somewhere-anywhere-that he declared the war over without waiting for any official statements from Iran or Israel. And just a few hours later, Iranian missiles took to the skies again. Once more, if this weren't about deadly weapons of mass destruction, the whole situation could be considered a comedy
For the res of Tuesday, Trump posted angry messages every half hour on his own social network, expressing his dissatisfaction not only with Iran but also with Israel. In the afternoon, Trump tried to persuade Israeli not to launch retaliatory strikes, and we're left wondering-does the U.S. President believe that Iranian and Israeli leaders check his Twitter feed before initiating missile attacks?
Frankly, we don' even know how to respond to this circus anymore. But the market certainly does. Why should it buy the dollar-even without the caveat "if Donald Trump remains president"? America has turned from a country with the strongest economy and military into a laughingstock. And these are just the reasons the dollar fell on Monday and Tuesday. Should we even bother listing why the U.S. currency has fallen for five months
The average volatility for the EUR/USD currency pair over the last five trading days as of June 25 is 74 pips, which is characterized as. " We expect the pair to move between the levels of 1.1551 and 1.1699 on Wednesday. The long-term regression channel is directed upward, indicating a continued bullish trend. The CCI indicator entered the overbought zone, which triggered only a minor downward correction
Nearest Support Levels:
S1 - 1.1597
S2 - 1.1475
S3 - 1.1353
Nearest Resistance Levels:
R1 - 1.1719
R2 - 1.1841
R3 - 1.1963
Trading Recommendations:
The EUR/USD pair continues its upward trend. Trump's foreign and domestic policies remain the strongest pressure factor on the U.S. dollar. Additionally, the market interprets or ignores much of the incoming data negatively for the dollar. We continue to observe a complete lack of interest in buying the dollar under any circumstances.
If the price is below the moving average, short positions remain relevant with targets at 1.1475 and 1.1353, though a significant decline in the pair is unlikely under current conditions. If the price is above the moving average, long positions can be considered with targets at 1.1699 and 1.1719 in continuation of the trend.
Explanation of Illustrations:
Linear Regression Channels help determine the current trend. If both channels are aligned, it indicates a strong trend.
Moving Average Line (settings: 20,0, smoothed) defines the short-term trend and guides the trading direction.
Murray Levels act as target levels for movements and corrections.
Volatility Levels (red lines) represent the likely price range for the pair over the next 24 hours based on current volatility readings.
CCI Indicator: If it enters the oversold region (below -250), or overbought region (above +250), it signals an impending trend reversal in the opposite direction.
