EURUSD - ANALYSIS👀 Observation:
Hello friends! I hope you're doing well. I’d like to share my view on EUR-USD with you.
Looking at the EUR-USD chart, I see two potential scenarios ahead:
🔹 Scenario 1 – Bearish:
If EUR-USD breaks below 1.16836 on the 15-minute time frame, I expect a downward move toward the 1.16319 to 1.15850 area.
🔹 Scenario 2 – Bullish then Bearish:
If the price rises from the current level, I expect an initial move up toward 1.17937, followed by a decline back toward the 1.16319 to 1.15850 zone.
💡 Key Levels to Watch:
📌 Support: 1.16836 / 1.16319 / 1.15850
📌 Resistance: 1.17937
💬 What are your thoughts on EUR-USD? Let me know in the comments below.
Trade safe
EURUSD_SPT trade ideas

EURUSD A Fall Expected! SELL!
My dear subscribers,
My technical analysis for EURUSD is below:
The price is coiling around a solid key level - 1.1784
Bias - Bearish
Technical Indicators: Pivot Points High anticipates a potential price reversal.
Super trend shows a clear sell, giving a perfect indicators' convergence.
Goal - 1.1667
My Stop Loss - 1.1853
About Used Indicators:
By the very nature of the supertrend indicator, it offers firm support and resistance levels for traders to enter and exit trades. Additionally, it also provides signals for setting stop losses
Disclosure: I am part of Trade Nation's Influencer program and receive a monthly fee for using their TradingView charts in my analysis.
———————————
WISH YOU ALL LUCK

Prediction for EUR/USD Sell Setup (Short from 1.1825–1.1830)
Why?
• Price recently broke down from an ascending channel (seen on your TradingView screenshot).
• Confirmed lower high structure (bearish).
• Rejection from previous resistance near 1.1830 is likely.
• Fibonacci retracement shows 1.1830 aligns with key 78.6% reversal zone.
• DXY (USD Index) strength supports EUR/USD downside pressure.
• Clean downside liquidity resting near 1.1700 and possibly 1.1630.
⚠️ Buy Setup (Long from 1.1745–1.1750)
• Confidence: ⚪ 78%
• Why Lower?
• Although 1.1745 is solid support, it is being retested too frequently.
• Momentum is weakening.
• If price stalls and fails to bounce strongly off 1.1750, it risks collapsing to 1.1700 or lower.
• MACD/Volume divergence showing early bearish bias on M15/M30 timeframes.
⸻
🧠 Verdict:
• Short trade from 1.1825–1.1830 has higher probability based on current structure and momentum.
• This would be a sell-the-retest opportunity of the broken ascending channel.
• Hold to TP1 = 1.1745, and TP2 = 1.1700, with clean smart trail logic activated after TP1.
Then wait for reversal triggers and initiate sell long setup

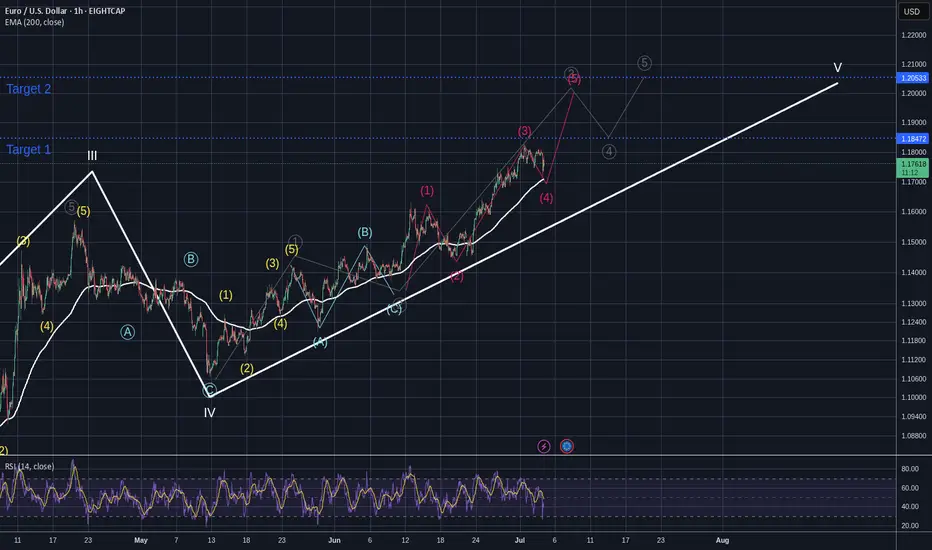
Elliott Wave Analysis: Potential Correction AheadThe overarching 5-wave structure from January 9, 2025, to today is nearing completion. We are currently in Wave 5, with the subordinate Wave 3 in progress. Within this, the sub-subordinate Wave 5 is just starting. Once the overarching Wave 5 concludes, expect a multi-week correction. The correction is projected to target levels between 1.1173 and 1.075.
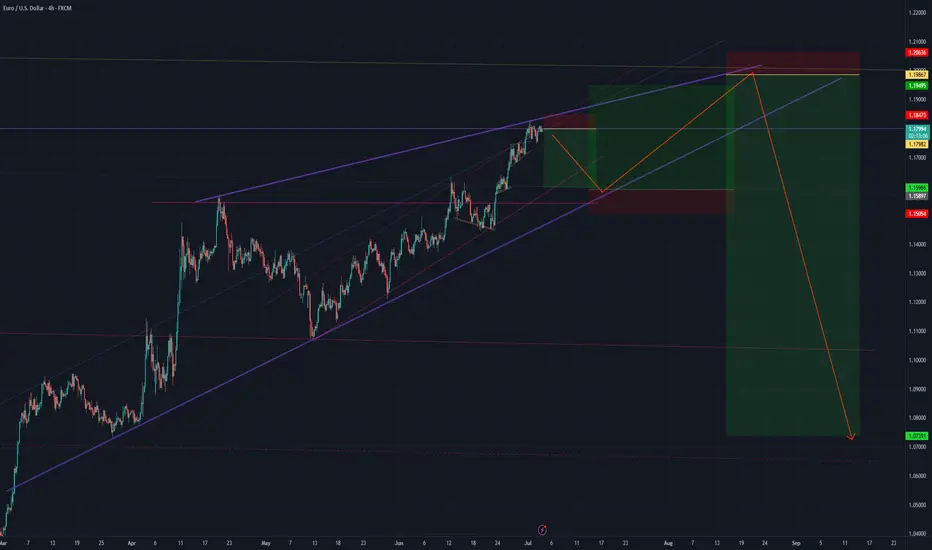
Retracement, top of the rising wedge and change of trend?I think EURUSD could retrace a bit to the the 1.16 then look for new highs around 1.19-1.20 area, that could be a potential reversal zone: long term target 1.07
EURUSDEUR/USD Bias: Bullish
(Market is positioned for euro strength vs. dollar weakness, so EUR/USD likely to move higher)
Speculators are confident in euro strength, and mildly bearish on the dollar — giving EUR/USD a clear upward bias.

EURUSD D1 & H4 (Wave Analysis) Update 3/7/2025EURUSD D1 & H4 (Wave Analysis) Update 3/7/2025
See the Chart

Bearish ContinuationI am expecting price to continue lower from the newly formed area of supply zone. For now price has already mitigated the EQ of the bullish swing range so this is a medium probability trade setup. When price breaks the structure in HTF trading from the fresh demand zone in support of HTF bullish continuation would be much higher probability than this. But since I am going to use confirmation entry at the area of 1hr supply zone if it is a low probability I might not get the entry.

EURUSD before the NFPEURUSD remains in an uptrend, holding steady around the 1,1800 level.
Today, the U.S. Non-Farm Payroll (NFP) data will be released.
The news is scheduled for 1:30 PM London time and tends to have a significant market impact.
It's advisable to reduce risk on all open positions and avoid rushing into new trades.
Keep an eye on how the price reacts around key levels and whether it has the strength to continue the trend.

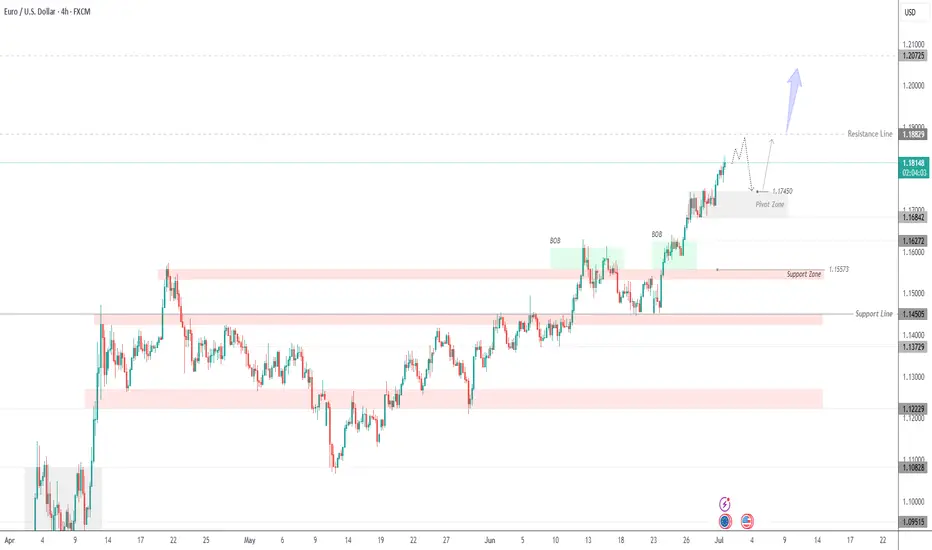
Euro Continues Bullish Trend | Eyes on 1.1882 & 1.2075EUR/USD – Strong Bullish Structure | Watching 1.1745 Pivot Zone for Reentry
The Euro continues to trade in a well-defined bullish trend, supported by institutional demand and clear price structure.
After breaking above the 1.1684 resistance zone, EUR/USD extended toward 1.1818 and now approaches the next resistance at 1.1882. This level may act as a temporary cap, but if breached with momentum, the pair could target the 1.2075 zone next.
Bullish Order Blocks (BOBs) marked on the chart highlight previous accumulation zones where buyers stepped in aggressively. These areas are still valid for demand-based pullbacks.
Key Area to Watch – 1.1745 Pivot Zone:
This level serves as a potential reentry point if the price retraces. As long as EUR/USD holds above this zone, bullish momentum remains intact. A confirmed bounce here could resume the uptrend toward 1.1882 and beyond.
However, a clean break below 1.1745 could open the door for a deeper correction toward 1.1627 or even 1.1557, which is the next major support zone.
Key Levels:
Resistance: 1.1882, 1.2075
Pivot Zone: 1.1745
Support: 1.1627, 1.1557
Eurozone Economy and ECB Policy:Eurozone Economy and ECB Policy: Between Price Stability and Currency Tension
The Eurozone’s latest data points to a relatively stable and controlled macroeconomic environment, with a key milestone just reached:
📊 June inflation hit 2.0%, aligning precisely with the ECB’s long-term target.
Growth remains moderate but positive, and unemployment is stable. From a classical policy perspective, this setup would typically justify further interest rate cuts to stimulate demand and support economic expansion.
But there’s a growing complication:
The euro has strengthened significantly in recent weeks, driven not just by economic fundamentals but also by capital inflows and a weakening U.S. dollar. A stronger euro, while often seen as a sign of investor confidence, can hurt exports, reduce competitiveness, and dampen inflation further — potentially becoming a drag on recovery.
As a result, the ECB finds itself in a policy dilemma:
Cutting rates could stimulate growth, but risk driving the euro even higher.
Slowing down or pausing rate cuts could stabilize the currency, but may stall economic momentum.
---
🔁 Reflexivity at Work
This dynamic highlights George Soros' theory of reflexivity — where market perceptions shape fundamentals, and those fundamentals in turn reshape perceptions.
> “Market prices are always distorted by prevailing biases.”
— George Soros
The current rally in the euro may not reflect fundamentals alone. If the move exceeds investor expectations, it could trigger emotional reactions, abrupt capital shifts, or even corrections — despite a solid economic base.
---
⚠️ Key Takeaways
June inflation at 2.0% gives ECB a clean slate to act — but with caution.
Currency appreciation can delay or distort the impact of monetary easing.
Market reflexivity may accelerate reactions beyond what data alone would justify.
Policy credibility now hinges not just on data, but on timing and communication.
---
In today’s market, price and psychology move together. Stability on paper doesn't always mean stability in execution.

SMC Mechanical Entry Models✅ SMC Checklist:
1. Market Structure
🔹 Identify HTF Trend (H4 or H1): bullish, bearish, or range
🔹 Confirm Break of Structure (BOS) or Change of Character (CHoCH) on M15–M5
🔹 Look for lower highs/lows (downtrend) or higher highs/lows (uptrend)
2. Liquidity Zones
🔹 Look for equal highs/lows (liquidity pools)
🔹 Asian highs/lows — common targets during London/NY session
🔹 Recent internal range liquidity
🔹 Trendline liquidity — fakeouts often occur here
3. Premium & Discount Zones (PD Arrays)
🔹 Use Fibonacci from recent swing high to low
🔹 Look for entries at Discount (Longs) or Premium (Shorts) pricing
🔹 Ideal entries happen between 0.62–0.79 retracement
4. Supply & Demand Zones
🔹 Find fresh OBs (Order Blocks) that caused a break of structure
🔹 Use last bullish candle before strong drop (for short) or last bearish candle before strong rally (for long)
🔹 Confirm zone isn’t mitigated yet
5. Imbalance / Fair Value Gaps (FVG)
🔹 Identify large imbalanced candles (no wick overlap)
🔹 Ideal entries are inside the FVG aligned with direction
🔹 High probability if FVG is within OB or confluence with structure/liquidity
6. Confluences for Entry
🔹 Entry aligns with liquidity sweep or FVG/OB tap
🔹 Volume spike or rejection wick confirms interest
🔹 RSI divergence or exhaustion = bonus confirmation
🔹 Use M1/M5 for entry trigger after setup is formed on M15–H1
7. Entry Trigger
🔹 CHoCH or BOS on lower timeframe (M1-M5)
🔹 Confirmation with engulfing candle, FVG fill, or break/retest
🔹 SL below/above recent swing or OB boundary
8. TP/Exit Zones
🔹 TP1: After BOS/structure shift + partial
🔹 TP2: Next liquidity level (equal high/low or OB)
🔹 TP3: Opposite OB or major FVG
🔹 Adjust SL to breakeven after reaching TP1
9. Session Timing (Important)
🔹 Asian range → look for liquidity setup
🔹 London Open (3PM–6PM PH))→ manipulative move (liquidity grab)
🔹 NY Open (8PM–11PM PH) → continuation or reversal opportunity
🔹 Avoid high-impact news releases unless breakout
🔹 Use Forex Factory / MyFXBook for news calendar
10. Post-Trade Journaling:
🔹Screenshot HTF → LTF Setup (H4 > M15 > M1)
🔹Don’t skip journaling — it’s your #1 improvement tool.

EURUSD Bullish continuation supported at 1.1640The EURUSD currency pair continues to exhibit a bullish price action bias, supported by a sustained rising trend. Recent intraday movement reflects a sideways consolidation breakout, suggesting potential continuation of the broader uptrend.
Key Technical Level: 1.1640
This level marks the prior consolidation range and now acts as pivotal support. A corrective pullback toward 1.1640 followed by a bullish rejection would reinforce the bullish trend, targeting the next resistance levels at:
1.1830 – Near-term resistance
1.1900 – Minor swing high
1.1940 – Longer-term bullish objective
On the other hand, a decisive daily close below 1.1640 would invalidate the bullish setup, shifting the outlook to bearish in the short term. This could trigger a deeper retracement toward:
1.1590 – Initial support
1.1530 – Key downside target
Conclusion:
As long as 1.1640 holds as support, the technical outlook remains bullish, favoring long positions on dips. A confirmed break below this level would signal a shift in sentiment and open the door to a corrective pullback phase.
This communication is for informational purposes only and should not be viewed as any form of recommendation as to a particular course of action or as investment advice. It is not intended as an offer or solicitation for the purchase or sale of any financial instrument or as an official confirmation of any transaction. Opinions, estimates and assumptions expressed herein are made as of the date of this communication and are subject to change without notice. This communication has been prepared based upon information, including market prices, data and other information, believed to be reliable; however, Trade Nation does not warrant its completeness or accuracy. All market prices and market data contained in or attached to this communication are indicative and subject to change without notice.

EURUSD ADP Report (Today):
-33,000 jobs in manufacturing & goods-producing sectors
Overall ADP employment report: weaker than expected
➡️ Normally, that would imply a soft NFP tomorrow.
⸻
So Why Are People Saying NFP Will Be “Hot”?
There are 3 key reasons why some traders are still expecting a strong NFP despite a weak ADP:
⸻
1. ADP ≠ NFP
• ADP is NOT a reliable predictor of NFP.
• Historically, ADP and NFP often diverge widely — especially in months with:
• Revisions
• Government hiring
• Seasonal distortions
Example: In several past months, ADP missed badly while NFP was strong.
⸻
2. Other Labor Indicators Are Still Strong
• The JOLTS report this week showed job openings holding up
• Weekly jobless claims remain near historic lows
• Wages are still growing at 4%+
So markets may believe the labor market is stronger than ADP suggests.
⸻
3. Positioning & Speculation
• Traders often “fade” the ADP number, expecting NFP to surprise the opposite way.
• Some are just betting on momentum or trying to trap weak hands.

EURUSD📉 EURUSD – 30min Short Plan
📊 Structure: LLs & LHs forming – bearish trend confirmed
🕯️ Pattern: Bearish Engulfing at Lower High
🎯 Entry: instant
📌 Trade 1
– 🎯 TP1: 1:1
– ⚠️ Risk: 1%
📌 Trade 2
– 🎯 TP2: larger reward
🛠️ Execution:
– Place both trades at same entry
– Trail SL after TP1 hit
📎 Bias: Bearish


30-06-2025 _ Short Term Bullish Idea _ EURUSD H11- Price is in an uptrend and consolidating at the moment.
2- Potential Bullish Rectangle.
3- Potential Divergence developing on MACD.
4- We can look for a push to the upside towards Daily Resistance Zone.

EURUSDOther analysis suggests continued bullish momentum, potentially testing the 1.19-1.20 level in the coming weeks, and possibly even higher towards 1.2227 or 1.2456 if the rally continues strongly

EURUSD InsightHello to all our subscribers, and welcome!
Please share your personal opinions in the comments. Don’t forget to like and subscribe.
Key Points
- U.S. President Trump commented on the mutual tariff suspension deadline of July 9, saying, “We can do whatever we want. We could extend it, or shorten it,” leaving the door open for an extension.
- U.S. Treasury Secretary Scott Bessent stated that trade negotiations could be finalized by September 1, adding that agreements were nearing completion with more than 10 of the 18 major trading partners.
- President Trump noted that Canada is preparing to implement a digital tax, saying, “We will halt all trade discussions with Canada and within the next seven days inform them of the tariffs they must pay to operate in the U.S.”
- The U.S. Personal Consumption Expenditures (PCE) Price Index for May met expectations at 2.3% year-over-year, while the Core PCE Price Index slightly exceeded expectations at 2.7% year-over-year.
Key Economic Events This Week
+ June 30: U.K. Q1 GDP
+ July 1: Eurozone June CPI, Speech by Fed Chair Jerome Powell, U.S. JOLTS (Job Openings and Labor Turnover Survey)
+ July 2: U.S. June ADP Nonfarm Employment Change
+ July 3: U.S. June Nonfarm Payrolls, U.S. June Unemployment Rate
EURUSD Chart Analysis
The pair is showing a steep upward trend after breaking through a previous resistance level. Further upside potential appears to remain, with the next projected target area around the 1.18500–1.19000 range. However, there is currently a resistance zone in place, making it highly likely that a short-term dip may occur before the upward trend resumes.

EURUSD SELL TRADEOpportunity to sell on EURUSD
Entry: 1.18000
Stop loss: 1.18200
Take profit 📈 1.17400
Comment your opinion
For fund management. Contact me on X @shajudeakinoba1

Be careful with EURUSDEURUSD is holding its bullish trend and hovering around 1,1800.
Tomorrow, U.S. employment data is due.
It will be released on Thursday instead of Friday, as Friday is a holiday.
At the current levels, there’s no favorable risk-reward for new entries.
Watch for a pullback and wait for the right moment.

EURUSD| - Inducement Fueling Bullish Intent📌 Pair: EURUSD
📈 Bias: Bullish
🕰 HTF View (4H):
Clear bullish intent shown with a break above major external structure (higher high). Inducement remains intact—expecting that draw to price. Strong bullish momentum signals smart money positioning for more upside.
🧭 MTF Clarity (2H → 30M):
30M structure refined and leaning bullish, but using 2H for confirmation. Waiting on liquidity sweep into the OB zone for entry precision.
🎯 Entry Criteria:
LTF CHoCH → Liquidity Sweep → OB Mitigation
(Execution in that exact order for maximum confirmation)
🎯 Target: Structure highs above
🧠 Mindset Note:
Let the inducement play out—don’t rush it. This is where patience and clarity separate a sniper from a scalper. One clean entry > 10 reactive trades.
Bless Trading!
