EURUSD @ MAJOR SUPPLY ZONE, IS IT TIME FOR SELLERS TO TAKE OVERIn this 15m chart we have MAJOR SUPPLY AREA around 1.1723
SMALL TIME FRAME we can see heavily been REJECTED @ this SUPPLY AREA & now we kinda form DOUBLE TOP FORMATION (keep in mind DOUBLE TOP not Valid till we BREAK NECK around 1.169)
My plan to take this in once we BREAK DOUBLE TOP NECK LINE AND RETESTED, OR EVEN BETTER GO IN AFTER UP WARD TREND BROKEN
Still i have my eye on 1.113 but as usual will close some along the way
I will update once im in
Thanks
EURUSD_SPT trade ideas

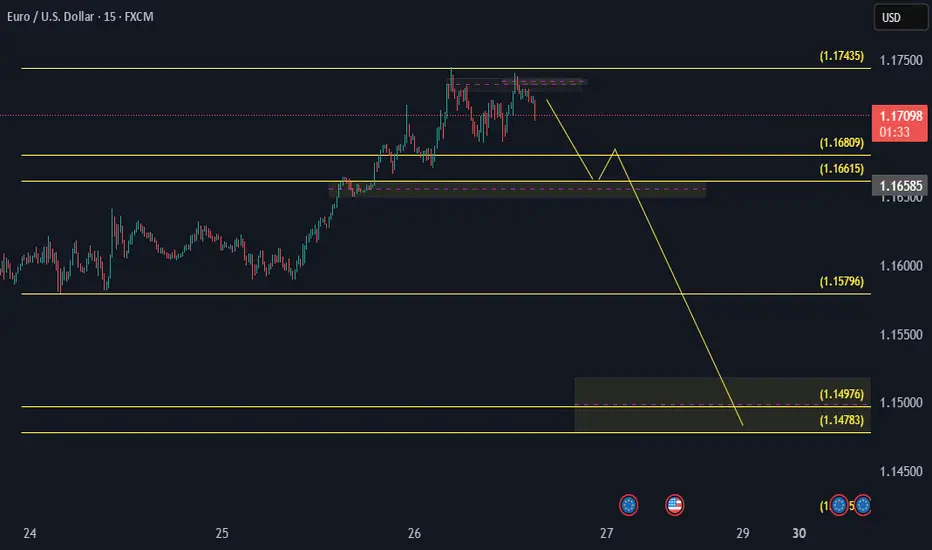
EURUSD SHORT TIME O LOSS TIMEI opened a long position on the EURUSD pair at 1.17195 with 10 lots.
Target: 1.174 – If the target is reached, I will take profit and open a short position.
At the same time, expecting USD weakness, I also opened a short position at 1.17200 with 20 lots.
1.168 to 1.166 is a strong support zone.
If price reaches 1.174 and I have an active short, I will close the 1.17200 short and keep the other one.
Targets and support levels are marked on the chart – I plan to close the positions gradually.
I will close 75% of the position at the 1.149 support level.
This is a demo account – I’m practicing in order to qualify for a funded trading account.
Depending on my success rate, I plan to start trading live on Forex.
Fed speak - Not broken, not cutting “Don’t fix what isn’t broken” seems to be the Fed’s current stance. Two Fed officials made that clear over the last 24 hours.
Vice Chair for Supervision Michael Barr warned that tariffs could fuel inflation by lifting short-term expectations, triggering second-round effects, and making inflation more persistent.
New York Fed President John Williams echoed that view, noting that tariff-driven inflation is “likely to get stronger in the months ahead.” He also called policy “well positioned” and said the Fed needs more data before making any move.
EUR/USD has formed a rising wedge pattern on the daily chart—typically a bearish structure that warns of a potential reversal. Price action has narrowed, building two clear tops. The downside target from the wedge could potentially be 1.1066 initially, and possibly down to 1.0732 if bearish momentum accelerates.

EURUSD 15Min AnalysisPrice rejected from premium zone after multiple BOS (Break of Structure).
Now expecting a pullback and continuation to the downside.
Targeting the demand zone near 1.16312.
SL above recent high – Risk to Reward looking favorable.
🔻Short Bias
📍Entry: 1.17108
🎯Target: 1.16312
📛SL: 1.17450

CHECK EURUSD SIGNAL READ CAPTAINsell Setup)
Entry Zone: Around 1.17200 \1.17100
Stop Loss: 1.17500
Take Profits:
TP1: ~1.16800
TP2: ~1.16450
Final Target: 1.16100

eurusd updateentry price 1.1329
stop loss update 1.133
take profit
1.153
1.165
1.177
1.194
result we hit first two target

EUR/USD Breaking above Major ResistanceI had posted a short for the EUR/USD a week or 2 ago but I canceled it due to concerns about a major breakdown on the DXY. Well sure enough, my concerns were valid as the DXY continues to break lower, sending the EUR/USD above this weekly trendline going back 5 years. This is huge, if it closes above by the end of the week, the EUR/USD will have broken resistance and will be going much higher.

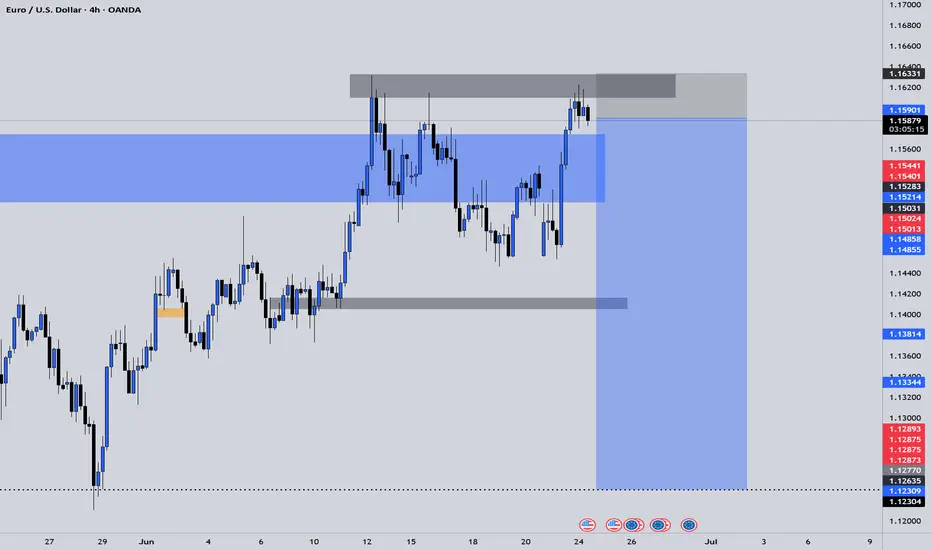
OTEUM EXPERT CALL: EUR/USD – June Finale Setup We’re eyeing the last intramonth swing of June, expected to bleed into early July. Our playbook: let the market cough up one final risk-off spike on the Iran headlines 🌪️📰, then scoop up positions in the value zone (red box) for the next bullish leg 🚀.
Patience first, trigger later 🕰️🎯—wait for price to hit the sweet spot, load up, and ride the firework into summer. Stay nimble; geo-shock headlines can flip the board fast ⚠️.
#EURUSD #Intramonth #RiskOff #ValueHunt #OTEUM

EURUSD: Next Move Is Down! Short!
My dear friends,
Today we will analyse EURUSD together☺️
The in-trend continuation seems likely as the current long-term trend appears to be strong, and price is holding below a key level of 1.17021 So a bearish continuation seems plausible, targeting the next low. We should enter on confirmation, and place a stop-loss beyond the recent swing level.
❤️Sending you lots of Love and Hugs❤️

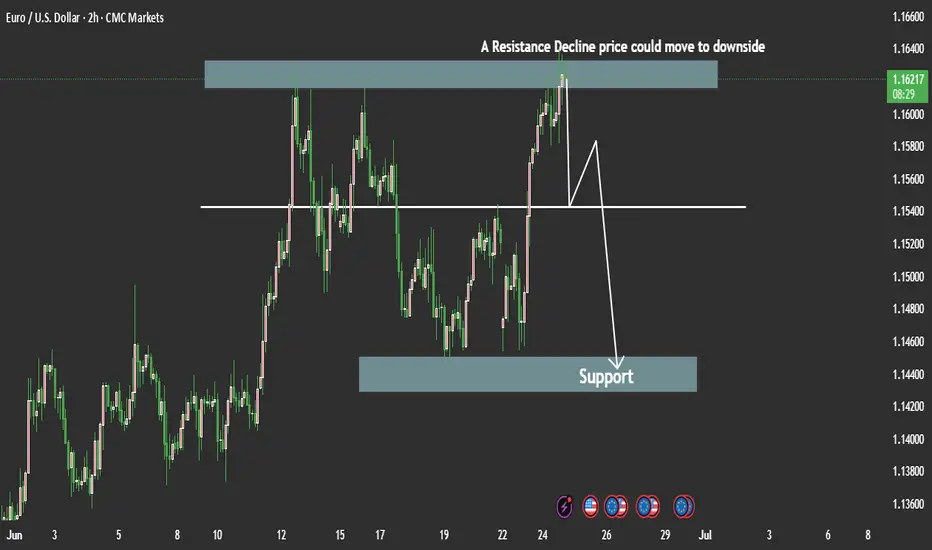
EURUSD Sell SetupBy: MJTrading:
EUR/USD has rallied into a significant resistance zone, approaching the upper boundary of a rising wedge/channel pattern. The price is now hovering around a key confluence zone, where trendline resistance and horizontal supply intersect ( 1.16300 —1.16500 )
There are to possible scenarios:
1) If the price Rejects directly from previous High
🔹 Position 1: Sell Stop @ 1.15915
🛑 Stop Loss: 1.6375
🎯 Take Profit: 1.5454
R/R:1
isk Level: Medium
2) If price tries to reach the boundary of the wedge or make a Fake breakout:
🔹🔹 Position 2: Sell Limit @ 1.16300
🛑 Stop Loss: 1.6930
🎯 Take Profit: 1.5000
R/R:2
Risk Level: Low
📌 This zone offers a high-probability reversal setup
📉 Why it Matters:
Price action shows signs of exhaustion after a parabolic move.
EMA structure is stretched, hinting at a potential pullback.
Lets ZOOM OUT:
Daily Chart:
ZOOM IN:
Stay disciplined, let price come to you, and manage risk.
—
#EURUSD #ForexSetup #TradingStrategy #TechnicalAnalysis #ChartPattern #FXTrading #ShortTrade #MJTrading #BearishReversal #PriceAction #SwingTrade #ForexIdeas #Trendlines #BreakoutOrFakeout #RiskReward

OTEUM EXPERT CALL: EUR/USD – June Finale Setup We’re eyeing the last intramonth swing of June, expected to bleed into early July. Our playbook: let the market cough up one final risk-off spike on the Iran headlines 🌪️📰, then scoop up positions in the value zone (red box) for the next bullish leg 🚀.
Patience first, trigger later 🕰️🎯—wait for price to hit the sweet spot, load up, and ride the firework into summer. Stay nimble; geo-shock headlines can move the board fast ⚠️.

EURUSD ShortLive Analysis – EURUSD
Market Structure: Price has tapped into the Daily Market Structure zone.
Price Action: Current structure and price action suggest a potential reversal is in play.
Strategy: This is a Structure-to-Structure trade setup.
Targets:
Lower liquidity pools beneath current price
Main Target: Weekly structured liquidity resting at the dotted line
The Reversal We have Been Waiting For!Key level has been tapped, gap is still open to be filled at 1.11690.
Entry at 1.16912
SL above top wick
Black line at the low is tp1

EUR/USD Weekly Technical Analysis – Testing Major Resistance📊 EUR/USD Weekly Technical Analysis – Testing Major Resistance 🔥📈
The EUR/USD pair is exhibiting a strong bullish momentum on the weekly timeframe, currently trading at 1.16562, and fast approaching a key resistance zone.
🔵 Key Observations:
📌 Resistance Zone:
Blue shaded area between ~1.16500 - 1.19000 is a major resistance level, historically tested in mid-2021.
A breakout above this zone could trigger a long-term bullish reversal toward 1.22793 (next major resistance marked by red arrow 🔴).
📌 Support Levels (Yellow Lines):
1.12821 🟡 – Previous minor resistance, could act as immediate support.
1.10543 🟡 – Key support from consolidation zone.
1.06775 & 1.04733 🟡 – Strong support levels during 2023-2024.
1.02063 & 0.96960 🟡 – Long-term base zones (2022 lows), showing double bottom formation (green arrows 🟢).
📌 Structure:
Formation of higher lows and higher highs, indicating bullish structure.
Recent breakout above consolidation range confirms momentum strength.
📌 Indicators (Bottom Right):
Suggest volatility and possible impact of economic or geopolitical events. ⚠️📅📌
⚠️ What to Watch For:
Rejection from Resistance could trigger a correction toward 1.12821 or lower.
Breakout above Resistance would expose 1.19000 → then 1.22793 (major target 🎯).
Weekly Close Above Resistance will be crucial to confirm the breakout.
📈 Bias: Bullish (Short to Mid-Term)
🧠 Strategy Tip: Traders may look for bullish continuation on breakout and retest above resistance, or short-term pullback entries around support if rejection occurs.

EUR_USD BULLISH BREAKOUT|LONG|
✅EUR_USD is going up
Now and the pair made a bullish
Breakout of the key horizontal
Level of 1.1630 and the breakout
Is confirmed so we are bullish
Biased and we will be expecting
A further bullish move up
LONG🚀
✅Like and subscribe to never miss a new idea!✅
Disclosure: I am part of Trade Nation's Influencer program and receive a monthly fee for using their TradingView charts in my analysis.

HelenP. I Euro will break resistance level and continue to fallHi folks today I'm prepared for you Euro analytics. On this chart, we can see how price initially moved inside a triangle formation, forming higher lows from the trend line and testing the resistance zone multiple times. Eventually, price broke out to the downside, falling sharply and breaking through the lower boundary of the triangle and also the trend line, signaling a shift in market sentiment. After touching the support zone and forming a temporary bottom, the pair started climbing back up, but this movement was more of a correction than a trend reversal. Price respected the trend line from below and followed it upward, but failed to break significantly higher. It managed to push above both support 2 and support 1 levels, which now act as resistance. Currently, EURUSD is trading inside the resistance zone, where previous reactions have led to strong bearish impulses. Given this behavior and the recent false breakout, I expect the price to rebound from this area and break back below support. My goal is set at 1.1350, anticipating further downside movement as the bearish structure remains valid. If you like my analytics you may support me with your like/comment ❤️
Disclaimer: As part of ThinkMarkets’ Influencer Program, I am sponsored to share and publish their charts in my analysis.

EURUSD Set To Fall! SELL!
My dear subscribers,
My technical analysis for EURUSD is below:
The price is coiling around a solid key level - 1.1521
Bias - Bearish
Technical Indicators: Pivot Points Low anticipates a potential price reversal.
Super trend shows a clear sell, giving a perfect indicators' convergence.
Goal - 1.1496
About Used Indicators:
By the very nature of the supertrend indicator, it offers firm support and resistance levels for traders to enter and exit trades. Additionally, it also provides signals for setting stop losses
Disclosure: I am part of Trade Nation's Influencer program and receive a monthly fee for using their TradingView charts in my analysis.
———————————
WISH YOU ALL LUCK
Perfect Elliot Wave Count on EURUSD and repeating pattern..I found a potential drop on EURUSD based on Elliot Wave Count, as the consolidation move should be end soon or later, and downward continuation will follow.
SEE THE REPEATING PATTERN AS A SIGNAL OF REVERSAL..
SELL EURUSD!

EUR/USDScenario 1: Bullish Reversal (If current FVG support holds)
Bias: Short-term bullish, looking for a continuation of the bounce.
Rationale: The price responded positively to an earlier low and is completing an FVG at this juncture. If this FVG is supported and the price breaks out above the latest bullish order block, then a reversal may be signaled.
Entry: Wait for a clear break and test back to the current high range or a demonstrated bullish candle pattern in the FVG area being filled. An entry might be at about 1.1520-1.1530 should confirmation be observed.
Target: The following big resistance level, which could be the liquidity pool ($S) at 1.1540, and thereafter, at 1.1580-1.1600, the
Stop-Loss: Below recent low or an important support level, i.e., below 1.1500 or current Bullish OB.
Scenario 2: Continuing Bearish Pressure (In case current FVG gets filled and it fails to hold)
Bias: Short-term bearish, expecting to see a continuation of the downtrend after the FVG is filled.
Rationale: If it extends this ongoing FVG and then shows signs towards rejection (e.g., bearish candlestick patterns, failure to break through resistances), it could be signaling continuation in the prior downtrend.
Entry: Look for bearish confirmation after the FVG fills, which would be a break down through the newest low or low side of the current range. Potential entry would be at 1.1500-1.1510 on a confirmed break down.
Target: The "Bullish OB" around 1.1440-1.1450, and potentially the lower FVG around 1.1400.
Stop-Loss: At or higher than the newest swing top or key level of resistance, e.g. 1.1530-1.1540
Relevant Factors:
Risk Management: You should always use appropriate position sizing and use a stop-loss to manage your risk.
Confirmation: Hold out for firm price action confirmation before entering any trade.
News Events: Be aware of any scheduled economic news releases or events that could impact EUR/USD, potentially creating huge volatility.
Bigger Timeframes: Always consider the bigger picture context (i.e., day, week) in order to obtain a general trend.

EURUSD Technical Outlook Bearish TrendEURUSD Technical Outlook – 4H Timeframe
EURUSD has been pushing higher over the past few sessions, reaching a key liquidity zone. On the 4-hour chart, we’ve observed a clean sweep of previous highs, indicating a potential liquidity grab.
From this zone, there's a high probability of a downside move, especially if the price fails to sustain above this level. Any bounce from this zone that lacks momentum may signal bullish exhaustion, opening the door for sellers to step in.
Resistance zone 1.16500
Support zone 1.14500
You may find more details in the chart Ps Support with like and comments for more analysis Thanks.
EURUSD Potential UpsidesHey Traders, in the coming week we are monitoring EURUSD for a buying opportunity around 1.14500 zone, EURUSD is trading in an uptrend and currently is in a correction phase in which it is approaching the trend at 1.14500 support and resistance area.
Trade safe, Joe.

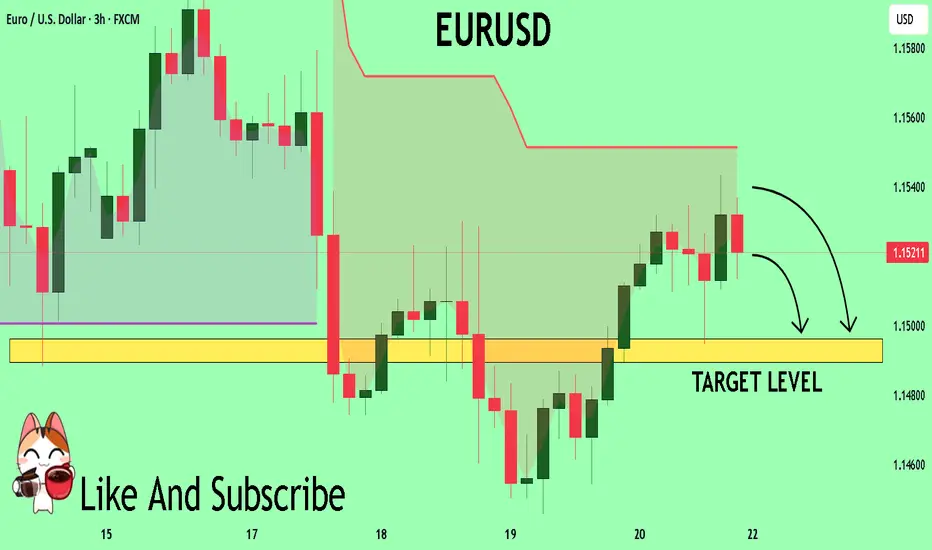
EURUSD: Pullback From Resistance Confirmed📉 The EURUSD could retreat from the highlighted resistance today.
I've identified a cup and handle pattern following a test of significant intraday resistance and a breach of its neckline, accompanied by strong bearish momentum.
Target - 1.1575.

FVG (Fair Value Gap) or Imbalance Zones (grey boxes):Key Zones & Markings:
SSL (Sell Side Liquidity) - "True return to support" (bottom horizontal line around 1.13700):
Indicates that price has swept the sell-side liquidity, grabbing stop-losses below previous lows.
This often precedes a reversal if it aligns with a key support zone.
FVG (Fair Value Gap) or Imbalance Zones (grey boxes):
Price is expected to retrace back into these imbalanced zones.
These zones act as magnet areas where price might rebalance before further continuation.
Target Zone (Top Horizontal Line at ~1.16200):
Marked as the bullish target, likely aligning with buy-side liquidity (BSL) or unfilled imbalances.
Potential take profit area for long entries from the support zone.
📈 Market Structure:
Price made a lower low, swept liquidity (SSL), and is now showing potential bullish intent.
Anticipated move:
Reversal from support
A clean bullish move toward FVGs
Final target near 1.16200
🎯 Strategy Idea:
Long Entry Zone: Near 1.137–1.140 (liquidity sweep + support).
Target: 1.15500 (intermediate) and 1.16200 (final).
SL (Stop Loss): Could be below the most recent low (if re-entry needed).
🧠 Concept Used:
Liquidity sweep (SSL)
Return to support
Fair Value Gap (FVG) fill
Smart Money long setup
