EURUSD| Weekly OutlookSame story as last week — still patiently waiting for the major engineered liquidity above to get cleared before considering any meaningful longs.
That said, EU is currently offering a clean structure for short setups into the downside order block. Everything is lining up technically, but it’s important to note this is a counter-trend move — and personally, I’m not taking it.
It’s tempting when structure looks this clean, but I know it’s not my proper approach. For me, the real play is still higher — waiting on that bull-side OB mitigation to align with the bigger picture narrative. Until then, I’ll let others chase while I sit on my hands. Pure discipline only.
Bless Trading!
EURUSD_SPT trade ideas

EURUSD Short Part IIEURUSD Analysis
On EURUSD daily chart from CMC Markets quota, indicates a bullish trend with a symmetrical triangle pattern forming. The price has recently broken above a key resistance level, suggesting potential for continued upward movement.
Key Price Levels
Current Price: 1.16932
Stop Loss (SL): 1.16549
Take Profit 1 (TP1): 1.12003
Take Profit 2 (TP2): 1.09318
Trend Analysis
EURUSD shows clear signs on an ascending trend supported by higher lows and higher highs since early 2025. Both orange trend-lines which I created form a symmetrical triangle, with the price nearing the apex, hinting at a potential breakout or reversal which I have been looking for a reversal bearish breakout.
The upward momentum is strong, but the proximity to the upper trend-line and set take-profit levels indicates preparation for a possible correction. I still believe in shorts on EURUSD.
Conclusion
Traders and investors should monitor the price action near the triangle apex for breakout confirmation. The set stop loss and take-profit levels provide a structured approach to managing the trade, balancing potential gains with risk mitigation. Stay tuned for more updates on the trade.

EURUSD LONG FORECAST Q2 W26 D23 Y25EURUSD LONG FORECAST Q2 W26 D23 Y25
Professional Risk Managers👋
Welcome back to another FRGNT chart update📈
Diving into some Forex setups using predominantly higher time frame order blocks alongside confirmation breaks of structure.
Let’s see what price action is telling us today!
💡Here are some trade confluences📝
✅Daily order block
✅15' order block
✅Intraday breaks of structure
✅4H Order block
🔑 Remember, to participate in trading comes always with a degree of risk, therefore as professional risk managers it remains vital that we stick to our risk management plan as well as our trading strategies.
📈The rest, we leave to the balance of probabilities.
💡Fail to plan. Plan to fail.
🏆It has always been that simple.
❤️Good luck with your trading journey, I shall see you at the very top.
🎯Trade consistent, FRGNT X

EURUSD – 2 Potential Intraday Setups (5-Min Chart)Chart Overview:
This 5-min EURUSD chart shows two example trade setups aligned with the main uptrend. These are shared purely for learning how to recognize and plan structured entries.
(Details are being shown in m5 chart- if this in not working for you please follow to be able to see it- as it is a private idea)
🔹 Example Trade 1 – 3rd Touch of Triangle Support
✅ Context:
Price retested the lower boundary of a broad triangle/wedge for the third time—often a strong area for reactive buys in an uptrend.
✅ Plan Concept:
Entry: Reversal signal on the 3rd touch.
Stop: Below the signal bar low.
Target: Mid to upper wedge area (or TP2).
🔹 Example Trade 2 – Breakout of Descending Flag
✅ Context:
After bouncing off trendline support, price formed a descending flag consolidation.
✅ Plan Concept:
Entry: Break and close above flag resistance.
Stop: Below the strong breakout candle.
Target: Extension toward recent highs (or TP2).
💡 Important:
These examples are not signals and not executed trades—they illustrate a possible planning process for traders studying price action strategies.
💡 Why These Matter:
Both setups align with the primary uptrend, use clear structure for risk placement, and rely on confirmation before entry.
🔹 Note:
These are educational examples only, not trade signals.
💬 Do you study similar setups? Share your charts and thoughts!
Thanks for your attention and your time...
Follow for more setups
#EURUSD #Forex #TradingEducation #PriceAction #IntradayTrading #BreakoutTrading #TechnicalAnalysis #LearnTrading #TradingView

EURUSD : Not yetSeems like it is very tempted to SELL now.
I do not think today is the day.
Maybe next Monday.

DeGRAM | EURUSD growth in the channel📊 Technical Analysis
● The chart for EURUSD, as indicated in the upper right corner, displays a classic descending wedge pattern, which is typically a bullish reversal signal. Price action has respected the wedge’s lower boundary multiple times, forming a series of higher lows while sellers failed to push the pair below the 1.0670 support zone. The most recent candles show a decisive breakout above the wedge’s upper trendline, accompanied by increased volume, suggesting that buyers are regaining control. This breakout is further validated by the RSI indicator, which has moved out of oversold territory and is now trending upward, confirming the shift in momentum.
● The technical setup is reinforced by the presence of a horizontal resistance level at 1.0750, which has acted as a magnet for price in previous attempts. The chart also highlights a bullish engulfing pattern on the daily timeframe, signaling strong demand and a potential continuation toward the next resistance at 1.0820. The moving averages are beginning to converge, with the shorter-term MA crossing above the longer-term MA, a classic bullish crossover that often precedes sustained upward movement. These factors collectively point to a high-probability scenario for further gains in the EURUSD pair.
💡 Fundamental Analysis
● Recent fundamental developments support the bullish technical outlook. Over the past two days, the Federal Reserve has maintained its policy rate, but forward guidance has hinted at a possible rate cut later this year, which has weighed on the US dollar. Meanwhile, the European Central Bank has adopted a more cautious stance, with the probability of a near-term rate cut decreasing as inflation data remains sticky in the eurozone. Additionally, easing geopolitical tensions in the Middle East and stable US retail sales have reduced safe-haven demand for the dollar, further supporting the euro’s advance.
✨ Summary
● A confirmed breakout above the descending wedge and bullish momentum indicators suggest a long entry on EURUSD above 1.0750, targeting 1.0820. The bullish scenario remains valid as long as price holds above the 1.0670 support. A close below this level would invalidate the setup and call for a reassessment of the trend.
-------------------
Share your opinion in the comments and support the idea with a like. Thanks for your support
EURUSD short to 1.56Currently testing 1M resistance area and 1D downtrend line.
Expecting retracement to 1D up trendline.
DXY is also testing 1W uptrend line

EURUSD facing resistance at Triple TopEURUSD facing resistance at Triple Top. With new geo-political situtaion yesterday night, Eith it will retace from this level or from upper channel line.

Profit TakingYesterday, EURUSD continued its bullish move and reached 1,1747.
Currently, we focus more on reducing risk and taking profits rather than entering new positions.
We’re approaching the final days of the quarter, and next week brings key economic events.
New entries will be considered only if a favorable risk-reward setup presents itself.
The next resistance remains at 1,1778!

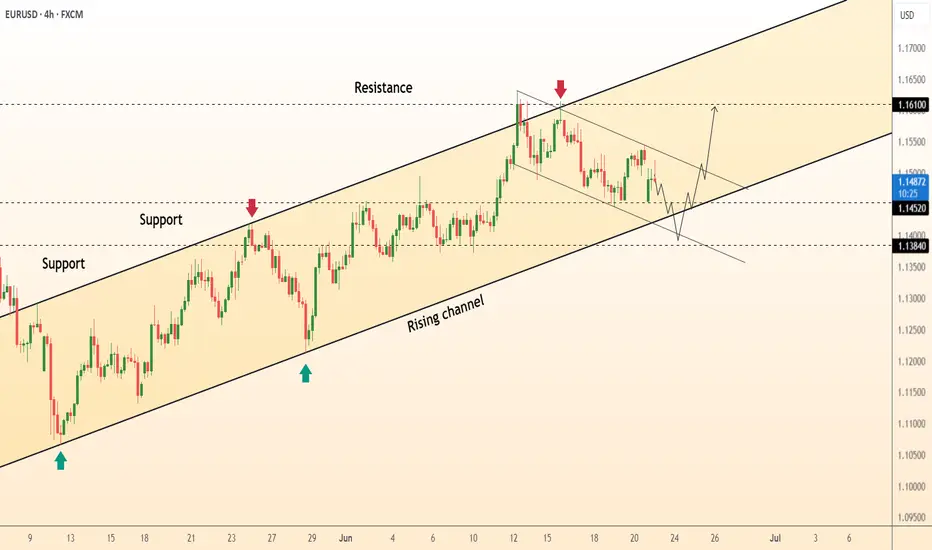
EURUSDThis levels is for reactions to support and resistace.
Price can now in Bull-trend if keep 1.145$ in sypport and breaked trendline.
⚠️Control risk management for positions.


BSL (Buy-side Liquidity):Symbol: EUR/USD
Timeframe: 1 hour
Price Range Displayed: ~1.15300 to ~1.17500
Current Price: 1.16935
🔍
Key Chart Markings
BSL (Buy-side Liquidity):
Marked at the top in the yellow zone (~1.17250–1.17500).
Indicates where buy-side liquidity was likely taken—suggesting liquidity grab or stop hunt.
SSL (Sell-side Liquidity):
Marked at the bottom yellow zone (~1.15700–1.15900).
Indicates a potential drawdown area—price may seek this liquidity next.
Price Action:
The price recently made a higher high into the BSL zone, followed by a bearish rejection.
A projected path is shown: short-term retracement upward, followed by a larger move downward toward the SSL zone.
📉
Potential Outlook (Bearish Bias)
The chart suggests a bearish move is anticipated:
BSL has been swept, signaling a reversal point.
Target: Sell-side liquidity around 1.15800, possibly lower.
⚙️
Technical Implication
This setup follows Smart Money Concepts (SMC) or Liquidity Engineering:
Liquidity is taken from one side of the market (BSL), and price is expected to move to the other (SSL).
Possible setup for a short trade after confirmation of the retracement.

EURUSD - perfect Gartley Pattern?Technical Analysis - no fundamentals taken into account.
EURUSD proce has just completed a perfect Gartley Pattern. If respected, proce will come down to 1.23748 at least. Potentially lower.

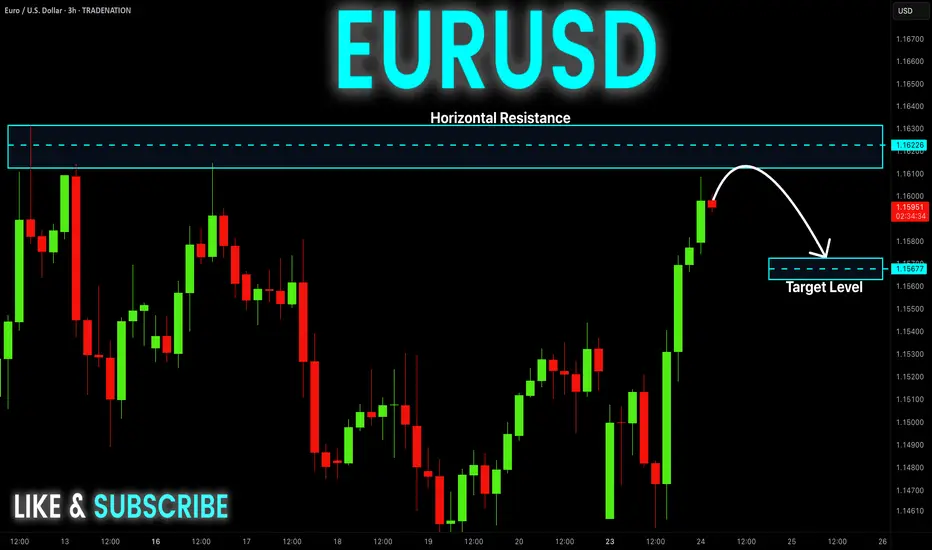
EUR-USD Risky Short! Sell!
Hello,Traders!
EUR-USD made a nice bullish
Move up and has almost reached
A horizontal resistance level
Of 1.1631 and the pair is locally
Overbought so after the retest
A local bearish correction
Is to be expected
Sell!
Comment and subscribe to help us grow!
Check out other forecasts below too!
Disclosure: I am part of Trade Nation's Influencer program and receive a monthly fee for using their TradingView charts in my analysis.
EURUSD POSSIBLE FINAL STAGE FOR BULL AND BEAR TAKING OVERIn this 15m chart we have MAJOR WEEKLY/DAILY RESISTANCE SUPPORT area around 1.1653
I wait to see if we close below that and get out of this UP-WARD CHANEL
If all this mate i will take sell below 1.1642 and Main target will be 1.113 but as usual will close some along the way
I will update once im in
Thanks

EURUSD Pull BAck - Long term Target 1.200Looking for the pull to prior day lows. Long term target for EURUSD 1.200.

Market next move
🔁 Disruption of the Current Analysis
1. False Breakout Scenario
The chart assumes a bullish move breaking resistance before a bearish reversal.
Disruption: This could be a false breakout, where the price appears to break above resistance but lacks strong volume and momentum. Traders get trapped long, and the price quickly reverses below resistance, invalidating the bullish leg entirely.
2. Stronger Uptrend Continuation
Despite calling for a bearish target, the overall trend appears strong with higher highs and higher lows.
Disruption: Instead of a retracement, EUR/USD could break through the resistance zone convincingly, possibly reaching 1.1750–1.1800, supported by:
Increasing volume
Bullish candles closing above resistance
No signs of bearish divergence on RSI/MACD (if added)
3. Fundamental Factors
The chart ignores macro data.
Disruption: If upcoming EU economic data is stronger than expected, or if US data disappoints, the euro could strengthen further.
Upcoming events with the euro and US flags suggest possible volatility.
4. Volume Contradiction
Recent bullish candles are supported by strong volume, suggesting accumulation.
Disruption: If smart money is accumulating positions, this would support further bullish continuation, not reversal.

EURUSD is in a Downside DirectionHello Traders
In This Chart EURUSD HOURLY Forex Forecast By FOREX PLANET
today EURUSD analysis 👆
🟢This Chart includes_ (EURUSD market update)
🟢What is The Next Opportunity on EURUSD Market
🟢how to Enter to the Valid Entry With Assurance Profit
This CHART is For Trader's that Want to Improve Their Technical Analysis Skills and Their Trading By Understanding How To Analyze The Market Using Multiple Timeframes and Understanding The Bigger Picture on the Charts

Euro's Surge on USD Weakness – Is 1.20 the Next Stop?EURUSD: Euro's Surge on USD Weakness – Is 1.20 the Next Stop?
Hello TradingView Community!
The EURUSD pair is currently commanding significant attention with its strong upward momentum.
🌍 Fundamental Highlights: Euro's Tailwinds & USD's Headwinds
The Euro has demonstrated notable strength, recently breaching the 1.17 mark to hit its highest level in over 3.5 years. According to ING, if this momentum holds, the next target could be 1.20, contingent on continued USD weakness.
The US Dollar faces considerable pressure following news that President Trump intends to name a successor to Fed Chair Powell soon, sparking concerns about the Fed's independence. Such speculation often leads to expectations of a more 'dovish' monetary policy, weakening the USD.
Adding to the Euro's support are the NATO agreement to increase defense spending targets to 5% and President Trump's seemingly "less aggressive" stance towards the EU.
In summary: Should USD depreciation persist, not only the Euro but other asset classes might also attract capital inflows, particularly given the ongoing uncertainties surrounding inflation risks and monetary policy.
📊 EURUSD Technical Outlook (H4/M30 Chart):
Our technical analysis of the EURUSD chart (image_b73298.png) confirms a clear and robust uptrend, characterized by successive higher highs and higher lows. The EMAs are in a bullish alignment, reinforcing this upward trajectory.
Upside Targets (Potential BUY Zones):
1.17807: The initial potential target if the bullish momentum continues.
1.18458: A higher target representing the next potential resistance zone.
Key Support Levels (Potential BUY Zones for pullbacks):
1.16070: A strong support level where demand could emerge after a correction.
An implied intermediate support around 1.166xx (visually suggested by price action between current levels and 1.16070) could also offer buying opportunities after minor pullbacks.
🎯 EURUSD Trading Plan:
BUY Zone 1 (Intermediate Pullback):
Entry: 1.16600 - 1.16700
SL: 1.16450
TP: 1.16800 - 1.17000 - 1.17200 - 1.17500 - 1.17807 - 1.18000 - 1.18300 - 1.18458
BUY Zone 2 (Strong Support):
Entry: 1.16070
SL: 1.15900
TP: 1.16200 - 1.16400 - 1.16600 - 1.16800 - 1.17000 - 1.17300 - 1.17600 - 1.17807 - 1.18458
SELL Zone (Consider only at upside targets with clear reversal signals):
Entry: 1.18458 (This is an upside target, but also a potential resistance for selling if strong reversal signals appear).
SL: 1.18600
TP: 1.18300 - 1.18000 - 1.17807 - 1.17500 - 1.17200 - 1.17000 - 1.16800
⚠️ Key Factors to Monitor:
Fed Leadership News: Any official announcements regarding the Fed Chair succession will trigger significant USD volatility.
Eurozone Economic Data: Upcoming inflation, GDP, and employment reports.
ECB Statements: The European Central Bank's stance on monetary policy.
Geopolitical Developments: Major tensions or agreements can influence market sentiment.
Trade smart and always manage your risk effectively! Wishing everyone a profitable trading day!

Overextended Rally into Resistance ZoneEUR/USD has pushed into the upper boundary of the Keltner Channel on the 4H timeframe, indicating a potential exhaustion of bullish momentum. Price is showing signs of overextension with Heikin Ashi candles losing strength near a key resistance zone.
📉 Short Position Setup:
Entry: 1.17220 (near upper Keltner resistance)
SL: 1.17581 (above recent highs and volatility buffer)
TP: 1.15220 (targeting mid-channel and previous structure support)
🔻 Bearish Confluence:
Price rejecting upper Keltner band
Potential for mean reversion after strong rally
Weakening bullish momentum in candle structure
Confirmation with further bearish price action or divergence signals would strengthen the case for downside continuation.

EUR_USD RISING SUPPORT AHEAD|LONG|
✅EUR_USD is trading along the rising support
And as the pair will soon retest it
I am expecting the price to go up
To retest the supply levels above at 1.1511
LONG🚀
✅Like and subscribe to never miss a new idea!✅
Disclosure: I am part of Trade Nation's Influencer program and receive a monthly fee for using their TradingView charts in my analysis.

Shorting Optimism: EUR/USD Rally vs RealityAfter the spike to 1.1640 driven by temporary ceasefire news and USD weakness, I’ve taken a short position on EUR/USD. The market priced in too much optimism too fast, and I see limited upside beyond this zone in the current macro landscape. I’m positioned for a controlled retracement back toward the 1.1460–1.1520 region.
The play? Fade the overextension, follow structure, and manage from strength.
Technicals:
• The pair ran into a strong supply zone near 1.1640, which aligns with a previous liquidity sweep.
• Momentum has slowed visibly on lower timeframes, with candles rejecting highs and wicks printing upper tails.
• Daily and 4H SMAs are overstretched. The 20 SMA on H4 is accelerating upward, but RSI is near overbought and flattening.
• My short entry was taken with a stop above 1.1745 and first target at 1.1540, second at 1.1500.
• A potential retest of the 1.1660 zone could offer additional entries if invalidation remains intact.
Fundamentals:
• ECB vs Fed Divergence: The Fed holds firm on rates amid sticky inflation, while the ECB is under pressure to ease further due to weak growth.
• EU Struggles: PMI data remains in contraction territory; HICP cooling to 1.7% YoY suggests little reason for tightening.
• Political Instability: Germany and France both facing internal political crises — risk premia rising.
• Ceasefire Priced In: EUR rally on Middle East headlines lacks depth — conflict paused, not resolved.
• USD Resilience: Weak recent data aside, the USD remains a safe haven. Fed’s Powell reiterated that cuts aren’t imminent.
⚠️ Bias: Bearish as long as price trades below 1.1640. Watching how the market reacts to Fed testimony and ECB rhetoric this week.
🧠 Reminder: Don’t get emotional after vertical rallies. When everyone gets excited, I look for exhaustion. That’s where trades begin.
Note: Please remember to adjust this trade idea according to your individual trading conditions, including position size, broker-specific price variations, and any relevant external factors. Every trader’s situation is unique, so it’s crucial to tailor your approach to your own risk tolerance and market environment.

EURUSD Jun 26 The information and publications are not meant to be, and do not constitute, financial, investment, trading, or other types of advice or recommendations.
Have a nice day ahead.
