I'm selling EURUSD, TOP is in!EURUSD is bearish now. Yes the trend is bullish, I know but I'm entering base on 15 mins BOS.
If you can gamble, this is a beautiful trade. When we see confirmation on a 4hrs timeframe, we enter more
EURUSD_SPT trade ideas


Fundamental Market Analysis for June 26, 2025 EURUSDThe EUR/USD pair continues to rise to 1.16800 during Thursday's Asian session. The US dollar (USD) is weakening against the euro (EUR) as investors worry about the future independence of the US Federal Reserve (Fed). Final data on US GDP growth for the first quarter will be in focus later on Thursday.
US President Donald Trump said on Wednesday that he is considering three or four potential candidates to replace Fed Chairman Jerome Powell. According to the Wall Street Journal, Trump may consider former Fed Governor Kevin Warsh, National Economic Council Director Kevin Hassett, and Treasury Secretary Scott Bessent. Other candidates include former World Bank President David Malpass and Fed Governor Christopher Waller.
This raises questions about a potential weakening of the Fed's independence and a possible decline in its authority, which undermines the dollar and creates favorable conditions for the major currency pair.
Across the Atlantic, European Central Bank (ECB) policymakers are concerned about the economic outlook due to Trump's tariff policy and geopolitical risks. Earlier this week, ECB policymaker François Villeroy de Galhau said that despite current conditions, further rate cuts are still possible. Statements by ECB policymakers may put pressure on the single currency in the near term.
Trading recommendation: BUY 1.16750, SL 1.16300, TP 1.17500
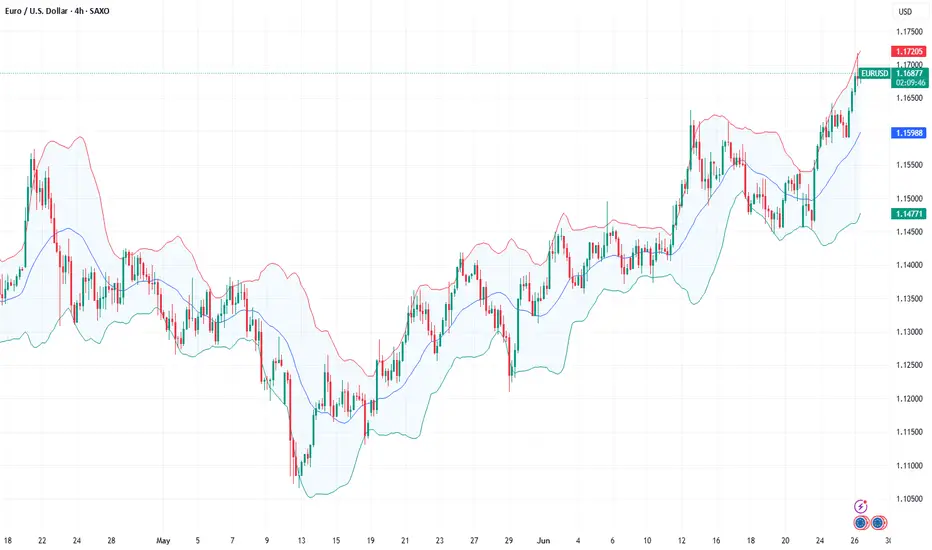
Target achievedThe impulsive rise in EURUSD continues.
This morning, it reached 1,1717 — our first projected target.
This is a good level to take profits.
Now, watch for a pullback and the potential for another move up.
Most of the move should already be captured by this point.
Reduce your risk and avoid using large position sizes.
If the price moves higher again, the next target is 1,1778!
EURUSD | 24.06.2025SELL 1.16100 | STOP 1.16600 | TAKE 1.15400 | Double top pattern (H4) and strong resistance range. The price is expected to decline and consolidate below the level of 1.16100.

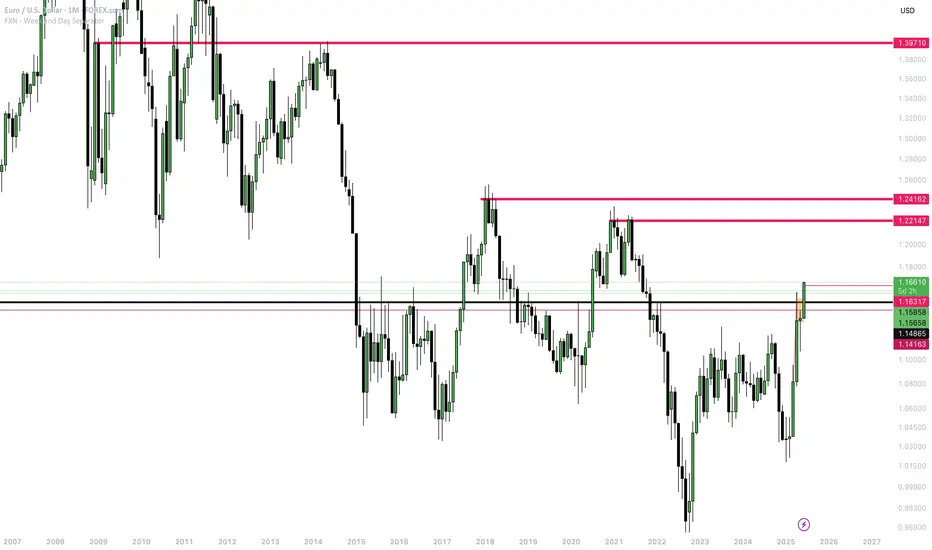
EURUSD For A Long BuyThe EURUSD broke out to the previous resistance level of 1.16317
The next resistance level is 1.22147. weaknesses and instability in the US Economy and its involvement in the Iran-Israeli war, which has resulted in uncertainty (geopolitical risk) among investors.
A Bullish flag pattern on the Daily Timeframe confirmed the break from the previous support, and fueled by the statement above, the Bullish flag pattern will continue to the resistance level 1.22147.
The 1.24162 level could serve as a resistance level if 1.22147 were to turn into support.
The highest level, 1.39710, is a level to watch out for, in the long term, if buying continues.
Conclusion: Current objective is a Buy to 1.22147.
EUR/USD 3-Year Highs Nears Fibo ResistanceThe Fibonacci retracement drawn from the 2021-2022 move in EUR/USD has continued to produce inflections in the pair. It caught the high in 2023 at the 61.8% retracement of 1.1275. And then last year, it set the low in April that led into a vigorous bounce into the end of Q3. Along the way, the 50% marker of that major move was a sticking point producing multiple inflections on both sides of the pair.
And then as EUR/USD came into 2025 sliding lower, it was the 23.6% retracement that came into play to catch the lows at the 1.0200 handle in January. In February, bulls held a higher-low just above that price and by March, prices were ready to jump-higher.
More recently it was the 61.8% retracement at 1.1275 that was back in the picture and with EUR/USD breaking out now to fresh three-year-highs, the look goes up to the next level in the Fibonacci sequence at 1.1686, which is the 76.4% retracement from that same major move.
Notably, EUR/USD is back into overbought territory on weekly RSI and there's also a rising wedge here, often approached with aim of bearish reversal. All that said, bulls are still making the push but if we do see a USD turn stage around quarter-end or the start of Q3, I think EUR/USD remains one of the more attractive venues to seek that out. Meanwhile, both GBP/USD and USD/CAD remain of attraction for USD-weakness to continue. - js

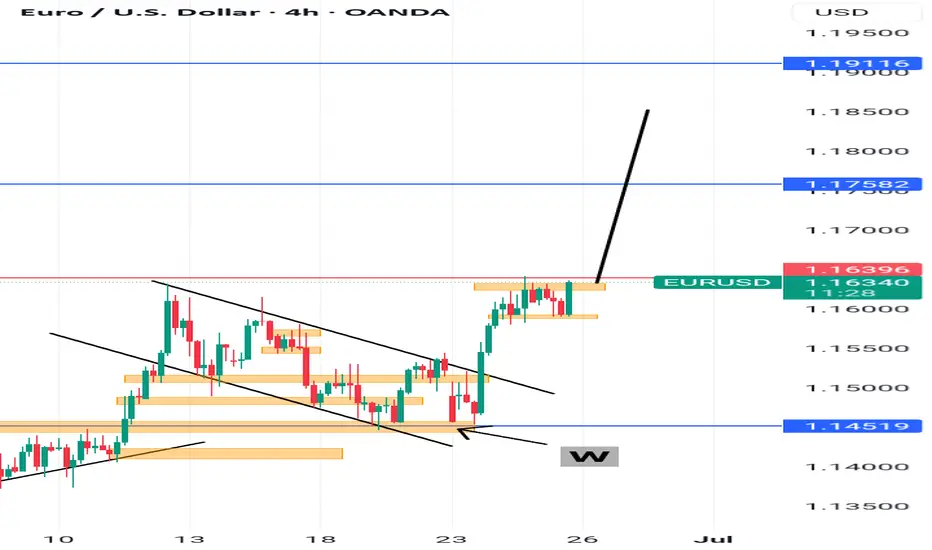
Eurusd Fall ContinuesThe EURUSD extended its recent uptrend yesterday, briefly pushing to the highest level since October 2021, but the move stalled just above 1.16297, the June high and the high for the year. Today’s price action again approached that high but was unable to break above, turning the market lower and back toward a familiar swing area that has defined recent resistance.

EURUSD LAST LIQUIDITY GRAB BEFORE WE CRUSH :))Take 15m SELL as seen on the chart, with help of DIVENGANCE @ LIQUIDITY AREA give me more reason to take this SELL
I can see all the way to 1.113 but we will take profit along the way till final destination
Monday was horrible but Tuesday can be our start of the week :)
Thats trading for you :))

Bullish moveEurusd had a consolidation phase or a bullish flag and there is already a breakout to the upside.
You can be aggressive and enter or wait for a retest and then enter
EUR/USD tests 20 EMA, Lower band of channelEUR/USD ran into resistance at 1.1630 before easing back below 1.15. However, EUR/USD continues to trade in its rising channel, holding above its 20 and 50 SMA for now. The RSI is pointing lower, suggesting momentum is losing steam.
Immediate support is at 1.1450, the 20 SMA, and the lower band of the rising channel is being tested following weak EZ PMIs and as the USD is the safe-haven of choice amid Middle East tensions. A break below here could open the door to 1.14 and 1.1280.
Buyers will look to rise back above 1.15 and 1.1580 to bring 1.1630 and fresh multi-year highs into focus.
FC

EUR/USD at resistanceAs you can see this trend line on the weekly goes back quite a ways, it was supported by and now has become resistance. Unless it closes above on the weekly timeframe, this area is a good short zone

EURUSD Outlook at Risk of Changing in the Short and Medium TermEURUSD is feeling the bearish pressure as geopolitical tensions in the Middle East escalate. These risks are driving traders toward safe havens, particularly the US dollar and US government debt, which still serve as the backbone of global reserves. The sharp decline in the dollar in recent months has added to this dynamic, but it’s not over yet for euro bulls in all the short, medium, and long term.
However, the options market is flashing a rare bearish signal for EURUSD that traders should not ignore. Risk reversals across all maturities from 1 week to 1 year are falling. The 1-week risk reversal dropped sharply from 0.1075 to -1.10 since last Monday, one of the steepest moves seen recently, even though EURUSD itself has remained relatively flat.
The breakout and successful retest of the long-term downtrend from 2008 to 2025 was a key turning point. As long as EURUSD stays above this trendline, dips are likely to be seen as buying opportunities by long-term investors.
For the medium term, however, a bearish signal (for EURUSD) has emerged from the dollar index. The index broke out of the wedge formation (update the post above to see), retested it, and has since resumed its upward move, creating a strong bullish technical setup.
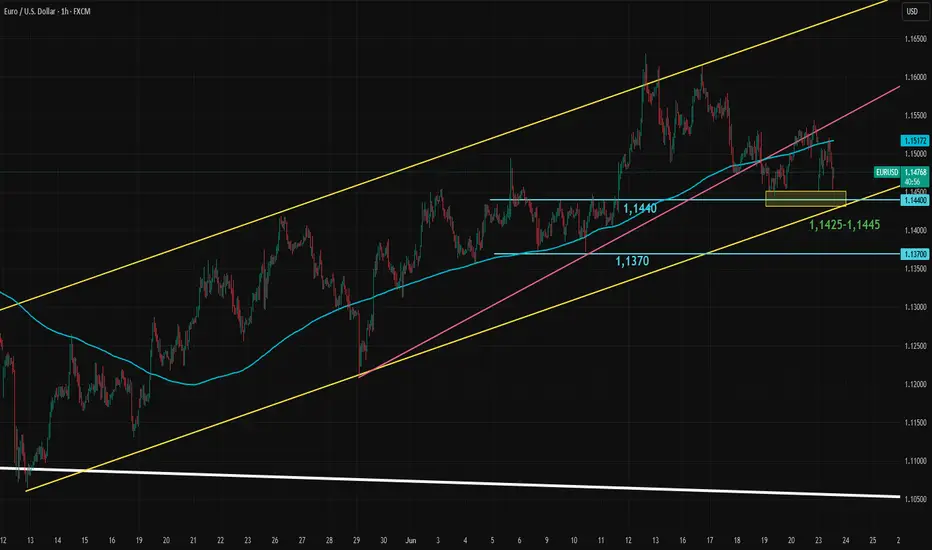
Now, everything comes down to short-term support. EURUSD has been in an upward trend channel since the retest of the long-term trendline and had also formed a shorter-term trend within that channel. This shorter trendline has now broken and been retested. The next critical level is the 1.1425–1.1440 support zone. If this area fails to hold, it could shift both the short- and medium-term direction to the downside.
Note: In this post, "short term" refers to up to one week, "medium term" to one to several weeks, and "long term" to several months to a few years.
EURUSD: Expecting Bearish Continuation! Here is Why:
The recent price action on the EURUSD pair was keeping me on the fence, however, my bias is slowly but surely changing into the bearish one and I think we will see the price go down.
Disclosure: I am part of Trade Nation's Influencer program and receive a monthly fee for using their TradingView charts in my analysis.
❤️ Please, support our work with like & comment! ❤️
EU SHORT TERM BEARS?EURUSD have been bullish overall.
Short term sells coming into place?
Not an A+ Setup, Beware

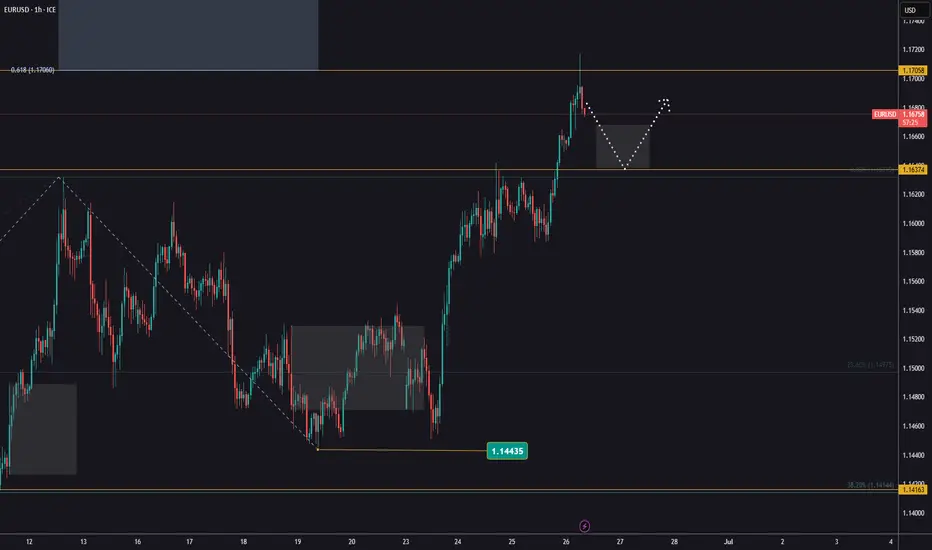
EURUSD – Breakout Confirmed, Now Watching for Retest or 4hr ClosEURUSD has officially broken above the key 1.16020 resistance level on the 4hr chart, but price action has since gone stagnant. No strong bullish momentum has followed the break so far — a sign we may be due for a deeper pullback.
I remain bullish overall, but I'm watching for two potential scenarios:
✅ Safe Buy: Clean 4hr bullish close above 1.16020
🎯 HRHR Buy: Pullback to the former level of interest at 1.14149 if structure holds
Until one of those triggers, I’ll be patient. Let the setup come to you. Overall target remains the 1.18791 zone before reassessing.

Forex and Gold Market Highlights June 21 2025Forex & Gold Market Highlights – June 21, 2025
🕒 Key Events This Week:
• 🏦 Fed officials signaling possible rate cuts vs. cautious economic tone
• 🌍 Escalating Israel–Iran tensions boosting safe-haven flows
• 🏭 Mixed U.S. macro data (retail sales, Philly Fed, housing) shaping Fed expectations
________________________________________
💶 EUR/USD Nears 1.1520 on Safe-Haven Flows
EUR/USD edged up to about 1.1520 amid weakness in the U.S. dollar, driven by global risk-off sentiment. Mixed signals from the Fed kept traders cautious.
________________________________________
💷 GBP/USD Hovering Around 1.3500 on USD Strength
GBP/USD remains near 1.3500, slipping slightly off highs after weaker UK retail data. The pair faces resistance in the 1.3550–1.3600 zone.
________________________________________
💴 USD/JPY Eyeballing 146 Resistance
USD/JPY climbed toward 146.00, driven by risk-averse USD demand and dovish BOJ stance. The pair is testing key retracement resistance near 146.76.
________________________________________
🥇 Gold Pulls Back but Holds Ground
Spot gold slid to around $3,334 3,381 this week, under pressure from a stronger dollar and diminished Fed rate-cut hopes. Still, geopolitical jitters kept it from falling hard.
• Weekly drop of ~2.5%, trading in a $3,330–$3,400 range.
________________________________________
📈 DXY Index Rallies on Risk Aversion
The U.S. Dollar Index rose ~0.45%, marking its strongest weekly gain in over a month due to heightened safe-haven flows amid Middle East tensions.
________________________________________
📌 Market Outlook:
• EUR/USD: Mixed bias. May test 1.1550–1.1600 if risk-off continues; downside risk near 1.1400 if U.S. data surprises.
• GBP/USD: Expected to stay in the 1.3450–1.3550 range; UK economic data and USD momentum will be key.
• USD/JPY: Bullish tilt remains toward 146.76, but any BOJ hints of policy tightening could shake it.
• Gold: Pressure from a firm dollar is likely to persist. Watch for geopolitical developments and upcoming Fed signals for reversal clues.

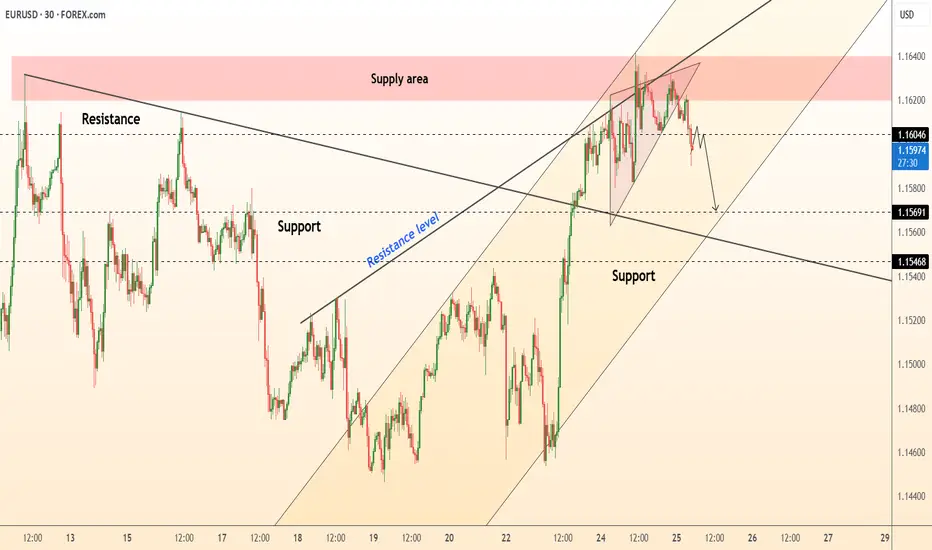
DeGRAM | EURUSD reached the supply area📊 Technical Analysis
● Price formed an intraday rising wedge right inside the 1.1615-1.1635 supply band; the wedge has broken lower and the last two candles closed back under the long-term trendline retest.
● Bearish follow-through is favoured while price stays below 1.1604; first magnet is the confluence of former breakout base and inner channel support at 1.1569, with 1.1547 (mid-June pivot) the next objective.
💡 Fundamental Analysis
● Fresh Euro-area PMIs dipped below consensus while U.S. consumer-confidence beat, widening the short-rate gap and reviving USD bids.
✨ Summary
Sell rallies ≤1.1600; targets 1.1569 → 1.1547. Bias invalid if 30-min candle closes above 1.1635.
-------------------
Share your opinion in the comments and support the idea with a like. Thanks for your support
EURUSD Approaching Liquidity Shelf — Watch for Reaction at 1.164EURUSD remains firmly bullish on all major timeframes, respecting the internal structure of an ascending channel.
• Daily: Price continues to respect both the red trendline and broader purple bullish channel. Buyers are defending the mid-line and pushing toward the upper boundary.
• 4H: Clear higher highs and higher lows. Price recently revisited and bounced off a 4H demand zone (1.14750–1.15000), and is now testing the liquidity zone at 1.16400.
• 1H: Microstructure shows consolidation and possible absorption of liquidity just beneath the 1.16415 high. A clean break and retest of this level may confirm continuation.
Key Levels:
• Resistance: 1.16415 (previous high and liquidity trap)
• Support: 1.14900 (4H demand zone)
• Daily trendline holding as dynamic support
Trade Plan:
• Longs: Await a break and retest of 1.16415 or a retracement to 1.15600 for a more discounted entry.
• Shorts: Not favored unless a strong bearish engulfing forms below 1.1600 with structure shift on the 1H.

Sell EURUSDI'm analyzing EURUSD, and on the 4-hour timeframe, the overall market is in an uptrend. In the 1-hour timeframe, a minor downtrend has been broken, and the price looks like it is showing reversal pattern and if the market breaks that reversal trend then I will look for sell till that red line.
If the market run as per my analysis then I will look for buy along with overall trend after sell.

No change in EURUSDYesterday, EURUSD held above 1,1600 and maintained its bullish momentum.
Keep an eye out for a continuation of the trend and potential new highs.
New buying opportunities may arise after a pullback or on a breakout and retest.
Next target: 1,1706!

eurusd short and then long idea short idea price should come to support zone and retest then it can go high maybe . but for now its a good time to catch up the short

Smart Money Concepts (SMC) principles.Smart Money Concepts (SMC) principles. Here’s a full breakdown of the chart and its annotations:
📊
Chart Details:
Pair: EUR/USD
Timeframe: 4-hour (H4)
Current Price: Around 1.16093 USD
🔍
Key Annotations & Zones:
🟫
Pink Zone (Supply/Resistance Area):
This area includes:
Accumulation
FVG (Fair Value Gap)
Price has recently entered and reacted from this zone.
🔼
Buy Side Liquidity:
Highlighted at the top of the range.
Price swept above recent highs to trigger buy stops (liquidity grab), possibly setting up for a reversal.
🔽
Sell Side Liquidity:
Marked below the previous consolidation range.
Price had previously dipped to collect sell-side liquidity before moving upward.
📈
Accumulation:
This phase occurred before the bullish breakout.
Suggests institutional buying or smart money positioning.
📉
FVG (Fair Value Gap):
Imbalance between buying and selling, typically gets filled.
Marked in the pink zone where price may return before continuing its move.
📌
Price Structure Analysis:
The chart shows a classic liquidity sweep setup:
Price grabs buy-side liquidity.
Enters a supply zone.
May return to fill the FVG.
Potential reversal or bearish reaction from this zone.
✅
Trading Implications:
Bearish Scenario:
Price may reject from the pink supply zone after the buy-side liquidity sweep, filling the FVG and possibly heading toward previous lows.
Bullish Scenario (less likely immediately):
If price holds above the pink zone, it could continue trending upward.
