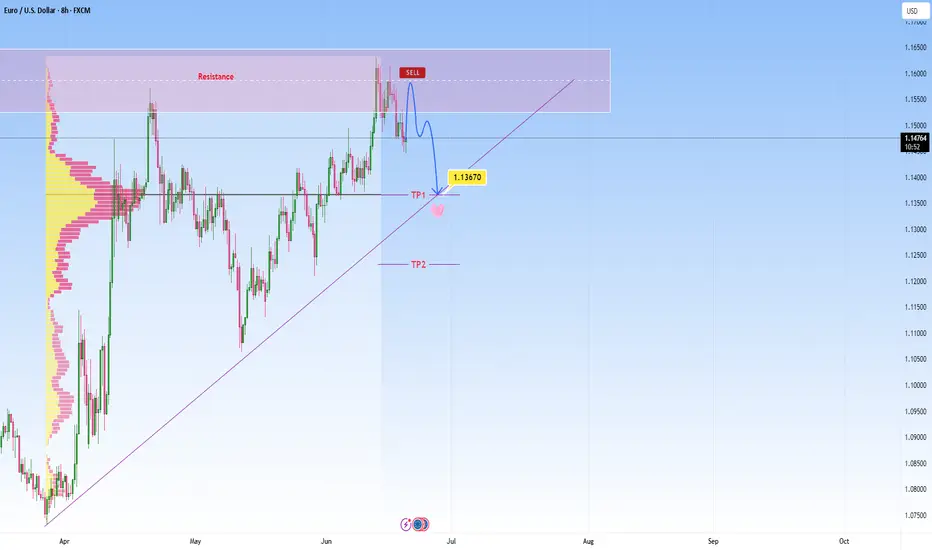
SHORT ON EURUSD 📋 **TRADE PLAN FOR MT4/MT5**
**Trade Type:** Sell
**Entry Zone:** `1.1730 – 1.1740` (wait for rejection or bearish candlestick confirmation)
**Stop Loss:** `1.1755` (above recent highs and resistance box)
**Take Profit Levels:**
* **TP1:** `1.1537` (previous support)
* **TP2:** `1.1450` (strong demand zone)
**Position Size:** Adjust based on risk management (e.g., 1–2% of account)
**Risk-Reward Ratio:**
* To TP1: \~1:3
* To TP2: \~1:5
✅ **TRADE MANAGEMENT RULES**
* ✅ Enter only after bearish candlestick (e.g., pin bar, engulfing) confirmation
* 🔄 If SL hits, reassess higher timeframe structure
* 🔒 Lock profits at TP1 (e.g., trail SL or partial close)
* 🗓 Watch for high-impact news (e.g., NFP, CPI) that may affect USD volatility
EURUSD_SPT trade ideas
EURUSDased on the information from various financial news and analysis sources, EURUSD appears to be on an upward trend. Here's a summary of the key points:
Overall Sentiment:
Many analyses suggest a bullish outlook for EUR/USD, with the pair holding substantial gains and hinting at higher highs.
EURUSD Under Pressure! SELL!
My dear subscribers,
My technical analysis for EURUSD is below:
The price is coiling around a solid key level - 1.1726
Bias - Bearish
Technical Indicators: Pivot Points High anticipates a potential price reversal.
Super trend shows a clear sell, giving a perfect indicators' convergence.
Goal - 1.1612
My Stop Loss - 1.1783
About Used Indicators:
By the very nature of the supertrend indicator, it offers firm support and resistance levels for traders to enter and exit trades. Additionally, it also provides signals for setting stop losses
Disclosure: I am part of Trade Nation's Influencer program and receive a monthly fee for using their TradingView charts in my analysis.
———————————
WISH YOU ALL LUCK

SHORT ON EUR/USDEUR/USD has a rising wedge within a consolidation zone.
The dollar looks like it will rise which will cause this pair to fall.
I will be selling EU looking to catch 150-300 pips this week.

EURUSD BUY SETUP 1:5HELLO HOW ARE YOU ?
What i think about market ?
I Think the market will take liquidity
and will reach imbalance , then touch the supply area
and last will go up boooom

Market Insights with Gary Thomson: 30 June - 4 JulyMarket Insights with Gary Thomson: Eurozone Inflation, US Jobs, ISM PMIs, ECB Forum Updates
In this video, we’ll explore the key economic events, market trends, and corporate news shaping the financial landscape. Get ready for expert insights into forex, commodities, and stocks to help you navigate the week ahead. Let’s dive in!
In this episode, we discuss:
— Euro Area Inflation Rate YoY Flash
— US Nonfarm Payrolls and Unemployment Rate
— US ISM Manufacturing and Services PMI
— ECB Forum on Central Banking
Note: U.S. markets may see thin trading ahead of the 4 July holiday, raising volatility risks.
Don’t miss out—gain insights to stay ahead in your trading journey.
This video represents the opinion of the Companies operating under the FXOpen brand only. It is not to be construed as an offer, solicitation, or recommendation with respect to products and services provided by the Companies operating under the FXOpen brand, nor is it to be considered financial advice.

#EURUSD: +770 Pips Swing Move, DXY to Plumment! EURUSD is extremely bullish and is on track to cross the 1.21 area in our long-term swing plan. Based on recent price action, we have set two targets. As DXY continues to drop, the price is likely to remain bullish in the coming days or weeks. Please use accurate risk management while trading and consider this analysis.
Good luck and trade safely!
-Like
-Comment
-Share
Team Setupsfx_

DON'T BE CAUGHT OFFGUARD, EURUSD IS BEARISHEurusd is bearish, it is selling. Don't be caught off guard. Once we see another clear BOS, we enter more. I want you to learn compounding with this trade. I want you to learn holding trade. You can create separate account for my trades and you will see the huge difference it will make in your trading account.
Follow me as my trades are mostly market orders so you'll see them on time and enter on time.

MarketBreakdown | EURUSD, GBPUSD, USDJPY, USDCHF
Here are the updates & outlook for multiple instruments in my watch list.
1️⃣ #EURUSD weekly time frame 🇪🇺🇺🇸
The pair is unstoppable.
The market violated a significant weekly resistance cluster last week.
It opens more growth potential after a pullback.
2️⃣ #GBPUSD weekly time frame 🇬🇧🇺🇸
In comparison to EURUSD, GBPUSD is now approaching a major
resistance area. I think that we can expect a retracement from that.
3️⃣ #USDJPY daily time frame 🇺🇸🇯🇵
The market continues a correctional movement lower.
The closest strong support that I see is based on a rising trend line.
I think that buying interest may spark again after its text.
4️⃣ #USDCHF daily time frame 🇺🇸🇨🇭
The price updated a historic low on Friday.
The next strong support that I see is based on a falling trend line.
We can expect a pullback from that.
Do you agree with my market breakdown?
❤️Please, support my work with like, thank you!❤️
I am part of Trade Nation's Influencer program and receive a monthly fee for using their TradingView charts in my analysis.

EU on 4HEU on 4H - pretending to be bullish. showing signs to go up but on lower timeframe it shows it can be scalped the way through

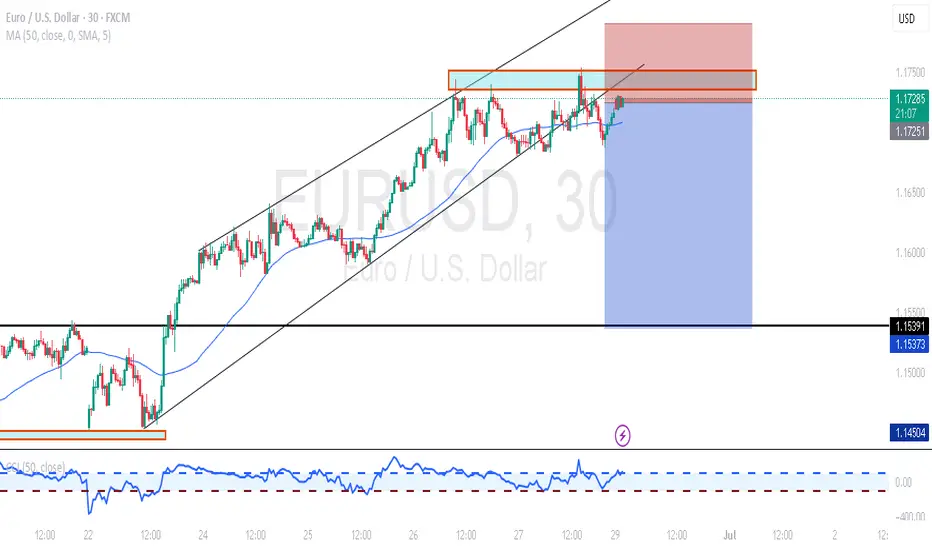
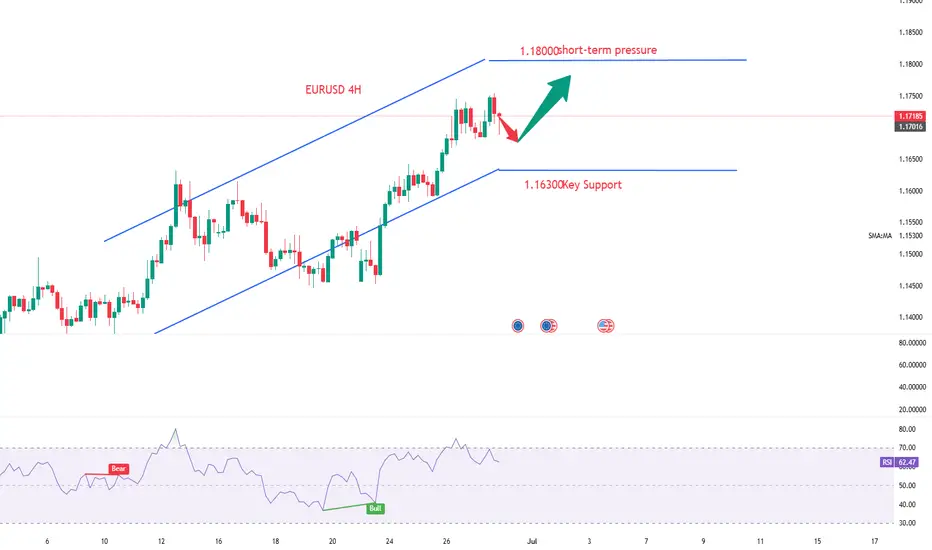
EURUSD heads towards resistance, short-term reversal expectedEURUSD has been in a strong uptrend, and we’re currently observing price action is reaching a notable resistance zone. I am watching for a reversal here as marked on my chart, not expecting a major move, but rather a short-term rejection with a downside target at around 1.13670 , which also aligns with the POC.
This is where it can become a decision point, either price finds support and bounces, or it breaks below, and that’s when we might see the move start to extend lower.
If we get a decisive breakdown through that ascending trendline, my next area of interest is marked as TP2. From there we can expect either potential accumulation or another reaction, depending on broader market sentiment at the time.
That said, we're navigating a complex backdrop currently:
The EU macro environment is under pressure, as weak economic data from Europe is contributing to cautious sentiment around the euro.
Meanwhile, a sustained USD bid continues, supported by stronger U.S. growth expectations, favorable yields, and persistent global demand. This further weighs on EURUSD.
Adding to the uncertainty, escalating tensions between Israel and Iran have rattled markets this week. This geopolitical risk could be pushing oil prices higher:
It’s important to note that if price convincingly rejects here and loses structure, especially with high volume and obvious bullish structure, this setup would become invalid. In that case, I would reassess and adapt
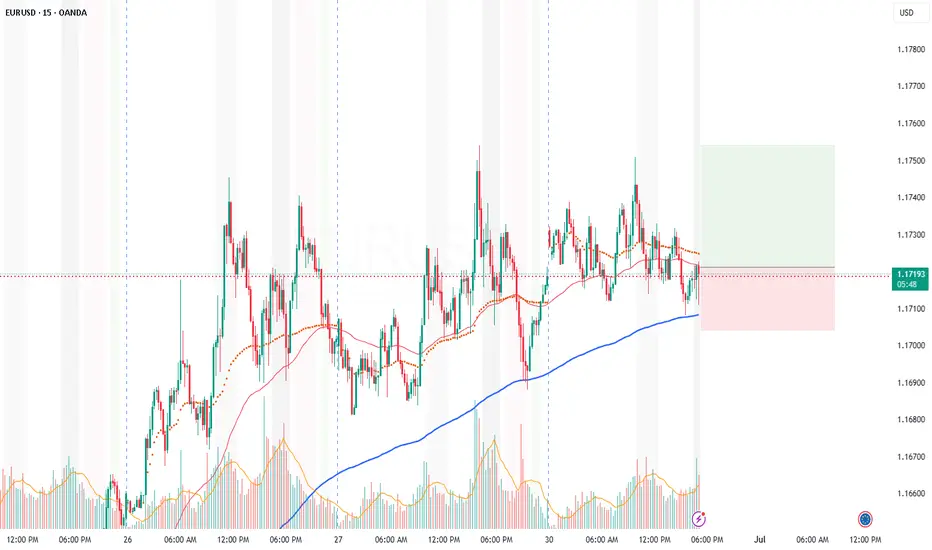
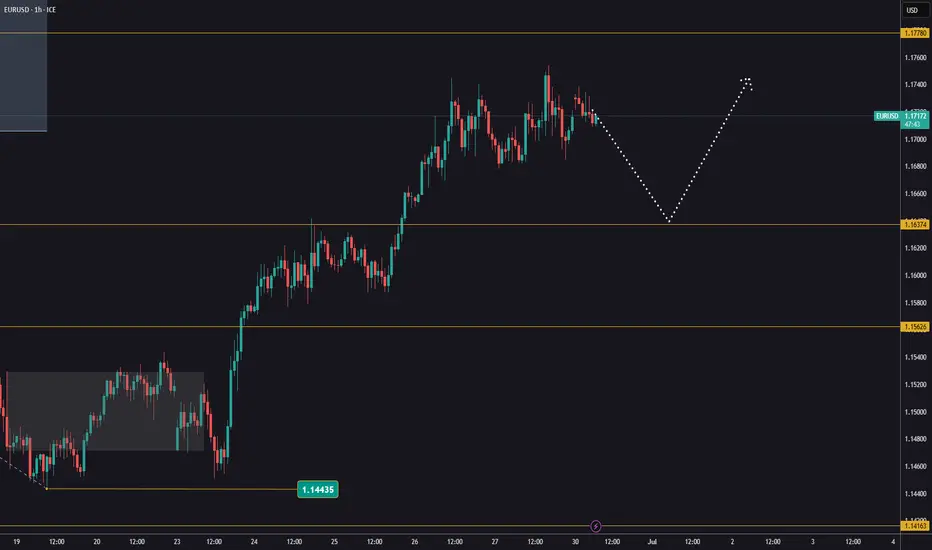
EURUSD pullbackEURUSD remains above 1,1700 on the final day of the quarter.
This week, all eyes are on the upcoming U.S. jobs data, set to be released on Thursday due to the market holiday on Friday.
Watch for a potential pullback, which could offer a new buying opportunity.
Key support levels are at 1,1635 and 1,1562.
The goal: continuation of the trend and a new high.
EUR/USD likely movementI wonder how during a historic recession and possible collapse of the European Union, the euro continues to rise. One thing is for sure, something dark is coming.
EUR/USD BULL RAID: Quick Profit Heist Before the Drop!🏴☠️ EUR/USD "The Fiber" HEIST ALERT: Bullish Loot Before the Trap! 🚨💰
🌟 Greetings, Market Pirates & Profit Raiders! 🌟
Hola! Oi! Bonjour! Hallo! Marhaba! 🤑
🔥 Thief Trading Strategy Activated! 🔥
Our bullish heist on EUR/USD is LIVE—time to swipe the loot before the bears set their trap! 🎯💸
📈 Entry (Vault is OPEN!):
Buy Limit Orders preferred (15M/30M swing levels).
Alert up! Don’t miss the breakout.
🛑 Stop Loss (Escape Route):
Nearest Swing Low (1.15200) on 30M TF.
Adjust for your risk & lot size—no reckless robberies!
🎯 Target (Profit Hideout): 1.16400
Scalpers: Stick to LONG only—trail your SL to lock gold!
Swing Traders: Ride the wave or split the haul.
⚡ Why This Heist?
Bullish momentum + weak bears = perfect robbery conditions.
Overbought? Yes. Risky? Absolutely. But thieves thrive in chaos!
📢 Pro Tip:
Avoid news spikes (volatility = jail time for unprepared traders).
Trailing SL = Your Getaway Car.
💥 BOOST THIS PLAN!
Hit 👍, share 🔄, and let’s drain this market together! More heists coming—stay tuned! 🚀🐱👤
(Disclaimer: Trade smart. We’re thieves, not gambleers.)

EURUSD BEARISH REVERSAL At the top 1.1745, we see strong rejection wicks and bearish engulfing candles, hinting at exhaustion of buyers, Market entered sideways consolidation between 1.1680 and 1.1740, Price failed to break out of this range multiple times — forming a range-bound or distribution phase.
The current bullish candle indicates a temporary relief rally after recent bearish pressure, Rejection from 1.1720–1.1740 may send price back to test 1.1690 or lower.

EURUSD..BUYAnalysis complete — scenarios outlined. The zone could be a decision point for . Price reaction here may define the next move.
If price breaks and pulls back to retest, a reversal setup might emerge.

EURUSD: Short Trading Opportunity
EURUSD
- Classic bearish setup
- Our team expects bearish continuation
SUGGESTED TRADE:
Swing Trade
Short EURUSD
Entry Point - 1.1717
Stop Loss - 1.1764
Take Profit - 1.1614
Our Risk - 1%
Start protection of your profits from lower levels
Disclosure: I am part of Trade Nation's Influencer program and receive a monthly fee for using their TradingView charts in my analysis.
❤️ Please, support our work with like & comment! ❤️

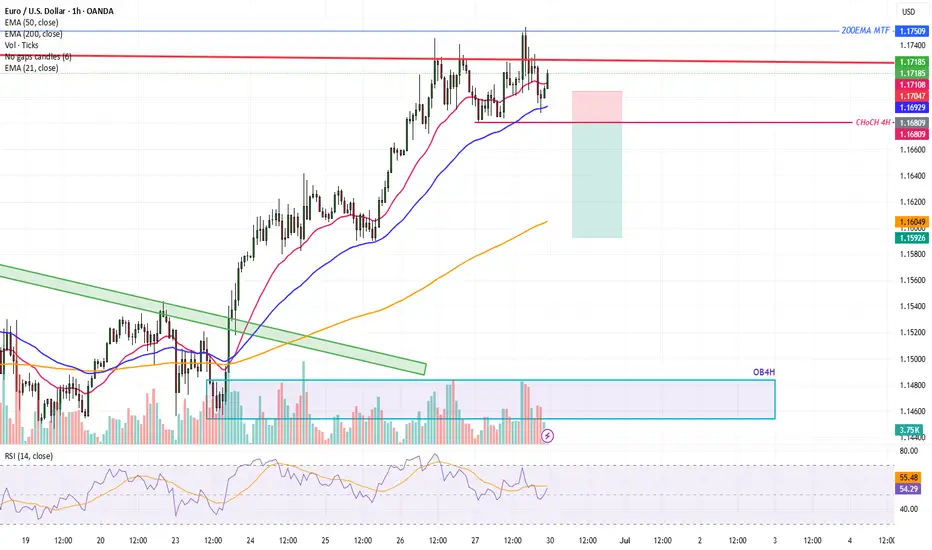
EURUSD Trade IdeaEURUSD is Bullish, on the weekly and daily time frame.
With RSI near the overbought region on the daily timeframe, there is a great probability that the trend perform a pull back to the support level @1.1590 zone.
If the trend break the CHocH at the 4Hr timeframe (body candle not wick), then will go short till 1.1600 level. If the news this coming week are in favor of the USD, we might see more drawdown till the Order block OB4H.
Let's be patient and watch the market carefully
Good Luck!
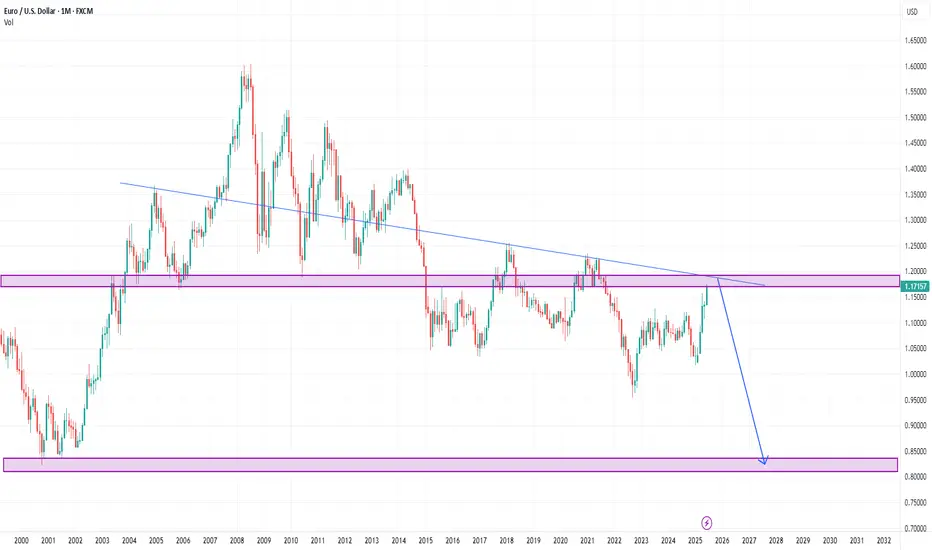
EURUSDWe are expecting more strength in EURO after small correction towards 1.18 level.
Disclosure: We are part of Trade Nation's Influencer program and receive a monthly fee for using their TradingView charts in our analysis.

Are Technical Charts Fully Bullish on Euro's Rebound OverheatingThe EUR/USD exchange rate is consolidating at high levels, posting gains for the seventh consecutive trading day. The pair briefly approached the three-year high of 1.1744 in intraday trading, accumulating a roughly 2% weekly gain so far. This rally is primarily driven by intensified expectations of U.S. rate cuts and temporary easing of geopolitical tensions.
In terms of technical indicators, the MACD's DIFF and DEA lines continue to rise, with the red histogram expanding again, demonstrating "bullish volume expansion" and showing no signs of exhaustion in the technical rebound. The RSI stands at 70.39, nearing overbought territory but without forming a top divergence, suggesting remaining upside potential.
The current price structure indicates the pair is approaching the key resistance of 1.1744. Analysts believe an effective breakout above this level would open the door to the upside target of 1.1810-1.1850. In case of a pullback due to resistance, the initial support lies at 1.1630, corresponding to the previous dense trading zone and short-term moving average support.
you are currently struggling with losses,or are unsure which of the numerous trading strategies to follow,You have the option to join our VIP program. I will assist you and provide you with accurate trading signals, enabling you to navigate the financial markets with greater confidence and potentially achieve optimal trading results.
EURUSD JUNE MONTH DELIVERY & NFP week ideasEURUSD
JUNE MONTH DELIVERY
*June closes with a expansion/accumulation monthly candle
*Price wicked to the Weekly SIBI from sept 2021
*Price expanded to come just below the parent range .79 Premium
*Note since May 13 price has been in a buy program with little retrace
*Price is delivering to a Premium market taking key equal highs last week
June 27 DELIVERY
*Thursday into Friday price consolidates
*Asia takes minor equal lows
*2 London macro expands to the buy side
*small retrace
*6 macro starts the expansion cycle to send Price to take equal highs
*10 silver bullet price reverses Londons delivery taking minor sell side
*14:00 macro Price retraces to close rebalancing NY am delivery
*Price closes just above the 50 in a premium
NFP WEEK IDEAS
Deep premium with little retrace last week-over bought
*I suspect that we could see a retrace/reversal beginning of NFP week
*could we see price come to the current range 50 level 1.16037
*Note the EV is in a discount could price retrace to that target for the week
June 30 IDEAS
*Parent bias is bull stick to it this week
*Sundays delivery Price could retrace to minor equal highs at the .618
*Note Dealers range is already 32 pips-setting up for a potential larger expansion day
*watch out for a possible consolidation cycle Monday-typical profile is expansion but we will see with no news
*Sundays delivery could consolidation
*Watch for reaction at .618 at minor equal highs
*see if we swing for higher prices in Asia to London and lower in NY for Mondays suspected delivery-read what the chart prints this is just an idea-its not my gospel

EurUsd Scenario.This how i see eurusd for now .. Indeed Dxy is going Uppp !! While E/U is heading down .
I will see how it goes .
Hapii Trade'ing

Eurusd Short-term bearish EUR/USD is showing bearish momentum, breaking below key support with lower highs forming. Selling pressure is increasing amid a stronger USD outlook, favoring a short position.
