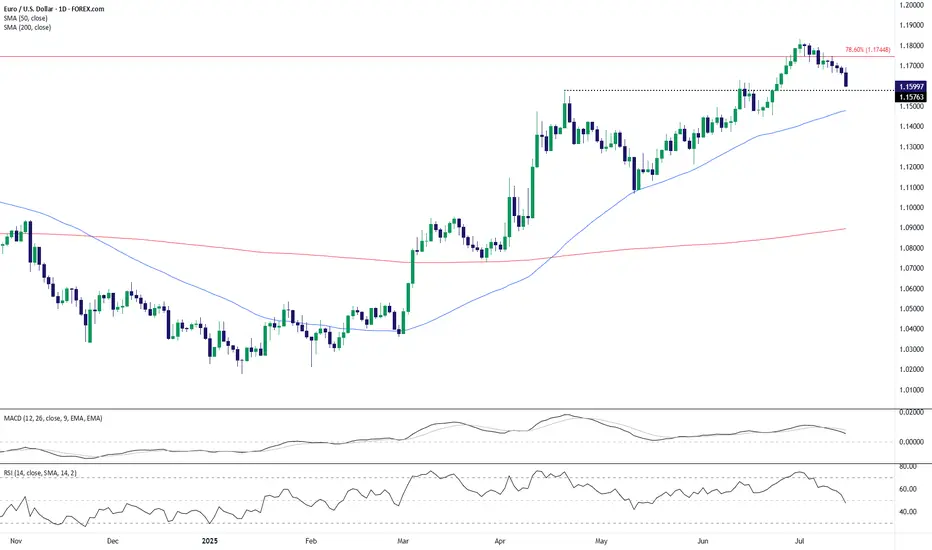
EUR/USD Technical Outlook: Bearish Momentum Builds Below Key ResEUR/USD has broken down from its recent highs near the 1.1750 resistance area, which coincides with the 78.6% Fibonacci retracement level. The pair is now trading around the 1.1600 handle, slipping below a short-term support zone near 1.1576. This breakdown signals potential continuation of bearish pressure in the coming sessions.
The 50-day SMA (1.1477) remains upward sloping, but the price action has now decisively turned lower, with a series of lower highs forming after the July peak. The MACD histogram is fading, indicating waning bullish momentum, and the RSI has dropped to 47.7—losing the bullish bias and heading toward bearish territory.
If EUR/USD cannot reclaim the 1.1576–1.1600 zone quickly, a deeper pullback toward the 50-day SMA or even the 1.1450–1.1500 range may unfold. On the upside, bulls would need to push back above the 1.1750 resistance to regain control, but given the loss of momentum and structure, the near-term bias favors the bears.
-MW
EURUSD_SPT trade ideas
EUR/USD Fibonacci Resistance - Rising Wedge BreakEUR/USD came into Q3 with a full head of steam, setting a fresh three-year high on the first day of the new quarter. But bulls couldn't make much progress after that and a key Fibonacci retracement continued to hold buyers at bay, until eventually sellers were able to take-over and make a more noticeable dent after this morning's CPI data.
The breakout in USD helped to prod a breakdown in EUR/USD, and bears now have an open door to run a short-term trend. There's now resistance potential at prior support of 1.1631 and 1.1663, and there's deeper support potential at 1.1543 and 1.1457. - js

EURUSD Bearish this weekabout my analysis I think this week EURUSD is Bearish
But our Structure in HTF is Strongly Bullish

EURUSD OUTLOOK 15 - 18 JULYCore CPI m/m came in light which gave a mixed signal at first but CPI y/y was higher than expected which eventually moved EU lower.
The last two analysis that I posted were more longer term focused so this time I will be giving a more short term outlook.
Currently the dollar is stronger based on the recent news that has been coming out and because of that I am still looking to short this pair keeping in mind that it is only the internal structure that is bearish and the swing structure is still bullish

EURUSD BEARISH SETUP: 15 JULY 2025This is a 4-hour chart of the EUR/USD currency pair, and it includes several key technical elements:
---
🔍 Overall Market Context
The price is in a downtrend, clearly shown by the descending channel (highlighted with yellow lines).
The price just broke below the lower boundary of that channel, indicating potential bearish continuation.
The chart includes support/resistance levels, pivot points, and a projected path suggesting possible price behavior.
---
🔧 Key Technical Elements
1. Price Action & Structure
Recent price action shows a strong bearish move (large red candle), suggesting strong selling pressure.
The move bounced off S2, a weekly pivot support level, and entered a demand zone (green area).
2. Projected Scenario (Black Line Path)
A potential pullback to 1.16586 (key resistance).
If price fails to break above that resistance, it's expected to drop again.
Possible next supports:
1.15842
1.15228
Final target: 1.14550
3. Pivot Levels
Weekly Pivot: Near 1.17100 area (currently above the price — bearish implication).
S2 level: Around 1.15900 — presently acting as short-term support.
R1, R2, etc., are above and could act as resistance in a retracement.
---
📊 Summary of Trade Outlook
🔻 Bearish Bias (Short-Term to Medium-Term)
Main idea: This chart reflects a bearish breakout of a descending channel.
Entry Zones: After a potential pullback to resistance (1.16586)
Targets: 1.15842 → 1.15228 → 1.14550
Invalidation: A Bullish break above 1.16586 could invalidate the bearish setup.
---
✅ Trading Considerations
Wait for confirmation of rejection at 1.16129 or 1.16586 before shorting.
Watch for volume confirmation on the pullback.
Monitor fundamentals (e.g. ECB or Fed news) as they can drive sudden volatility.

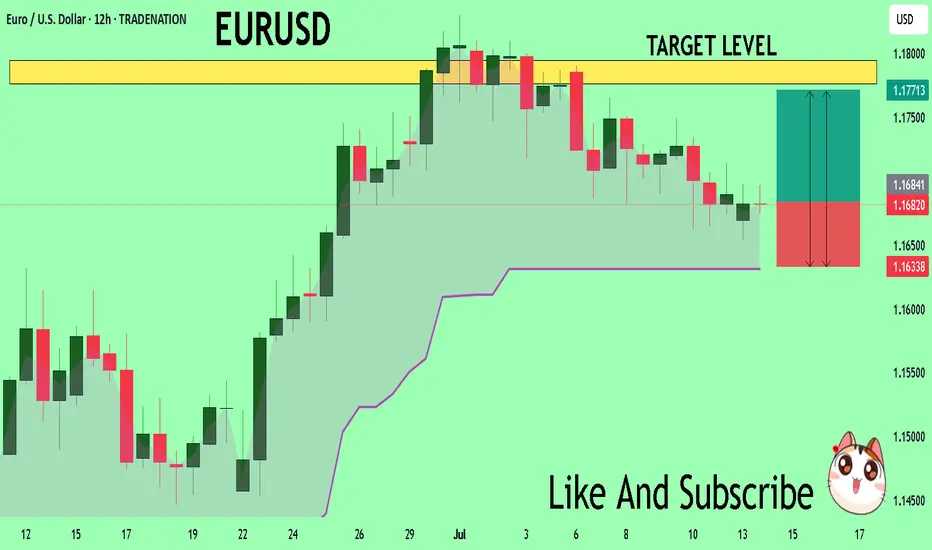
EUR_USD BEARISH BREAKOUT|SHORT|
✅EUR_USD was trading along
The rising support line but
Now we are seeing a strong bearish
Breakout and the breakout is
Confirmed so we are bearish
Biased and we will be expecting
A further bearish move down
After the potential pullback
SHORT🔥
✅Like and subscribe to never miss a new idea!✅
Disclosure: I am part of Trade Nation's Influencer program and receive a monthly fee for using their TradingView charts in my analysis.

EURUSD CONTINUATION UPSIDEI see 4H liquidity above, before it goes another high let the thing sweep first.
See entries below, always look for lower timeframe for entries at 15min-1min.
I only share more swing trades, so better capitalize it, I do swing too. GOODLUCK.
Don't be a 90% trader who gamble daily, try with swing. specially on my GOLD charts updates.
ciao.. keep winning fellas, you can also reach me on my X account. I do share too

#EURUSDStill playing so hard!!!! Eur/usd is really waitng for aa breakout, since following the Resistance and pattern .
looking for a bullish side for now.....but its bearish this week.
whats your analysis....traders!!

#AN021: TRUMP Threats on Tariffs and FOREX Tensions
Global markets are waking up to a currency cold war. Hi, I'm Trader Andrea Russo, and today I want to share the latest news with you.
Donald Trump set the day alight, launching a barrage of threats from a rally in Ohio:
"If re-elected, I will impose 60% tariffs on all of China, 20% on Mexico, and 10% on the European Union. And I'm telling Putin clearly: if you continue to help China evade our embargoes, we will hit Russia too."
The words reverberated across global investment banks, triggering an immediate reaction in the dollar and emerging market currencies.
Markets React: USD Soars, GBP and NOK on Alert
The US dollar gained ground against nearly all major currencies, while the GBP collapsed under pressure from fears of a BoE rate cut and a slowing labor market.
The GBP/NOK pair, in particular, is showing signs of a structured bearish breakout: the pound is under dual pressure (domestic politics + trade war), while the Norwegian krone is indirectly benefiting from rising energy prices and pro-commodity sentiment.
US CPI at 2:30 PM: The Real Detonator
The US core inflation figure will be released at 2:30 PM Italian time. The consensus is for +3.4%, but a higher reading could push the Fed to remain more hawkish for longer. This would strengthen the dollar and create new shock waves in weak and emerging market currencies.
Specifically:
USD/JPY could break above 162.00 with strength.
GBP/USD risks a break below 1.29.
USD/SEK and USD/MXN are the key pairs to watch for explosive movements.
Trump vs. Powell: A Showdown
Meanwhile, fears are growing of a direct attack by Trump on the Fed. According to Deutsche Bank, markets are underestimating the possibility that Trump will attempt to remove Jerome Powell if he returns to the White House.
"The market is ignoring the Trump-Powell variance. If he really tries, the dollar could fall 4% in a week," – Deutsche Bank
We are about to enter the best time of the month for Forex. Those who get their timing wrong today will burn capital. Those who wait for the right signal can ride the trend arising from a predicted global crisis.

LONG EURUSD I am LONG on this pair at time of writing.
IT is important to adjust your paper profits NOT SO high that it will wipe you out and you need to restart at a higher buying price. Say you have 2 contracts and is in profits position, you can take 1 contract or 0.5 or 1.5 size and leave the remaining to run at breakeven SL position. That way, if you are riding on the market trend, then your remaining position be it 0.5 or 1.5 will still benefit and you can just accumulate as it trends up.
This works for me but may not be for everyone. Choose a strategy that fits you. Different folks, different strokes.

The Day AheadMacro Data Highlights
United States
June CPI – Crucial inflation gauge; likely to shape Fed rate expectations.
Empire Manufacturing Index (July) – Regional economic activity snapshot.
China
Q2 GDP – Key read on the health of the world’s second-largest economy.
June Retail Sales / Industrial Production / Home Prices – Important for tracking domestic demand and real estate trends.
Europe
Germany & Eurozone ZEW Surveys (July) – Investor sentiment indicators, especially relevant amid sluggish European growth.
Eurozone May Industrial Production – Tracks output momentum in manufacturing-heavy economies.
Italy May Government Debt – Sovereign debt level insights amid fiscal scrutiny.
Canada
June CPI – Important for BoC policy outlook.
Existing Home Sales / May Manufacturing Sales – Indicators of economic activity and housing market resilience.
Central Bank Speakers
Fed: Bowman, Barr, Collins, Barkin – Watch for comments on inflation and rate cut timing.
BoE: Governor Bailey – May impact GBP and UK rate expectations.
Earnings (Focus: Financials)
JPMorgan Chase, Wells Fargo, Citigroup, Bank of New York Mellon, BlackRock
Q2 results will offer insights into:
Net interest income trends
Credit quality & loan growth
Capital market activity (BlackRock focus on AUM and inflows)
Trading Takeaway
U.S. CPI and bank earnings are the top market movers – inflation print could shift rate cut expectations for September.
China data may influence commodity and EM sentiment.
Fed/BoE speakers may provide policy clarity amid disinflationary trends.
Financials earnings will be key to market tone, especially for value stocks and financial sector ETFs.
This communication is for informational purposes only and should not be viewed as any form of recommendation as to a particular course of action or as investment advice. It is not intended as an offer or solicitation for the purchase or sale of any financial instrument or as an official confirmation of any transaction. Opinions, estimates and assumptions expressed herein are made as of the date of this communication and are subject to change without notice. This communication has been prepared based upon information, including market prices, data and other information, believed to be reliable; however, Trade Nation does not warrant its completeness or accuracy. All market prices and market data contained in or attached to this communication are indicative and subject to change without notice.
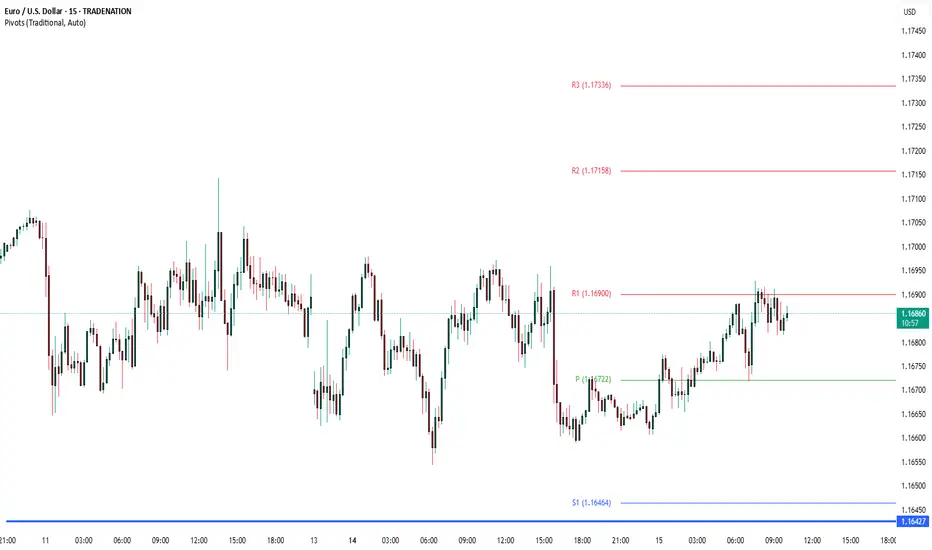
EURUSD: Move Up Expected! Long!
My dear friends,
Today we will analyse EURUSD together☺️
The market is at an inflection zone and price has now reached an area around 1.16869 where previous reversals or breakouts have occurred.And a price reaction that we are seeing on multiple timeframes here could signal the next move up so we can enter on confirmation, and target the next key level of 1.16975.Stop-loss is recommended beyond the inflection zone.
❤️Sending you lots of Love and Hugs❤️

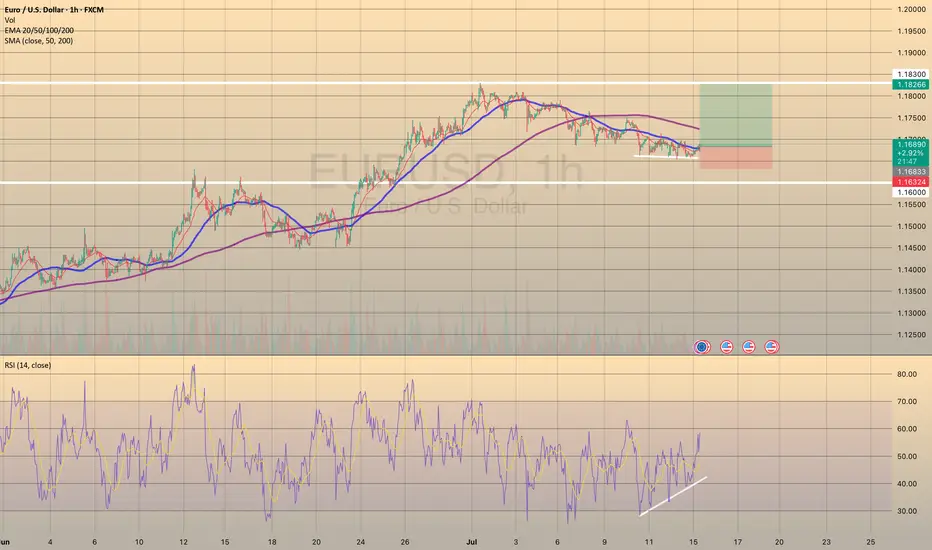
EURUSD SEEMS TO FIND SUPPORT
TRADING IDEA UPDATE - EURUSD SEEMS TO FIND SUPPORT🦾
EURUSD seems to find support on a trendline and shows us divergence on RSI on 1-h timeframe. So, I decided to close my trade in advance before my stop loss gets triggered and open long position with a
🔼 a market buy order at 1.16833 with
❌a stop loss at 1.16324 and
🤑a take profit at 1.18266
Additionally, today is the U.S. CPI report data coming out. Market expects the annual inflation to be around 2.7%. Me, personally, think that actual June inflation will be a bit lower, which may provide some fundamental support to the EURUSD. Will see.
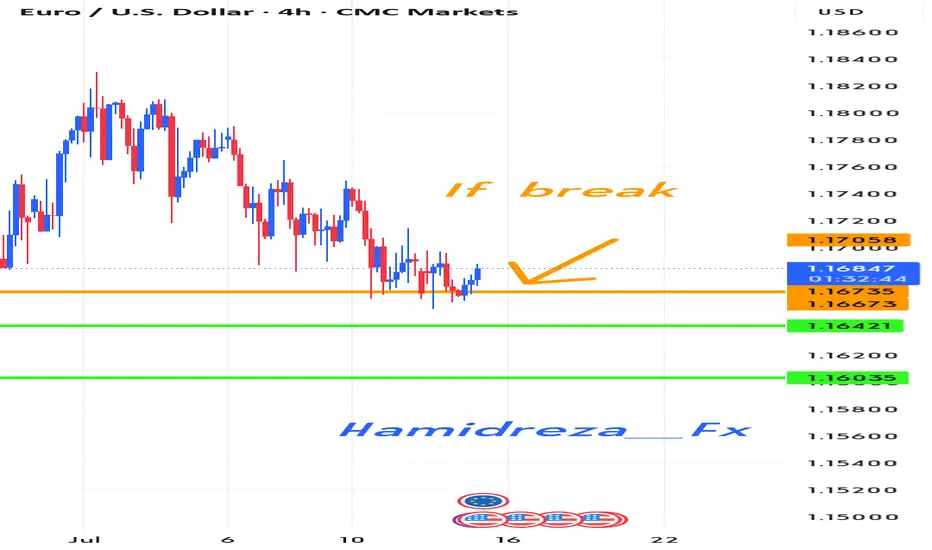
Could something similar happen to the EURUSD?
Hi everyone
We are in a state of downward suffering
This state of suffering seems to continue
Of course, there is a condition that if the condition is met, we will probably see the first and second goals.
LONG | EUR/USD | 1DCurrent Level: ~1.1662
Revised Entry Zone: 🔄 Buy the dip around 1.1660–1.1670
This aligns with 50-day EMA and daily/4H pivot (~1.1630–1.1670) acting as support.
Stop Loss: 1.1630 (just below 50 EMA & recent low)
Target: 1.1750 → 1.1800 (range high/resistance)
Risk:Reward: ~1:3.8
✅ Institutional Rationale:
Momentum remains bullish, though momentum indicators are cooling—price retesting structural support (mid-BB, pivot zone).
Weekly outlook still favors bulls while above 1.1637–1.1670—suggesting accumulated buy orders in this zone.
Event risk: U.S. employment and Fed speakers imminent—creates ideal buy-on-dip opportunities with tight stops.

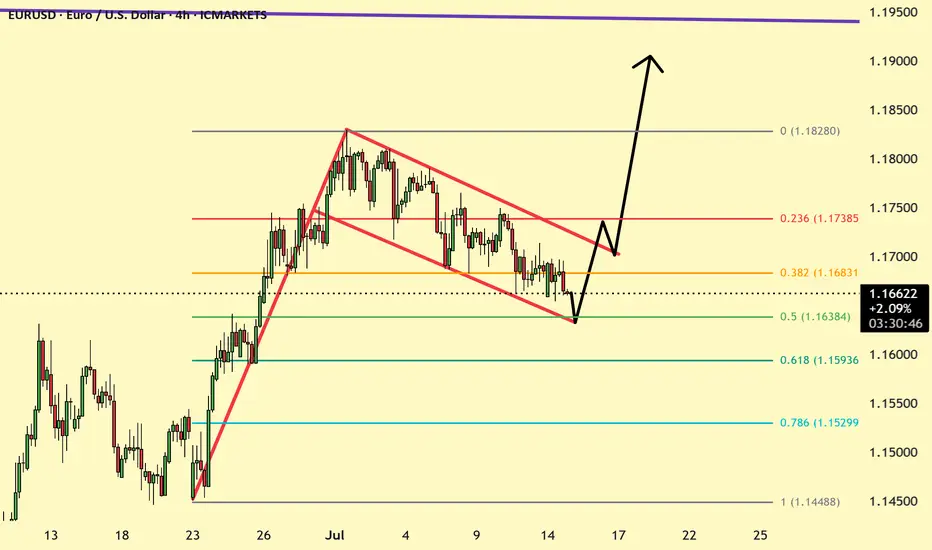
EURUSD at Fib 0.5 and bullish flagEURUSD has formed a bullish flag and also price has reached the fib 0.5 level from where price will pullback and Price is likely to go up around 1.19.
EUR/USD 4H POSSIBLE TRIGGERChart is setup and ready to take the trade at the top of the hour. Looks to me like the EUR/USD is heading down.

EURUSD Sellers In Panic! BUY!
My dear followers,
This is my opinion on the EURUSD next move:
The asset is approaching an important pivot point 1.1684
Bias - Bullish
Safe Stop Loss - 1.1633
Technical Indicators: Supper Trend generates a clear long signal while Pivot Point HL is currently determining the overall Bullish trend of the market.
Goal - 1.1776
About Used Indicators:
For more efficient signals, super-trend is used in combination with other indicators like Pivot Points.
Disclosure: I am part of Trade Nation's Influencer program and receive a monthly fee for using their TradingView charts in my analysis.
———————————
WISH YOU ALL LUCK
Posible trade bueno With expectations of a bearish bias today, I'm looking for short entries. With an entry in a bearish order block.

EURUSD LONG TRADE PLANThe pair is trading in a global bullish trend supported by the rising trendline on D1. On the intraday view, the pair is currently trading on a minor bearish trend looking to test the trendline. In my view, the pair will eventually break above the falling channel which will indicate a bullish rally again.
Please do your own analysis before placing any trades.
Cheers and Happy Trading.

EURUSD Will Go Lower! Sell!
Here is our detailed technical review for EURUSD.
Time Frame: 4h
Current Trend: Bearish
Sentiment: Overbought (based on 7-period RSI)
Forecast: Bearish
The market is approaching a significant resistance area 1.168.
Due to the fact that we see a positive bearish reaction from the underlined area, I strongly believe that sellers will manage to push the price all the way down to 1.159 level.
P.S
Please, note that an oversold/overbought condition can last for a long time, and therefore being oversold/overbought doesn't mean a price rally will come soon, or at all.
Disclosure: I am part of Trade Nation's Influencer program and receive a monthly fee for using their TradingView charts in my analysis.
Like and subscribe and comment my ideas if you enjoy them!

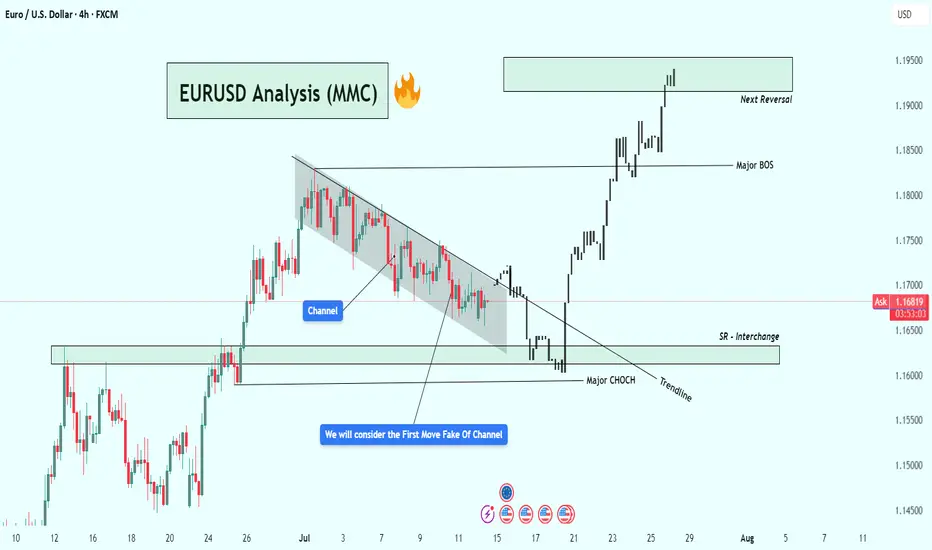
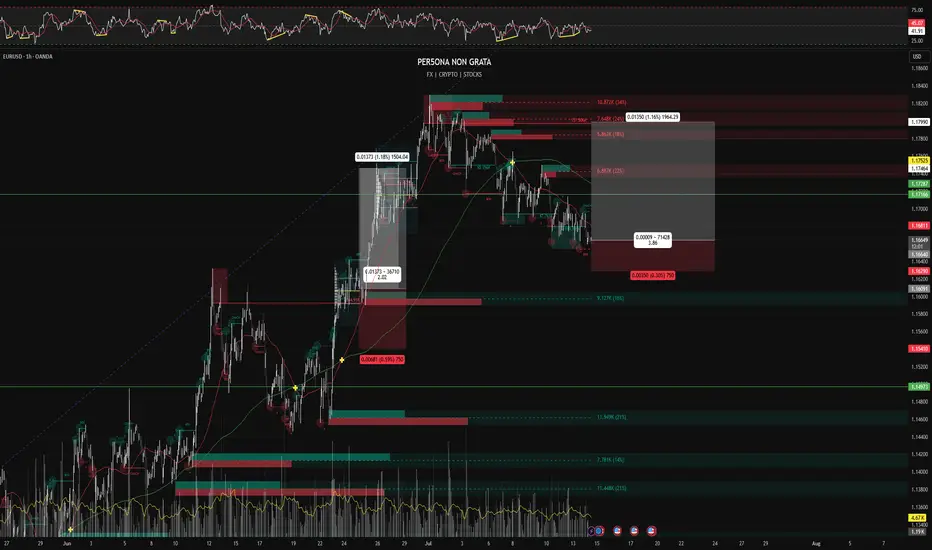
EURUSD Analysis – Smart Money Breakout + Reversal Zone in Play🔹 1. Bearish Channel & Liquidity Trap Setup
Price action from late June into mid-July formed a clearly defined descending channel, with consistent lower highs and lower lows. This structure likely attracted retail traders into short positions, expecting continued downside.
💡 Key Insight: The initial breakout of the channel was a fake move — often referred to as a liquidity grab or inducement. This is typical in smart money models where institutions trap early traders before the real move begins.
🔹 2. Major CHoCH (Change of Character)
Shortly after the fakeout, price sharply reversed and broke a major internal structure level, giving us our first CHoCH confirmation. This is a critical event in SMC, signaling a possible trend reversal from bearish to bullish.
Why it matters: A CHoCH after a channel + fakeout combo is a strong reversal signal, especially when supported by volume and aggression.
Visual cue: Look at the bullish engulfing momentum candle post-fakeout — this was the moment smart money entered.
🔹 3. Trendline Break + SR Interchange (Support/Resistance Flip)
Following the CHoCH, price broke the trendline and came back down to test a high-probability SR Interchange Zone — an area where previous resistance turned into fresh support.
This zone also aligns with the order block and inefficiency area, making it a premium entry for institutions.
Notice how price respected the zone before launching aggressively upward.
🧠 Note: This was the cleanest entry point in this setup — combining structure break, liquidity, and a demand zone.
🔹 4. Major BOS (Break of Structure)
After the retest, EURUSD broke the last major lower high, confirming a Bullish BOS (Break of Structure). This is where many traders realized the trend had shifted.
Market sentiment flipped from bearish to bullish.
Momentum increased, indicating institutional buying pressure.
🔹 5. Next Target: Reversal Zone (Supply Area)
Price has now reached a critical supply zone (1.1930 – 1.1970) where the next major reaction is likely to occur. This area was previously a strong rejection point, and it aligns with a potential higher timeframe supply zone.
⚠️ Watch for:
Bearish rejection wicks
Liquidity sweeps above highs
Bearish engulfing or mitigation patterns
CHoCH on lower timeframes (1H, 15m)
✅ Key Trading Takeaways:
Liquidity Trap: Retail was trapped inside a clean channel.
Fakeout Move: Induced shorts were wiped out.
CHoCH & BOS: Clear reversal pattern with momentum.
Perfect Retest Entry: Price retested demand and launched.
Current Area = Supply/Distribution: Great place to look for shorts or take profits.
📌 Possible Trading Plans:
🔸 Plan A: Reversal Short (Countertrend)
Entry: Inside 1.1930–1.1970 zone
Confirmation: Bearish PA + LTF CHoCH
TP1: Previous BOS (~1.1830)
TP2: Demand zone retest (~1.1650)
SL: Above 1.1980–1.2000
🔸 Plan B: Continuation Long (Breakout Bias)
Entry: Break + Retest above 1.2000 psychological level
SL: Below breakout wick
TP1: 1.2100
TP2: 1.2200+
🔖 Concepts Applied:
Smart Money Concepts (CHoCH, BOS, liquidity sweep)
Price Action Structure
Trendline break and retest
Supply & Demand Zones
Support/Resistance Flip (SR Interchange)
Volume + Momentum Confirmation
🔄 Conclusion:
This chart demonstrates a classic Smart Money narrative:
“Trap the retail, shift the structure, drive price into premium, then reverse.”
We're now at a make-or-break supply zone. Watch price behavior carefully — this is where smart traders either secure profits or prepare for the next leg.