Fed speak - Not broken, not cutting “Don’t fix what isn’t broken” seems to be the Fed’s current stance. Two Fed officials made that clear over the last 24 hours.
Vice Chair for Supervision Michael Barr warned that tariffs could fuel inflation by lifting short-term expectations, triggering second-round effects, and making inflation more persistent.
New York Fed President John Williams echoed that view, noting that tariff-driven inflation is “likely to get stronger in the months ahead.” He also called policy “well positioned” and said the Fed needs more data before making any move.
EUR/USD has formed a rising wedge pattern on the daily chart—typically a bearish structure that warns of a potential reversal. Price action has narrowed, building two clear tops. The downside target from the wedge could potentially be 1.1066 initially, and possibly down to 1.0732 if bearish momentum accelerates.
EURUSD_SPT trade ideas

EURUSD Midweek Outlook | 3H - 15M Dual ViewLeft side chart shows the 3H Bird’s Eye structure — price swept the recent highs but failed to follow through, signaling external bull weakness. That shift in narrative tells me price may be prepping to drop, potentially targeting the SSL below before gathering fuel to attack major highs.
Right side zooms in on the 15M — I’m patiently watching for a clean lower high to break (CHoCH) followed by a pullback to confirm a sell entry. Until I get that proper LTF trigger, I stay on the sidelines. Execution always follows alignment.
Bias: Short
HTF Structure: 3H sweep of highs, showing weakness
LTF View: Waiting for 15M confirmation (break + retest)
Target: SSL below
Mindset Note: Trade what’s shown, not what’s felt. Stay sharp, stay patient.
Bless Trading!

EURUSD 15M READY FOR CRASH TO 1.113???At the moment the price action show BEARISH SIGN (MAKING HH/HL) and trade below SUPPORT turn RESISTANCE @ around 1.1542
Market open with the GAP DOWN today, which as you can see we already fill it
One can go in @ the GAP (AGGRESIVE ENTRY)
Or wait till 1.4874 SUPPORT taken away (MUCH SAFER ENTRY)
All and all im very BEARISH WITH EURUSD THIS WEEK
All the best trader

EURUSD: Can it reach 1.1900?EURUSD is bullish on its 1D technical outlook (RSI = 65.234, MACD = 0.006, ADX = 20.419) and is going for a 3 week high. This is technically a long term bullish wave (since the January 13th 2025 low) on the 3 year Channel Up. We anticipate that this wave will go for the pattern's high by the end of the year, and being limited by the 7 year LH trendline, we expect to aim for at least 1.1900. The 1W RSI has started to post a sequence that resembles the last 3 major ones.
## If you like our free content follow our profile to get more daily ideas. ##
## Comments and likes are greatly appreciated. ##

EURUSD ShortLive Analysis – EURUSD
Market Structure: Price has tapped into the Daily Market Structure zone.
Price Action: Current structure and price action suggest a potential reversal is in play.
Strategy: This is a Structure-to-Structure trade setup.
Targets:
Lower liquidity pools beneath current price
Main Target: Weekly structured liquidity resting at the dotted line
EURUSD Short Part IIEURUSD Analysis
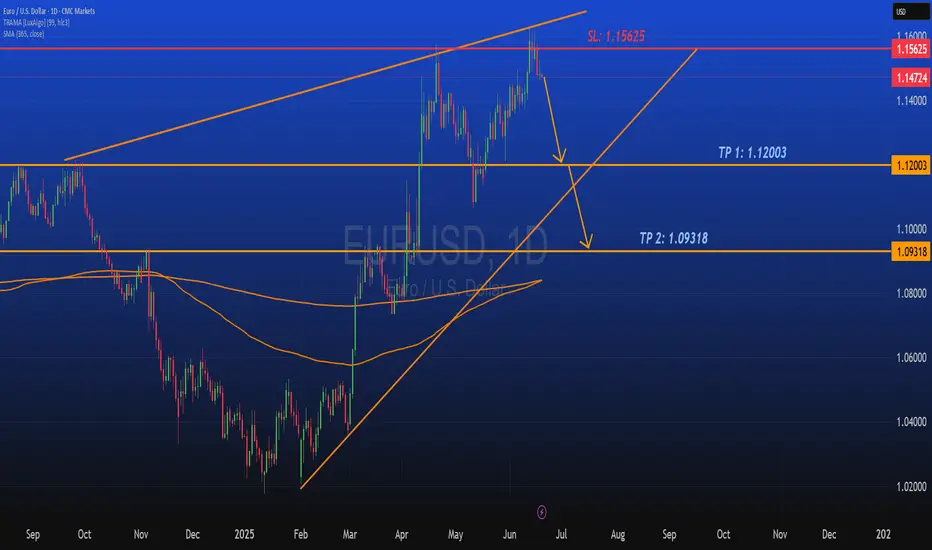
On EURUSD daily chart from CMC Markets quota, indicates a bullish trend with a symmetrical triangle pattern forming. The price has recently broken above a key resistance level, suggesting potential for continued upward movement.
Key Price Levels
Current Price: 1.16932
Stop Loss (SL): 1.16549
Take Profit 1 (TP1): 1.12003
Take Profit 2 (TP2): 1.09318
Trend Analysis
EURUSD shows clear signs on an ascending trend supported by higher lows and higher highs since early 2025. Both orange trend-lines which I created form a symmetrical triangle, with the price nearing the apex, hinting at a potential breakout or reversal which I have been looking for a reversal bearish breakout.
The upward momentum is strong, but the proximity to the upper trend-line and set take-profit levels indicates preparation for a possible correction. I still believe in shorts on EURUSD.
Conclusion
Traders and investors should monitor the price action near the triangle apex for breakout confirmation. The set stop loss and take-profit levels provide a structured approach to managing the trade, balancing potential gains with risk mitigation. Stay tuned for more updates on the trade.

EURUSD A Fall Expected! SELL!
My dear friends,
Please, find my technical outlook for EURUSD below:
The price is coiling around a solid key level - 1.1609
Bias - Bearish
Technical Indicators: Pivot Points Low anticipates a potential price reversal.
Super trend shows a clear sell, giving a perfect indicators' convergence.
Goal - 1.1532
About Used Indicators:
The pivot point itself is simply the average of the high, low and closing prices from the previous trading day.
Disclosure: I am part of Trade Nation's Influencer program and receive a monthly fee for using their TradingView charts in my analysis.
———————————
WISH YOU ALL LUCK

EURUSD Sell/ShortFundamental Analysis
EURUSD rates is being influenced by the current Eurozone's economic performance, driven by key economies like Germany and France, continues to be shaped by industrial output, consumer confidence, and inflation trends. The European Central Bank (ECB) has likely maintained a cautious monetary policy, with interest rates possibly held steady or adjusted slightly to combat inflation while supporting growth. On the U.S. side, the Federal Reserve's stance on interest rates, potentially in a tightening phase to address persistent inflation plays a critical role. Recent U.S. economic data, including GDP growth, employment figures, and consumer spending, may indicate a robust dollar, putting downward pressure on EURUSD. Additionally, geopolitical tensions, energy prices (affecting Eurozone energy imports), and trade balances between the U.S. and EU are likely contributing to volatility. Given the current date, recent ECB and Fed statements or data releases for June 2025 inflation reports.
Technical Analysis:
Based on the provided EURUSD 1D chart (covering mid-2024 to mid-2025), the following technical observations can be made:
Trend and Moving Averages:
For EURUSD it shows a descending trend from a peak around 1.48 in mid-2024, with a potential reversal or consolidation forming in mid-2025. The 50-day and 200-day moving averages (depicted as orange lines) are sloping downward, with the price recently testing these levels around 1.12-1.13. A break above the shorter-term moving average could signal bullish momentum, while a failure to hold might confirm a continuation of the downtrend. Looking for key support levels here are identified at 1.09318 (TP 2) and 1.08000, with the current price hovering near 1.12003 (TP 1). Resistance is notable at 1.15625 (SL) and the previous high near 1.4800. The price action suggests a potential bounce from the recent low, with the next target being the resistance zone around 1.15625 if bullish momentum persists. Candlesticks and volume patterns are showing a recent green candlesticks indicate buying pressure, potentially forming a reversal pattern near the 1.12 level. Volume analysis would confirm the strength of this move, with higher volume on upticks supporting a breakout.
Overall Bias:
The technical setup suggests a short-term bullish correction within a broader bearish trend, contingent on breaking and holding above 1.15625. A drop below 1.09318 would invalidate the bullish case and resume the downtrend toward 1.08000 or lower.
Sentiment Analysis
Market sentiment as of June 2025 likely reflects heightened interest in EUR/USD due to recent economic data and central bank policies. Traders and analysts are closely watching for signs of ECB rate cuts or Fed rate hikes, which could sway the pair. On social platforms and financial forums, there may be a mix of caution and optimism looking out for caution due to the Eurozone's economic challenges (energy costs, political uncertainty), and optimism if U.S. data softens, weakening the dollar. The chart's visibility on trading platforms suggests retail and institutional traders are actively monitoring this pair, with a focus on the 1.12-1.16 range as a critical decision point. Sentiment could shift rapidly based on upcoming economic releases or geopolitical developments.
Conclusion
The EUR/USD pair is at a pivotal juncture, with fundamentals pointing to a stronger USD due to Fed policy, while from a technical standpoint suggest a short-term bounce toward 1.15625 if support at 1.12003 holds. Sentiment indicates active trader interest, with eyes on central bank moves. A break above resistance could target 1.4800 (long-term), while a failure might see a decline to 1.08000. Monitor upcoming data for confirmation.
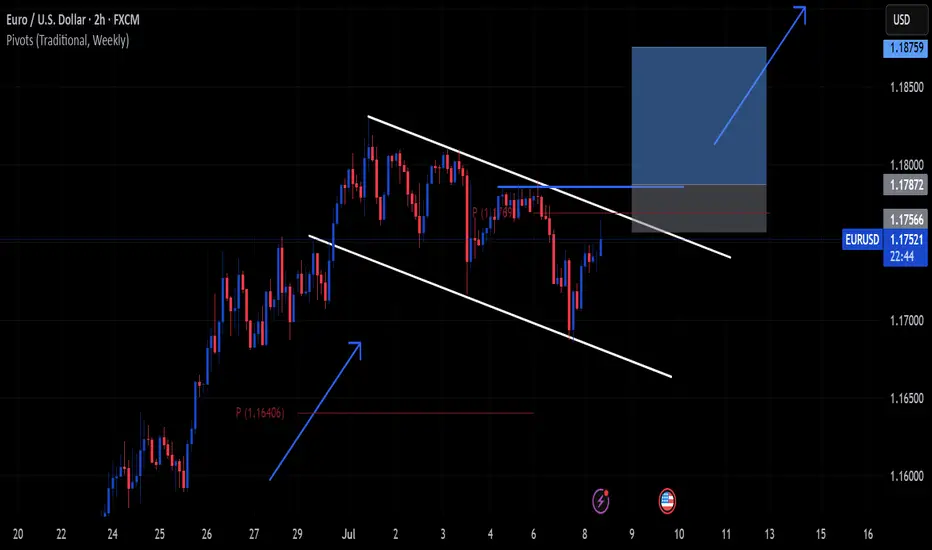
Lingrid | EURUSD Pullback - Awaiting Trend Continuation SignalFX:EURUSD is consolidating above the upward trendline after forming a triangle within the broader ascending channel. The recent pullback tested the 1.1444 support zone, with a rebound hinting at renewed bullish pressure. A push beyond 1.1620 could unlock upside toward the 1.1700 resistance mark.
📈 Key Levels
Buy zone: 1.1444–1.1470
Sell trigger: breakdown below 1.1444
Target: 1.16200
Buy trigger: breakout above 1.1523 resistance
💡 Risks
Triangle breakdown could shift the short-term bias bearish
Failure to reclaim 1.1620 may stall bullish momentum
A sharp drop below the black trendline would invalidate the structure
If this idea resonates with you or you have your own opinion, traders, hit the comments. I’m excited to read your thoughts!


EURUSD On The Rise! BUY!
My dear friends,
My technical analysis for EURUSD is below:
The market is trading on 1.1709 pivot level.
Bias - Bullish
Technical Indicators: Both Super Trend & Pivot HL indicate a highly probable Bullish continuation.
Target - 1.1729
About Used Indicators:
A pivot point is a technical analysis indicator, or calculations, used to determine the overall trend of the market over different time frames.
Disclosure: I am part of Trade Nation's Influencer program and receive a monthly fee for using their TradingView charts in my analysis.
———————————
WISH YOU ALL LUCK

EURUSD is moving within the 1.16850 -1.18310 range👀 Possible scenario:
The euro (EUR) dropped 0.6% on July 7 amid rising trade tensions and fading hopes for near-term rate cuts by the Federal Reserve. Market sentiment turned cautious after U.S. President Donald Trump announced new tariffs targeting 14 countries without trade deals, raising concerns over global trade disruption.
Major exporters like Japan and South Korea could face 25% tariffs if deals aren’t reached, while nations aligning with BRICS risk an extra 10% duty. With a quiet economic calendar on July 8, market volatility may ease, though investors remain alert to any trade policy shifts that could spark renewed market reaction.
✅Support and Resistance Levels
Now, the support level is located at 1.16850
Resistance level is located at 1.18310

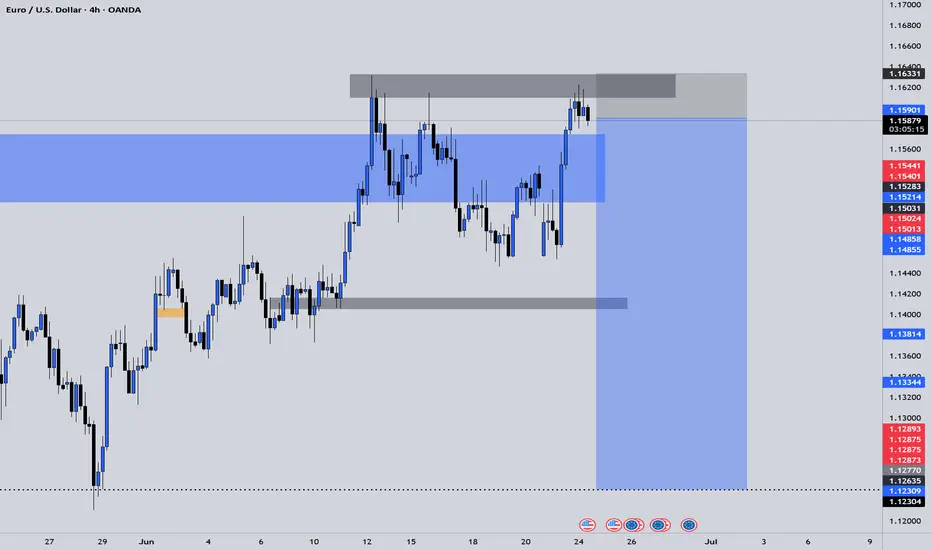
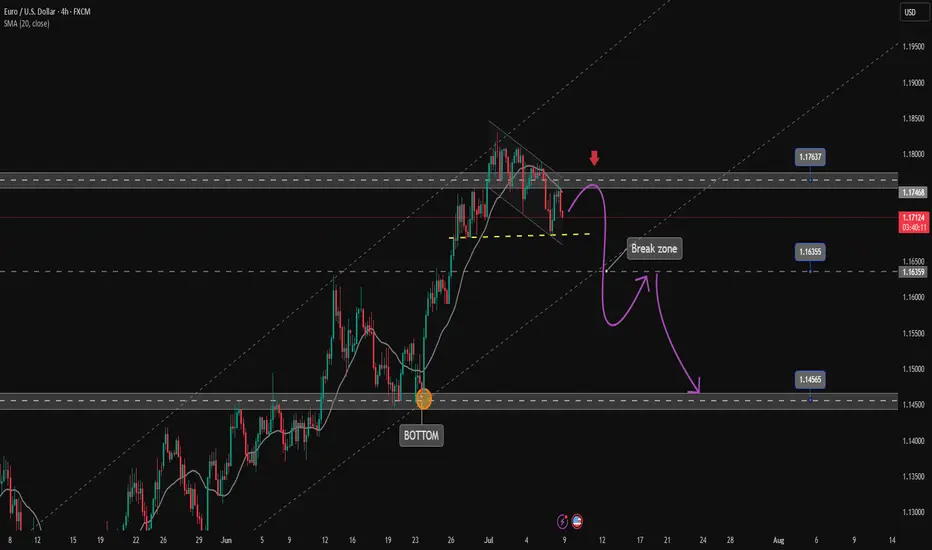
Confirming EURUSD corrective downtrend✏️EURUSD is trading in a downtrend channel. SELL signal is triggered at the current price around 1.172 as the H4 candle failed to break 1.176 and confirmed the Sellers' entry into the market clearly. Target for the downtrend is at 1.145, the Sellers' strength needs to overcome the Break out zone of 1.163 first.
📈 Key level
Support 1.163-1.146
Resistance 1.176
SELL DCA Trigger: Break 1.163
BUY Trigger: The price trades about 1.163.
EUR/USD Slides Below 1.1720 - Dovish Euro Data and Hawkish FedThe euro continued to retreat against the U.S. dollar in Tuesday’s European session, with FOREXCOM:EURUSD falling to 1.17163, pressured by weakening Eurozone fundamentals and renewed U.S. dollar strength.
Technically, the pair has broken below a short-term support zone around 1.1745, marking a clear shift toward bearish momentum. Price action on the 4-hour chart shows a rejection from the 1.1773 resistance zone last week, forming a descending pattern as sellers gained control. Multiple indicators confirm the downward bias.
The MACD (19,39,29) and MACD (12,26,9) are both printing bearish crossovers, with declining histograms indicating increasing downside momentum. Meanwhile, the JoeChalhoub_FXForecaster V1, a custom indicator, shows fading bullish pressure with histogram bars turning pink and gradually weakening. The non-repainting version supports the same trend, reflecting reduced bullish participation.
Adding to the technical signals, the OsMA oscillator remains negative and is steadily declining, underscoring the persistent bearish sentiment.
On the fundamental side, pressure on the euro increased after this morning’s German Industrial Production data missed expectations, further reinforcing concerns about stagnation in Germany. This comes amid ongoing dovish signals from the European Central Bank (ECB), which is widely expected to maintain a cautious stance through Q3.
In contrast, the U.S. dollar is gaining ground as investors respond to Friday’s robust Non-Farm Payrolls (NFP) report and increasingly hawkish rhetoric from Federal Reserve officials. The central bank has hinted at the possibility of additional rate hikes should inflation remain sticky, widening the policy divergence between the Fed and the ECB.
Key support levels for EUR/USD are now seen at 1.16890, followed by a critical zone at 1.16184. A break below these areas could open the door toward the 1.15230 region in the coming sessions. On the upside, resistance lies at 1.17498 and 1.17730.
Outlook:
The path of least resistance for EUR/USD remains lower in the short term. Unless upcoming data reverses the current macro narrative, the euro may remain on the defensive.
Current Trade Status
Opened - 7/7 @ 7:51 PM - 1.17043
Target - 1.16184
SL - 1.18289
Current Trading Account Status - (-0.007%)
This is not trading advice. You should always perform your own research and technical analysis before opening a position.

EURUSD Sell analysis/ideaThis trade is based on the daily and 4-hour timeframes and executed based on reversal trading and trend formation. Complete explanation in the video!

EUR/USD at 1.1750 as EU Pushes Trade DealEUR/USD trades around 1.1745 in Tuesday’s Asian session, supported by strong Eurozone retail sales for May. The Euro benefits as the EU aims to finalize a preliminary trade deal with the US this week, seeking to maintain a 10% tariff beyond the August 1 deadline while negotiations continue. The proposed agreement would keep the 10% base tariff but exempt sensitive sectors like aviation and alcohol, which helps lift market sentiment toward the Euro.
Eurostat data showed retail sales rose 1.8% year-on-year in May, beating expectations of 1.2% but slowing from April’s 2.7%. Monthly sales fell 0.7%, matching forecasts.
Resistance for the pair is at 1.1830, while support is at 1.1730.

Eurousd techinical analysis.Eurousd techinical analysis next move posibale at h1 time frame.not finchinal advice.

EURUSDPreferably suitable for scalping and accurate as long as you watch carefully the price action with the drawn areas.
With your likes and comments, you give me enough energy to provide the best analysis on an ongoing basis.
And if you needed any analysis that was not on the page, you can ask me with a comment or a personal message.
Enjoy Trading ;)

EUR/USD Trade Plan – Sell Limit StrategyEUR/USD has shown signs of completing a 5-wave bullish structure on the 4H chart, with price now re-testing a key supply zone. A Sell Limit has been positioned at 1.17962, anticipating a sharp reversal back toward the order block zone.
🔍 Technical Analysis
The chart shows a clear Elliott Wave formation, with wave V forming a weak new high, indicating buyer exhaustion.
Price is approaching the 1.17960–1.18013 supply zone, previously unmitigated.
This zone also holds an Order Block (OB) and liquidity above wave III, making it a prime area for institutional sell triggers.
📌 Entry: 1.17962
🛑 Stop Loss: 1.18113
🎯 Target Zone: 1.17122
📈 Risk–Reward: 3R – 6R - 10r potential (depending on trade management)
🧠 Fundamental Outlook
The upcoming trading week is filled with market-moving events from both the US and Eurozone:
🇺🇸 Key USD Events
Non-Farm Payrolls (Fri): Forecast 147K; strong print = bullish USD.
Unemployment Rate: Expected at 4.1%.
Powell Speech, ISM Services PMI: Will impact rate expectations and USD strength.
🇪🇺 Key EUR Events
CPI Flash Estimates: Any surprise may shift ECB tone.
Lagarde Speaks: Markets listening for any policy hints after soft data.
🧩 The combination of a potentially strong USD and weakened Euro fundamentals adds weight to a bearish EUR/USD outlook.
💡 Why This Setup Works
Perfect Liquidity Trap: The zone is designed to trigger late buyers before reversal.
Clean Risk–Reward: Defined SL with a high-probability downside path.
Macro + Technical Confluence: Both align toward downside potential.
Target OB: Strong institutional demand seen at 1.1712 offers a natural take-profit zone.
⚠️ Execution Guidance
Enter only if price hits the Sell Limit zone cleanly.
Avoid execution during red news releases.
Partial TP suggested near 1.1740 (around 2R–3R) to lock early profit.

EURUSD 15/3 Pullback LongThis is the follow up idea. The 1-hr chart already show bullish. Will be waiting for the pullback probably liquidation and long.

The Day AheadData Releases:
United States:
NFIB Small Business Optimism (June): Offers insights into the health of the US small business sector. A lower-than-expected reading may point to rising concern over economic conditions and future earnings amid persistent inflation and tight credit.
NY Fed 1-Year Inflation Expectations: Closely watched for signs of shifting consumer sentiment. Any uptick could reinforce expectations of policy caution from the Fed.
Consumer Credit (May): Indicates household borrowing trends. A sharp slowdown may reflect waning consumer confidence or the impact of high interest rates.
Japan:
Economy Watchers Survey (June): A forward-looking gauge of economic sentiment among service sector workers. Deterioration would suggest weakening domestic demand.
Bank Lending (June): Reflects the availability and uptake of credit; slowing lending growth would hint at weakening economic momentum.
May BoP Current Account & Trade Balance: Current account surplus strength often reflects export health and foreign income. A narrowing surplus may indicate external demand headwinds.
Germany & France:
May Trade and Current Account Balances: Provide signals on Eurozone’s external sector strength. Germany’s export engine will be in focus given recent signs of industrial weakness. France’s figures will also be monitored for imbalances amid sluggish domestic demand.
Central Bank Developments:
Reserve Bank of Australia (RBA) Policy Decision:
The RBA held rates steady, as expected, amid persistent inflation in services. While the bank acknowledged progress on headline inflation, it retained a tightening bias, citing risks from strong wage growth and sticky price pressures. Markets are increasingly sensitive to signs of future hikes, particularly with global central banks pivoting toward a more dovish stance.
European Central Bank (ECB):
ECB’s Joachim Nagel reiterated a cautious tone, emphasizing the need for data-dependency in future policy moves. He signaled concern about upside risks to inflation, especially from services, reinforcing the ECB’s slow path to easing despite recent rate cuts. His comments support market pricing of only gradual rate reductions through the remainder of 2025.
This communication is for informational purposes only and should not be viewed as any form of recommendation as to a particular course of action or as investment advice. It is not intended as an offer or solicitation for the purchase or sale of any financial instrument or as an official confirmation of any transaction. Opinions, estimates and assumptions expressed herein are made as of the date of this communication and are subject to change without notice. This communication has been prepared based upon information, including market prices, data and other information, believed to be reliable; however, Trade Nation does not warrant its completeness or accuracy. All market prices and market data contained in or attached to this communication are indicative and subject to change without notice.

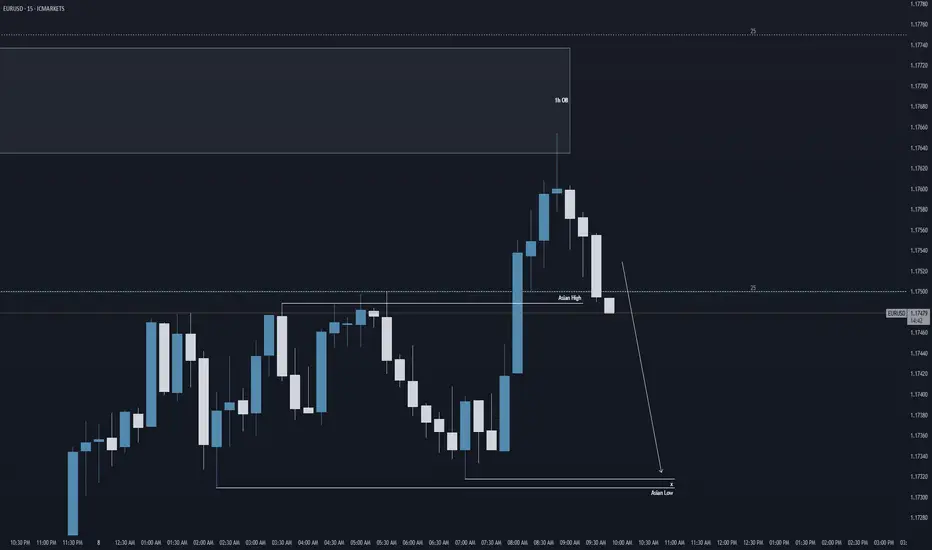
EU: Take out Asian Low Liquidity?Hi everyone,
Looking at EU at this potential pivot point of 1.175.
We've taken out the Asian highs, bouncing of a 1h order block. We could potentially have the opportunity of price creating a bearish leg towards the Asian lows.
Regards,
Aman