EURUSD A Fall Expected! SELL!
My dear friends,
Please, find my technical outlook for EURUSD below:
The price is coiling around a solid key level - 1.1609
Bias - Bearish
Technical Indicators: Pivot Points Low anticipates a potential price reversal.
Super trend shows a clear sell, giving a perfect indicators' convergence.
Goal - 1.1532
About Used Indicators:
The pivot point itself is simply the average of the high, low and closing prices from the previous trading day.
Disclosure: I am part of Trade Nation's Influencer program and receive a monthly fee for using their TradingView charts in my analysis.
———————————
WISH YOU ALL LUCK
EURUSD_SPT trade ideas

Is this THE drop? THAT drop that drop everything with it? Is this THE drop?
THAT drop that drop everything with it?
free transparent no edit no delete
the biggest yugest drop of the century????
let us know!
free transparent no edit no delete
🐉We value full transparency. All wins and fails fully publicized, zero edit, zero delete, zero fakes.🐉
🐉Check out our socials for some nice insights.🐉
information created and published doesn't constitute investment advice!
NOT financial advice

CHECK EURUSD SIGNAL READ CAPTAINeurusd sell now ✅
entry point (1.16200) (1.16100)
TAKE PROFIT 1: (1.15800)
TAKE PROFIT 2: (1.15450)
LAST TARGET(1.15050)
STOP LOSS (1.16600)

EUR/USD Hits Weekly High as Ceasefire Weakens DollarEUR/USD climbed to a fresh weekly high near 1.1610 during late Asian trading on Tuesday, boosted by a sharp sell-off in the US Dollar following the announcement of a ceasefire between Israel and Iran by President Donald Trump. The truce improved market risk appetite and dampened demand for traditional safe havens like the US Dollar. As a result, the US Dollar Index (DXY) dropped steeply from Monday’s two-week high of 99.42 to around 98.10.
The dollar also came under pressure from shifting expectations around Fed policy. On Monday, Fed Governor Michelle Bowman signaled support for a potential rate cut as early as the July meeting, citing rising concerns over the labor market. “We should put more weight on downside risks to the job market,” she stated, adding that it's time to consider adjusting the policy rate.
Her dovish tone nudged up expectations for a July rate cut, with CME FedWatch data showing the probability rising from 14.5% on Friday to 22.7%.
In the Eurozone, ECB officials expressed concerns over the region’s economic outlook, particularly considering new US tariff policies. President Christine Lagarde, in remarks to the European Parliament, warned that inflation staying near the 2% target is uncertain and noted that survey data points to “some weaker prospects for economic activity in the near term.” She added that risks to growth remain “tilted to the downside.”
Resistance is located at 1.1630, while support is seen at 1.1530.
EURUSD Potential SellHello Traders,
I am focusing on SELLING CMCMARKETS:EURUSD .
EURUSD is (Bigger Picture) is a Buyer's Market. However looking at the way it bought from 1.10649, it does seem to be aggressive or the demand is weak.
Looking to sell back to 1.10649
Good Luck

The Day Ahead Key Economic Data:
US:
Consumer confidence (June)
Regional business activity from Philadelphia Fed and Richmond Fed
House prices (April, FHFA)
Q1 current account balance
Germany:
Ifo business sentiment survey (June)
Canada:
Consumer price inflation (May)
Central Bank Activity:
US Federal Reserve:
Chair Powell testifies before Congress
Other Fed officials (Hammack, Williams, Collins, Barr) also speak
European Central Bank (ECB):
President Lagarde, Guindos, and Lane give remarks
Bank of England (BoE):
Governor Bailey and other key members (Greene, Ramsden, Breeden) speak
Corporate Earnings:
Key results from FedEx and Carnival
Government Bond Auctions:
US Treasury sells 2-year notes
Other Events:
NATO Summit continues (ends June 25)
China’s National People’s Congress Standing Committee meets (through June 27)
Summary:
It’s a heavy day for central bank speeches, led by Fed Chair Powell. Markets will also be watching Canadian inflation and US confidence data for clues on growth and rate paths. The NATO summit and China’s NPC meeting add geopolitical weight, while FedEx earnings may provide insight into global demand trends.
This communication is for informational purposes only and should not be viewed as any form of recommendation as to a particular course of action or as investment advice. It is not intended as an offer or solicitation for the purchase or sale of any financial instrument or as an official confirmation of any transaction. Opinions, estimates and assumptions expressed herein are made as of the date of this communication and are subject to change without notice. This communication has been prepared based upon information, including market prices, data and other information, believed to be reliable; however, Trade Nation does not warrant its completeness or accuracy. All market prices and market data contained in or attached to this communication are indicative and subject to change without notice.


#AN010: De-Escalation, ECB, Oil Prices and more
Hi, I’m Forex Trader Andrea Russo and today we’re going to take a look at this week’s news. Thank you all for the great number of readers I’m receiving these days.
Don’t forget that by visiting my website, you can also connect with me on other platforms and you can also find exclusive Benefits for my readers.
🔶 Key Highlights of the Week
ECB’s Villeroy Confirms Rate-Cut Bias Amid Energy Volatility
Governor François Villeroy de Galhau signaled that the European Central Bank remains open to further rate cuts—even with recent oil-price volatility—due to a strong euro and controlled inflation
Oil Prices Surge—and Recede—on Iran Tensions and Ceasefire News
U.S. strikes on Iran triggered at 5–7% spike in crude, pushing Brent above $77/barrel, before plummeting as ceasefire sentiment returned
Dovish Shift at the Fed
Multiple Fed officials (Bowman, Waller, Goolsbee) openly support a July rate cut, shifting dollar sentiment
Emerging-Market Pressure: Indian Rupee in Focus
Rising oil costs and geopolitical instability weigh on the INR, prompting potential RBI intervention
Geopolitical De-escalation Eases Market Risk
A U.S.-Iran ceasefire triggered a sharp retreat in oil, boosted equities globally, and weakened safe-haven USD and gold
-Forex Market Reactions: What Traders Need to Know
EUR/USD:
Rate-cut window in Europe: The ECB's dovish tone softens EUR's upside, while oil volatility now has less impact.
USD weakness: Dovish Fed commentary has dented dollar strength
Key chart signals: A sustained break below 1.0670 could open further downside toward 1.0600–1.0535.
USD/JPY:
Choppy action off failed breakouts near 148.00—watch for JPY resilience risk amid risk-off repricing
AUD/USD & Other Emerging Currencies:
Oil-driven FX pressure affecting the AUD—tracked via crude sensitivity.
The Indian rupee weakness hints at broader emerging-market stress in risk-sensitive currencies
🛠️ Strategy & Outlook for Traders
Theme Implication for FX
Fed dovishness Dollar softness → supports EUR, JPY, EM currencies
ECB policy flexibility Cap on EUR gains → neutral bias until data confirms
Oil volatility Medium-term risk for AUD, CAD, NOK, RUB
Geopolitical calm Risk-on sentiment → pressure on safe-haven USD & JPY
🎯 Trade Setups:
EUR/USD: Short on fall below 1.0670—target 1.0600–1.0535; stop above 1.0760.
AUD/USD: Short biased if oil sustains above $75; aligned with broader commodity-driven themes.
USD/JPY: Watch for continuation short if risk appetite returns; else, trade reversals at 148.00 key.

EURUSD shortIn my previous analysis in Friday, June 20, I had short pending order on this pair.
Due to US attack on Iran base's over the weekend, I closed it and put another pending short position visible here.
SL: 1.1582
Entry: 1.1550
TP: 1.1357
I expect higher volatility today, but don't expect bigger jump to the upside, so my risk:reward is bigger now.
I expect the price to clean Friday high's and go down again.

EURUSD entering the Bear Zone ...Have an eye on the Orange Circle for a possible short position...
Stay tuned for the comprehensive analysis in next IDEA...
Thank you for your attention and support...
#EURUSD #MJTRADING #FOREX

EURUSD SHORT FORECAST Q2 W26 D24 Y25EURUSD SHORT FORECAST Q2 W26 D24 Y25
Professional Risk Managers👋
Welcome back to another FRGNT chart update📈
Diving into some Forex setups using predominantly higher time frame order blocks alongside confirmation breaks of structure.
Let’s see what price action is telling us today!
💡Here are some trade confluences📝
✅Daily order block
✅15' order block
✅Intraday breaks of structure
✅4H Order block
🔑 Remember, to participate in trading comes always with a degree of risk, therefore as professional risk managers it remains vital that we stick to our risk management plan as well as our trading strategies.
📈The rest, we leave to the balance of probabilities.
💡Fail to plan. Plan to fail.
🏆It has always been that simple.
❤️Good luck with your trading journey, I shall see you at the very top.
🎯Trade consistent, FRGNT X

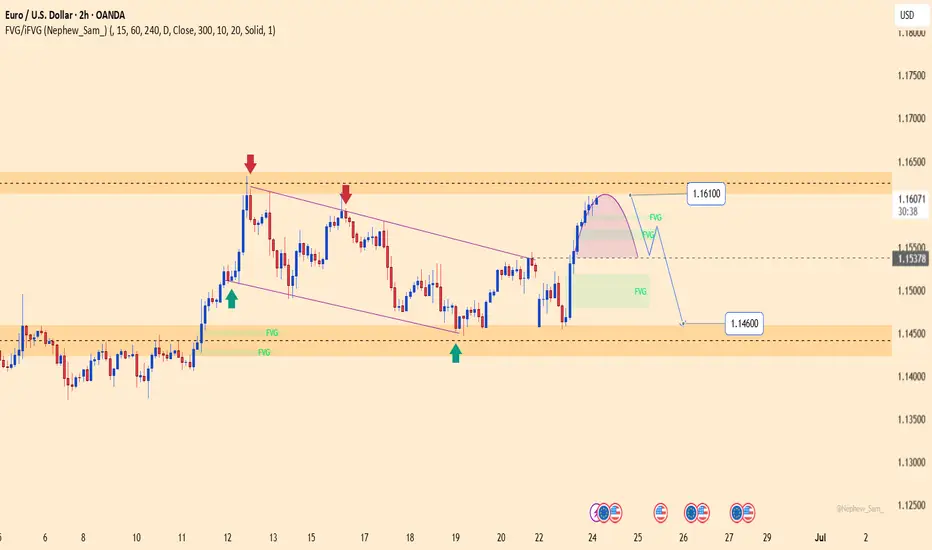
EURUSD – Rejected at 1.16100, bearish pressure re-emergingEURUSD has just completed a technical rebound toward the 1.16100 resistance zone, which has previously rejected price multiple times. The current structure suggests a mild reversal, with a potential pullback toward 1.15378. A break below this support could extend the decline toward 1.14600.
Recent upside momentum came mainly from temporary USD weakness, but the greenback remains supported by expectations that the Fed will keep interest rates elevated, while Eurozone PMI data continues to disappoint.
In summary, 1.16100 remains a key resistance level. If price shows clear rejection here, EURUSD may be poised for a deeper correction in the short term.
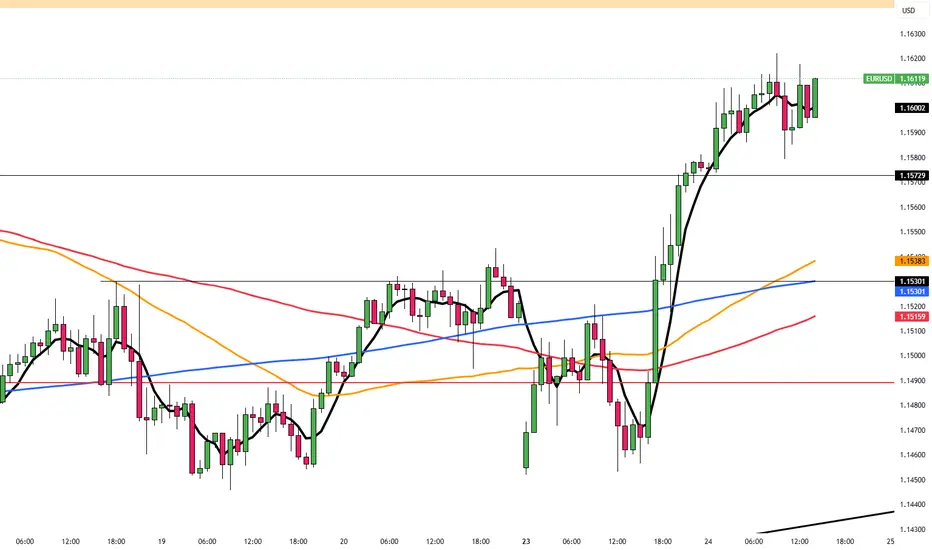
EUR/USD 1-Hour Chart - OANDA1-hour period, provided by OANDA. The current rate is 1.16038, reflecting a 0.22% increase (+0.00252). The chart shows recent price movements, with a notable upward trend and highlighted resistance (1.16095) and support (1.15574) levels. The time frame spans from 13:00 to 28:00, with candlestick patterns indicating market activity.

EURUSD Trading Strategy for the WeekEURUSD is reacting at the support zone of 1.14500. This is an important support zone that helps EURUSD continue to maintain its upward momentum. The uptrend in the h4 time frame is still strong and heading towards the peak of 1.161.
Below the support of 1.145 will be the 1.138 zone. When this 1.138 zone is broken, it confirms that a Downtrend is established. The possibility of breaking this zone is not high, so it is still possible to set BUY signals around these support zones. On the other hand, 1.153 is an important resistance zone in the near future where the pair will have a price reaction before finding the peak of last week.
Support: 1.13800
Resistance: 1.16000
Break out: 1.14600-1.15300
Recommended good trading strategy:
Trade when price confirms in Break out zone.
BUY 1.13800-1.13600 Stoploss 1.13300
SELL 1.16000-1.16200 Stoploss 1.16500

EURUSD Dancing to my tune like i said in my previous post ..if price breaks that resistance level ..it is going to the -61.8 fib extension ......now price is on -61.8 and we can comfirm the reversals with the spike in volume

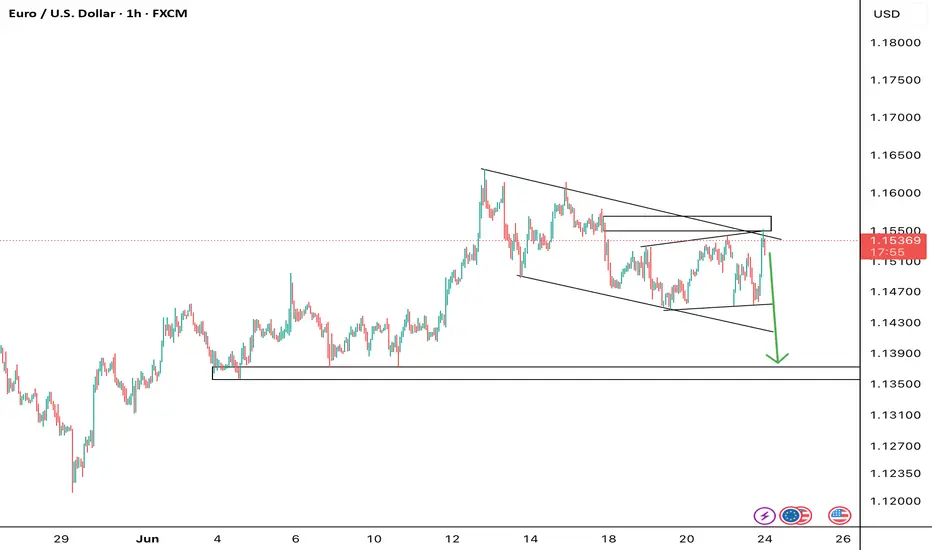
A bullish breakout from the descending channel is anticipated.Chart Breakdown
🔻 Price Action & Structure:
The market is currently trending downward within a descending channel, marked by two parallel white trendlines.
The current price is around 1.14797, with visible lower highs and lower lows, indicating a short-term bearish trend.
🔄 Projected Move:
A bullish breakout from the descending channel is anticipated.
The white projected path shows:
A dip toward the demand zone (highlighted in teal-green) around 1.13400–1.13800.
A reversal from that zone, forming higher highs and higher lows.
A move toward the upper liquidity zone, labeled EQH (Equal Highs) around 1.16000, suggesting a target for buy-side liquidity.
🧠
EQH = Equal High Liquidity
:
The EQH zone marks an area where previous highs are equal or nearly equal — a common target for price manipulation or stop-hunting.
It’s expected that the market will sweep this area for liquidity before possibly reversing or continuing.
💡 Interpretation:
The setup reflects a liquidity-based strategy using smart money concepts.
Bearish short-term → bullish medium-term outlook.
Potential trade idea: Wait for price to tap the lower demand zone, then look for entry confirmation (e.g., bullish engulfing or Ch0CH) to ride toward EQH.

EUR USD LONG RESULT Price fell inside a closing wedge pattern towards the end of the last trading week and broke out of the wedge pattern with the major resistance Trendline laying above for test.
I look the long setup from the support zone in Confluence with the support Trendline of the falling wedge, and price held and moved better than expected hitting our TP.
We'll see if price would dump again from the current resistance zone and major bearish Trendline or break above and probably create new highs, we'll see.
_THE_KLASSIC_TRADER_.

EURUSD: TRADE WHAT YOU SEEThis current price has a history... that's why i advice people to navigate the market like an elephant .... watch howmany times price fell from this level in the past and how many pacent it dropped ...use a line ..do your analysis based on history...if it breacks that level ..its going straight to -61.8 or straight to the monthly trendline ...

EURUSD: TRADE WHAT YOU SEEThis current price has a history... that's why i advice people to navigate the market like an elephant .... watch howmany times price fell from this level in the past and how many pacent it dropped ...use a line ..do your analysis based on history...if it breacks that level ..its going straight to -61.8 or straight to the monthly trendline ...

EURUSD: TRADE WHAT YOU SEEThis current price has a history... that's why i advice people to navigate the market like an elephant .... watch howmany times price fell from this level in the past and how many pacent it dropped ...use a line ..do your analysis based on history...if it breacks that level ..its going straight to -61.8 or straight to the monthly trendline ..

EURUSD SHORT TRADE IDEAAfter seeing some bearish pressure, we can look to enter a short trade after waiting for confirmation
EURUSD is moving within the 1.14000 - 1.16100 range👀 Possible scenario:
The euro fell toward 1.14600 on June 23 as safe-haven flows boosted the U.S. dollar following surprise U.S. airstrikes on Iranian nuclear sites. Markets had hoped for diplomacy after Trump previously hinted at a delayed decision.
Investors remain cautious amid fears of retaliation or oil supply disruptions, lifting demand for dollar assets. Focus now turns to eurozone and U.S. PMI data. Weak European readings could push EUR/USD lower, while strong results may spark a rebound toward 1.15400.
✅ Support and Resistance Levels
Now, the support level is located at 1.14000
Resistance level is located at 1.16100

EUR/USD 2-Hour Chart Analysis2-hour candlestick chart for the Euro/U.S. Dollar (EUR/USD) currency pair, sourced from OANDA, as of June 23, 2025. The current exchange rate is 1.14705, reflecting a 0.45% decrease (-0.00517). The chart highlights recent price movements, with a marked resistance zone around 1.15218 and a support zone near 1.14483. An upward trend is indicated with an arrow, suggesting potential price action toward the resistance level.
